The older driver : studies of assessment and performance : a thesis presented in partial fulfillment of the requirements for the degree of Master of Arts in Psychology at Massey University
121
0
0
Full text
(2) THE OLDER DRIVER STUDIES OF AsSESSMENT AND PERFORMANCE. A thesis presented in partial fulfillment of the requirements for the degree of Master of Arts 1Il. Psychology At Massey University, Palmerston North, New Zealand. Anita M. Ciesionik 2001.
(3) 11. ACKNOWLEDGEMENTS The current dissertation presents fmdings from three studies of older drivers, encompassing issues of medical assessment of fitness to drive and the decrements in driving performance associated with both primary and secondary aging. This research was conducted in the year 2000, under the supervision of Dr. Nancy Pachana and Professor Nigel Long in the School of Psychology at Massey University.. The author would like to acknowledge the invaluable support and guidance given by Dr. Nancy Pachana - thanks for taking up the challenge. Appreciation must also be extended to Professor Nigel Long for taking over at such short notice.. The contribution of both time and effort by staff of the School of Psychology at Massey University is also gratefully acknowledged, in particular Harvey Jones, for his invaluable technical contribution, and Fiona Alpass for her assistance with all things mathematical.. Thanks to my family for their support and understanding, and to Greg for his patience, one-touch typing skills and high tolerance level..
(4) 111. TABLE OF CONTENTS Acknowledgements . . . . . . . . . . . . . . . . . . . .• . . . . . . . . . . . . . . . . . . . . . . . . . . . . . . . . . . . . . . . . . . . . . . . . . . ... 11. List of Tables and Figures .................. ; .............................................. v. I.. Older drivers: A review of the issues The natural decrements associated with age .... .. .. .. .. .. .. .. .. .. .. .. .. .. .. .. .. ... 1 Visual changes . .. .. .. .. . .. . . .. . .. .. .. .. .. . .. . . . .. .. .. . . .. . .. .. . .. . .. . .. . .. .. .. .. .. .... 1 Cognitive demands . . .... . .. . . . .. .. .. .. .. . .. . .. .. . . .. .. .. .. .. . . .. . .. .. . . .. . .. . .. . .. . .. 3 Motor capacity. .. ... ......... .. ........ ... ... ..... ... . .. . ...... .. .... .. . .. . ...... .. ... 6. Dementia and driving . . .. . .. . . . .. .. .. .. . . .. . .. .. .. .. . .. . .. . .. .. . .. . . .. . .. .. .. . .. .. . .. 8 Decrement and driving performance .............................................. 9 The importance of a drivers licence ... . .. . . . . .. . . . . . . . . . . .. . . . . .. . . . . . . . . . . . . . . . . . 11 Driving cessation in older drivers .................................................. 12 Rationale for the present study ..................................................... 14. II.. Models of driving behaviour .. .. .... .. .. .. .. .. .. .. .. .. .. .. .. . .. .. .. .. . .. .. .. .. .. 18 Taxonomic models of driving behaviour .. ..... .. .. . .. .. .. .. .. .. .. . .. .. .. .. .. .. .. 19 Functional models of driving . . .. . .. . . . . .. . . . .. . . .. . .. . .. . .. . . . . . . . .. . . . . . . . . . . . . . . 21 Error theories of driving behaviour ............................................... 23 Michon's three level hierarchy model .............................................. 25. III.. Deciding when to stop: Assessing medical fitness to drive in the elderly Abstract ............................................................................... 28 Introduction .......................................................................... 28 Method ............................................................................... 30 Results ................................................................................. 31 Discussion ............................................................................ 36. IV.. A comparison of major and minor urban areas and their assessment of older drivers Abstract • . . . . . . . . . . . . . . . . . . . . . . . . . . . . . . . . . . . . . . . . . . . . . . . . . . . . . . . . . . . . . . . . . . . . . . . . . . . . . 40 Introduction .. . .. . .. . .. . .. . . . . .. . .. . .. . . . . . . . .. . .. . .. . .. . .. . . . . . . . . . . .. . .. . . . . . . . . . . . 40 Method .............................................................................. 42.
(5) lV. Results. ................................................................................ 43. Discussion ........................................................................... 47. V.. Increasing age and dementia: The effect on perception and reaction time in older drivers Abstract . . . . . . . . . . . . . . . . . . . . .. . . . . . . . . . . .. . . . . . . . . . . . . . . . . . . . . . . . . . . . . . . . . . . . . . . . . . . . . 51 Introduction . . . . . . . . . . . . . . . . . . . . . . . . . . . . . . . . . . . . . . . . . . . . . . . . . . . . . . . . . . . . . . . . . . . . . . . . . 51 Method. .............................................................................. 54. Results. ................................................................................ 59. Discussion. VI.. . . . . . . . . . . . . . . . . . . . . . . . . . . . . . . . . . . . . . . . . . . . . . . . . . . . . . . . . . . . . . . . . . . . . . . . . . . . 63. Where to from here? The focus of the thesis. . . . . . . .. . . . . . . . . .. . . . . . . . . . . . . . . . . .. . . . . . .. . . . . . . . . . .. . . . . . . . 69. Older driver assessment An overview of the principle fmdings . .. . . .. . . . . . . . . . . . . .. . . . . . . . . . . . . . . . . . . . . . . . . 70 The basis of assessment in driver behaviour models ............................ 71 Study limitations and directions for future research ............................. 72 Age related declines in perception and reaction time An overview of the principle fmdings. . .. . .. . . ..................................... 76. Perception-reaction time and driver behaviour models ......................... 77 Study limitations and directions for future research .. . .. . . . . . . .. . . . . . . . . . . . . . . . . 79. VII.. References .. . . .. . . . . . . . . . . .. . . . . . . . . . . . . . . . . .. . . . . . . . . . . .. . . . . . . . . . . . . . . . . . . . . . . . . . . 84. VIII.. Appendices Appendix A.. Ethical Approval for Study I and II .. .. . . . . . . . . . . . . . . . . .. .. . . . . . 93. Appendix B.. Older Driver Assessment Questionnaire ........................ 95. Appendix C.. Facts on Aging Quizz . . . . . . . . .... . . . . . . . . . . . . . . . . . . . . . . . . . . . . . . . . . 99. Appendix D.. Information Sheet for Study I and II ........................... 100. Appendix E.. Ethical Approval for Study III .................................. 102. Appendix F.. Information Sheet for Study III ................................. 104. Appendix G.. Demographic Sheet ............................................... 106. Appendix H.. Mini Mental State Examination ................................. 107. Appendix I.. Common Traffic Signs Driving Assessment Tool ............ 111.
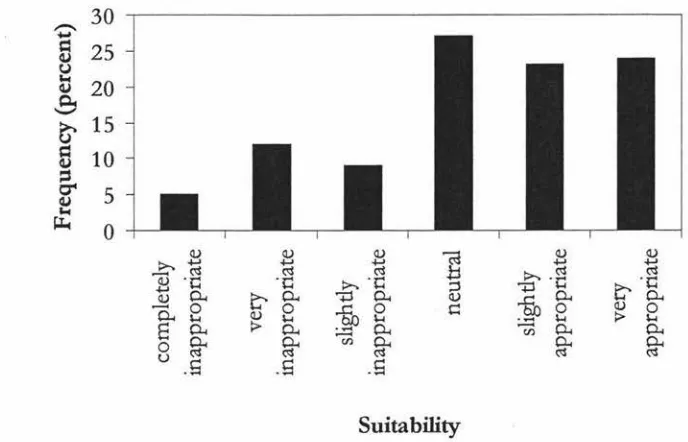
(6) v. LIST. OF. TABLES AND FIGURES. FIGURE. TITLE. Figure 1. New Zealand driver casualties in reported crashes, 1991, per 100,000 people, per 100 million kilometres driven (LTSA, 1996). 19. Figure 2. The hierarchical structure of the road user task (Michon, 1985). 26. Figure 3. General Practitioners views on the suitability of the LTSA common traffic signs driving assessment tool for older drivers. 32. Figure 4. General Practitioners views on the association between referral and breeching patient/ doctor confidentiality. 35. Figure 5. General Practitioners views on the impact of an aging population on driver safety.. 35. Figure 6. Main and minor urban comparison of commonly used methods for assessing fitness to drive in the elderly. 44. Figure 7. Main and minor urban comparison as to who GP's regard as the most appropriate to assess driving skills in the elderly.. 46. Figure 8. Main and minor urban comparison of the association between referral and breeching patient/ doctor confidentiality.. 46. Figure 9. The 6 road signs used in both the LTSA common traffic signs driving assessment tool and the perceptual experiment.. 57. Figure 10. Photographs depicting the position of the video camera (i and ii) and the placement of the sign on the side of the road.. 58. Figure 11. Average distance from the sign for each of the 6 signs across all 3 groups of participants.. 60. Figure 12. Average distance from the sign for each of the 3 vehicle speeds across all 3 groups of participants.. 61. TABLE. TITLE. Table 1. Reasons given by older participants (N=56) for stopping driving.. 13. Table 2. Most common methods used by General Practitioners in assessing fitness to drive in older persons.. 32. Table 3. Circumstances under which General Practitioners most often refer.. 33. PAGE. PAGE.
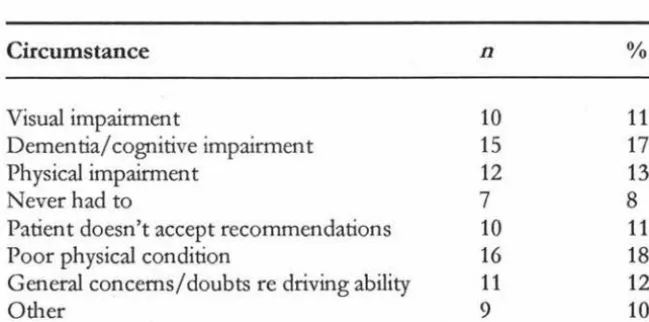
(7) VI. Table 4. General Practitioners views on the most appropriate person(s) for the evaluation of driving skills in older adults.. 34. Table 5. Respondent demographics with regard the location of their medical practice.. 43. Table 6. Differences in stopping distance from the sign for each of the 6 signs and 3 speeds.. 62. Table 7. The influence of vehicle speed on the ability to accurately perceive sign information.. 63. Table 8. The influence of road signs on the ability to accurately perceive sign information.. 63. •. I.
(8) 1. OLDER D .RIVERS:. A REVIEW OF THE ISSUES. Internationally, people aged 65 and-qver are forming a rapidly increasing proportion of society (Heenan, 1993). New Zealand is no exception. By 2001, it is estimated-that older people (people over the age of 65) will account-for 11 % of the New Zealand-population (Statistics New Zealand, 1998). As the baby boom generation advances through their later years, and as life expectancy continues to improve, it has been predicted by Statistics New Zealand that by the year 2031, this figure will literally double, swelling to 22% (Statistics New Zealand, 1998).. Tomorrow's aged population will be accustomed to the high levels of motorisation that have developed in the latter part of last century. With demographers predicting the number of older persons increasing both in total and as a proportion of the whole population (Land Transport Safety Authority, 1994), people aged over 65 will form a rapidly increasing proportion of New Zealand's road users. As such, it is important that as people age they can continue to travel and enjoy their mobility as freely and safely as other road users (Transportation Research Board, 1988).. THE NATURAL DECREMENTS ASSOCIATED WITH AGE According to McCloskey, Koepsell, Wolf & Buchner (1994), the complex task of driving is one that relies on three factors: 1. Sensory acuity (needed to process environmental cues).. 2. Cognitive capacity (which interprets incoming information and formulates an appropriate response). 3. Motor capacity (which helps operate and control the vehicle). However, aging is a continuous process of change, which occurs over the life span, and can result in impairments within these faculties, especially within an individuals health, visual, physical, and cognitive capabilities (Land Transport Safety Authority, 1994).. VISUAL CHANGES The sensory system undergoes a number of changes with age, with perhaps none so important to driving as those changes occurring in the visual system (Pachana.
(9) 2 & Long, 2000). It is thought that of all the sensory information available to a driver, over. 90% of it is visual (Reuben, Silliman & Traines, 1988). Therefore, it is possible that any changes occurring in the visual system may have a deleterious effect on driver safety.. The aging process affects nearly every part of the visual system, resulting in the loss or decline of certain functions. Primarily, as we age, the lens of the eye grows without shedding (which results in a gradual thickening), limiting the amount of light able to reach the retina (Fox, 1988; Medina, 1996), as well as becoming discoloured, taking on an opaque hue (Medina, 1996). This results in decreased visual acuity, or the ability to see clearly - a skill necessary for interpretation of displays, controls, signs, and other environmental cues that may present themselves while driving (Fox, 1988).. Not only is the clarity of visual imagery compromised by a decrease in general visual acuity, it is also influenced by changes in sensitivity to glare, contrast, and levels of illumination, which can affect an older persons ability to drive at night or at times of reduced visibility (Fox, 1988). Since the lens discolours as it ages, as rays oflight hit the lens, they scatter over the retina. This means that as we grow older, we develop a decreased resistance to glare (Reuben Silliman & Traines, 1988). In addition, the period of time necessary to recover from exposure to a glare source increases as we age, which can affect driver performance during the periods of dusk and hours of darkness (Shinar & Schieber, 1991).. In general, older people have more difficulty in seeing objects of low contrast, especially. in the presence of a bright background (Fox, 1988). The decrease in contrast sensitivity is most notable at the higher spatial frequencies, and lower levels of luminance (Ball & Rebok, 1994; Shinar & Schieber, 1991; Sivak, 1995). Decreased light levels while driving pose a problem for older drivers as the fibres of the iris atrophy as we age. This allows less light to reach the retina, and results in an increased demand for greater levels of illumination (Medina, 1996). An older persons ability to drive at night or in periods of dusk is once again affected due to declines in light transmission. When this is combined with a lack of background contrast, driving can become quite a challenge (Fox, 1988)..
(10) 3 General visual acuity is not the unitary component of visual decline associated with increasing age. Peripheral vision, or visual field, (the ability to detect motion, form or colour on either side of the head while looking straight ahead) also decreases with age (Fox, 1988; Pachana & Long, 2000). With age, an opaque ring, called the arcus senilis surrounds the iris (Fox, 1988), the lens becomes increasingly opaque, and pupil diameter decreases (Fox 1988; Medina, 1996). As a result of these changes, peripheral vision - a skill necessary to safely pass approaching vehicles, or to notice pedestrians approaching from the sides -is diminished by a reduction of light reaching the retina (Fox, 1988).. Driver safety can also be impeded by age related decreases in eye movements, depth perception and colour sensitivity. Important for environmental perception, eye movements, or the number of saccades, have been noted as slower and delayed in older drivers (Maltz & Shinar, 1999; Sivak, 1995). Depth perception, or a driver's ability to judge distances, is also impaired with age, especially at times where light levels are low (Sivak, 1995). Colour sensitivity is necessary to extract cues and discriminate between objects while driving (Fox, 1988). However, because the lens thickens and discolours, the eye is less sensitive to colours with shorter wave lengths (such as blue and green), and more colour discrimination errors are made (Fox, 1988; Sivak, 1995).. COGNITIVE DEMANDS Although it would appear that vision is essential for driver safety, the process of driving a motor vehicle is a much more complex task than simply seeing clearly. The act of driving also places a neurocognitive demand on faculties such as attention, visuospatial abilities, motor programming, judgment, memory, sequencing and information processing (Hunt et al, 1997). These neurocognitive demands are an important factor when discussing the impact of aging on driving skill. Although it would appear that cognitive declines are not as widespread as those found in the visual system, changes in certain areas of cognitive functioning have been noted with increasing age that could impact on driver safety.. Attention is the energy necessary to support information processing, and for drivers, it is important this function remains relatively intact with age (Rybash, Roodin & Hoyer, 1995). The importance of this ability in our everyday lives is most apparent when we hear or read a statement that refers to some aspect of attention: "Are you listening to.
(11) 4 me?" "On your mark, get set ... ""or perhaps most importantly, "Probable cause of accident - inattention of the driver in vehicle A" (Kausler, 1991). A faculty that encompasses a variety of processes, the two aspects of attention that appears to be most affected by age are selective attention and divided attention.. Selective attention refers to an individual's ability to distinguish relevant from irrelevant information - such as trying to read a road sign while ignoring a chatting passenger (Plude & Hoyer, 1986). Many studies have found age-related declines in attending to relevant information while trying to ignore distracting information (Conelly & Hasher, 1993; Plude & Hoyer, 1986). Divided attention requires an individual to simultaneously process two or more sources of information, such as driving a car in heavy traffic while trying to listen to the conversation of your passengers. When the dual tasks are not cognitively demanding, age differences in divided attention are negligible. However, the age difference becomes much more pronounced when the concurrent tasks are more cognitively demanding (McDowd & Craik, 1988).. Of all cognitive abilities, it would seem that memory is of greatest concern to older persons, after all, it is not uncommon to hear the phrase "my memory is not what it used to be". The earliest version of human memory systems made a distinction only between short term and long-term memory. Armed with only a dichotomous view of memory, cognitive aging research concluded that age differences were found in long-term memory, but not short-term memory (Smith & Earles, 1996). However, conceptualising memory, with all its facets, into a simple dichotomy was insufficient an explanation, and memory has since been broken down into more complex systems.. Short-term memory is now viewed as consisting of two components -primary memory (simply holding recent information in the mind) and working memory (simultaneously holding and using recent information) (Rybash, Roodin & Hoyer, 1995). It was discovered that while age differences for primary memory were very small, or nonexistent, working memory tasks showed large age differences, indicating that it is the processing requirement in working memory, rather than information storage that produces age differences (Smith & Earles, 1996). Replication of the original study has since determined that processing efficiency was the most important determinant of age differences in working memory (Salthouse & Babcock, 1991)..
(12) 5 Just as the unitary concept of short-term memory was inadequate, long-term memory was also broken down into smaller memory systems - episodic memory (recollection of details of specific events), semantic memory (acquired knowledge about the world) and procedural memory (skills) (Rybash, Roodin & Hoyer, 1995). Procedural memory and semantic memory show negligible age effects, and generally remain well preserved. However, episodic memory is greatly susceptible to decline in old age, resulting from problems with encoding or memory retrieval (Smith & Earles, 1996). This deficit is most exaggerated in more difficult episodic memory tasks involving deliberate processing (Smith & Earles, 1996).. It would also appear that visuospatial processing (commonly known as nonverbal memory) in short term memory might have a tendency to slow in older persons (Rybash, Roodin & Hoyer, 1995). This is a point of theoretical discussion, however, as visuospatial tests tended to be timed, and, as older adults tend to react more slowly, they will tend to perform worse on a timed test (Smith & Earles, 1996). When time was not a factor in tests, both young and older adults were equally able to use nonverbal, visuospatial processing (Smith & Earles, 1996). Therefore, the impact of memory (in all its facets) in normal aging on driving is negligible.. Perhaps the most universally replicated finding in the psychology of aging is the slowing of response to a given stimulus (Kausler, 1991). In fact, slowed reaction time is one of the most certain consequences of aging (Belsky, 1999). The age difference is most noticeable when older people are asked to perform complex, rather than simple tasks. The reason for this is quite simple. Reaction time is broken down into two distinct phases: 1. A 'thinking phase', which is the period of time when we process the incoming. information and decide what action to take. 2. And 'acting time', the time in which we physically carry out the action . It would appear that the more complex the task, the more thinking is required, and as it is thinking time, not acting time, that shows the most dramatic age changes, a complex task will show a more exaggerated effect than a simple task (Belsky, 1999). Delays in reaction time can obviously have grave repercussions within the context of driving, where speed of response is often necessary..
(13) 6 Perhaps the most important cognitive function with regards to driving is an individual's perceptual skills (Pachana & Long, 2000). While sensory processes such as vision are associated with information reception and transmission, perceptual ability refers to the organisation and interpretation of information (Rybash, Roodin & Hoyer, 1995). While research has appeared to establish that information processing declines with age, it has come to light that these deficits can be attributed to. the~. of processing, and that the. ability to process information remains relatively intact with increasing age (Rybash, Roodin & Hoyer, 1995).. So, while it would appear that with normal aging, perceptual ability remains unscathed, older adults are unable to process information as quickly as they could before (Salthouse, 1991). Due to adaptation, the exact consequences of slower processing are not always easy to predict, however, in general, when processing speed is fast, there is opportunity to comprehend a greater amount of information (Salthouse, 1996). This means that compromised speed results in a reduced amount of information being processed. According to Salthouse (1991), ifwe are unable to think quickly, then by definition we cannot think well, and if older drivers are unable to process as much information in a given time period as their more youthful counterparts, then there lies the possibility for more severe consequences on the road.. MOTOR CAPACITY Although changes within an individual's sensory and cognitive capacity with age are important factors when looking at road safety, driving is. a complex task, and deterioration within McCloskey, Koepsell, Wolf & Buchner's (1994) third factor, motor capacity, can also impact on the operation and control of a motor vehicle. An older persons motor capacity depends on the integrity of the musculoskeletal system - the network of bones, joints and muscles that carry out movement (Belsky, 1999). When driving, it is important that a person has the bone strength and muscle power to push down on pedals and the joint flexibility to grasp the steering wheel, but with age comes limitations and impairments in body movements.. All human movement depends on the contraction of muscles. Each muscle has one movement, contraction, and when this occurs, force is exerted on the adjoining bones and motion results (Kalat, 1995). With increasing age come muscular changes. Muscle.
(14) 7 strength tends to peak around age 20, plateaus through middle age, then, beginning gradually once a person reaches 50, muscle strength declines, and accelerates once the individual reaches age 70 (Belsky, 1999; Schneider & Spraque, 1995). Not surprisingly, a decline in muscle strength can, in tum, deleteriously affect an individual's capacity to move, decreasing an older drivers ability to operate a vehicle in a safe and effective manner. This is of most concern in circumstances that require actions of strength, such as emergency braking, or applying the parking brake (Schneider & Sprague, 1995).. Actions can also be limited by osteoarthritis, a common affliction associated with increasing age that wears away the joint insulation, causing stiffuess and discomfort (Belsky, 1999). While not every older person suffers from this condition, it is common enough to warrant concern, and is the top-ranking chronic condition of old age (Belsky, 1999). Motor tasks that require joint flexibility or range of motion (such as turning the steering wheel quickly) may present a problem to those suffering from osteoarthritis, and when it is located in the finger joints, manual dexterity is affected. Manual dexterity can also be affected by natural changes in tactile thresholds, which tend to increase with age, becoming most apparent post age 75 (Schneider & Spraque, 1995). There are also natural decrements in joint flexibility, but it would appear that the degree of decrement is dependant on the region of the body affected (Schneider & Sprague, 1995).. In today's auto-centered environment, driving can be seen as a complex task, requiring skills and abilities such as scanning, tracking, information processing, judgment and decision making (van Zormeren, Brouwer & Minderhoud, 1987). Driver safety relies on these cognitive skills working in conjunction with physical ability. Therefore, dexterity is needed to quickly locate and manipulate accessories and controls, and ease of movement is necessary for quick and accurate response. Any changes within these functions may adversely affect driver safety and become factors in the driver's ability to execute simple driving tasks.. While muscular strength, joint flexibility and manual dexterity are all important factors in driver safety, it has been suggested that perhaps the most important biomedical change with age is the degradation of head movement range, which has a degree of impact comparable to visual decline (Schneider & Sprague, 1995). Isler, Parsonson & Hansson, (1997) investigated the age related effects of head rotation, and discovered that, when.
(15) 8. compared to a younger control group, older drivers display a loss of approximately one third of movement. This significant age related decline has been displayed in previous studies, with similar degrees ofloss (Schneider & Sprague, 1995). Elderly drivers appear to be over represented in intersection collision statistics, with the major driving error being failure to yield right of way (Cooper, Tallman, Tuokko & Beattie, 1993; Frith & Jones, 1991; Isler, Parsonson & Hansson, 1997). When limitations in the degree of neck rotation are combined with declines in visual perception, an older drivers ability to extract information is minimised, especially within demanding traffic environments, such as intersections (Isler, Parsonson & Hansson, 1997; Schneider & Sprague, 1995). The result is an increased risk of traffic accident within these environments.. DEMENTIA AND DRIVING Growing old is one of life's certainties, and it has been acknowledged that the aging process can be attributed to a variety of mechanisms and factors, ranging from cellular to genetic (Rybash, Roodin & Hoyer, 1995). There comes a point in the life cycle where degenerative processes begin to overtake those responsible for regeneration - a phase termed senescence (Rybash, Roodin & Hoyer, 1995). Although the rate of senescence varies between biological systems and individuals, ultimately it will have an effect on everyone (Belsky, 1999). Senescent changes can be hastened by extrinsic factors, such as environmental toxins, and as a result, the terms primary aging and secondary aging have been developed to distinguish between intrinsic and extrinsic senescent processes (Belsky, 1999; Rybash, Roodin & Hoyer, 1995).. Primary aging refers to the universal and inevitable physical changes that are intrinsic to our makeup as human beings (Hoyer, Rybash & Roodin, 1999). In contrast, secondary ~can. be described as any process that serves to affect the rate of primary aging. (Hoyer, Rybash & Roodin, 1999). Thus far the document has discussed the visual, cognitive and physical changes occurring with age, and by definition, they can be seen predominantly as a result of primary aging. However, changes resulting from secondary aging can also impact on older driver safety, with perhaps none so important to the current discussion as the cognitive changes occurring as a result of dementia (the most well known of which is Alzheimer's disease)..
(16) 9. Within New Zealand, some form of dementia affects approximately 7.7% of the population over the age of 65, with the percentage doubling with every 5 years of age (Campbell, McCosh, Reinken & Allan, 1983). The number of affected individuals in New Zealand is projected to increase by almost 100% by the year 2016 - this is in comparison with an estimated increase in the general population of between 18 and 26% (Pachana & Long, 2000) during the same period of time.. Tomorrow's Alzheimer's sufferers will be used to the mobility and freedom driving can offer, and if they are to continue driving in safety, the true impact of this disease on their driving ability must be assessed. At this point in time, the research surrounding the impact of dementia on driving is somewhat controversial. Research has suggested that Alzheimer's patients who continue to drive pose a significant traffic safety risk (Dubinsky, Williamson, Gray & Glatt, 1992). Frightening statistics have been uncovered, and it would appear that of all Alzheimer's patients who continue to drive, one third will have had at least one incident of unsafe motor vehicle operation (accident, violation or 'near misses') in the previous 6 months (Gilley et al, 1991). They also display an annual accident rate that is two and a half times higher than non-dementing older drivers (Drachman & Swearer, 1993).. Despite this, there has also been evidence suggesting that a diagnosis of dementia does not necessitate driving cessation. It would appear that disease duration is not a good predictor of driving ability (Drachman, 1988; Drachman & Swearer, 1993). A progressive disorder, the degree of disability and rate of decline amongst Alzheimer's sufferers varies between individuals (Pachana & Long, 2000), and it has been suggested that tests of driving competence, rather than diagnosis are a better criterion for determining driving ability (Pachana & Long, 2000). More research is needed to determine the specific cognitive functions most affected by a dementing disorder especially within a New Zealand context - in order to improve driver safety in the future.. DECREMENT AND DRIVING PERFORMANCE The understanding of these natural decrements in the physiological processes associated with age is important,. as they are all processes necessary for safe driving.. While it is. important to note that the extent of this deterioration varies greatly between individuals, and that not all older drivers are unsafe, it has been widely assumed that deteriorating.
(17) 10. ability is responsible for an associated change in older persons driving patterns (Schieber, 1994). Compensatory behaviour in older drivers has been widely accepted, encompassing such acts as driving fewer miles, avoiding driving at night, dusk, and rush hours, as well as treacherous weather such as rain and fog (Ball & Rebok, 1994; Cooper, Tallman, Tuokko & Beattie, 1993; Land Transport Safety Authority, 1994; Persson, 1993). Older drivers are also more likely to adopt safe driving practices such as wearing their safety belt, moderating their speed, and not driving drunk (Cooper, Tallman, Tuokko & Beattie, 1993; Schieber, 1994).. While most studies tend to suggest self-regulation, whether or not this modification of driving patterns and habits are conscious acts of compensation is not firmly established (Ball & Rebok, 1995; Cooper, Tallman, Tuokko & Beattie, 1993). However, despite the trend to avoid these high-risk situations, accident rates in older drivers still occur. Over the course of 1998, older drivers in New Zealand were involved in 8% of all injury accidents, and 17% of all fatal accidents (Land Transport Safety Authority, 1999a). In comparison, younger drivers between the ages of 15 and 24 accounted for 31% of all injury accidents, and 25% of all fatal accidents in 1998 (Land Transport Safety Authority, 1999a).. While this may indicate that, as a group, older drivers are considerably safer, research has shown that over the past 10 years, the number of road fatalities amongst those aged over 60 has barely changed, while statistics for those aged under 25 have fallen by 27.2% (Federal Office of Road Safety, 1996). In addition, when accident rates are adjusted for the number of miles driven, crash rates for older drivers are as high as, or higher than, younger drivers (Evans, 1988; Hakamies-Blomqvist, 1993). Research also indicates that accidents involving older drivers tend to occur in daylight with good weather conditions (McGwin & Brown, 1999). These phenomena are indicative of the compensatory behaviour shown by older drivers, and are patterns that have been replicated within New Zealand (Frith & Jones, 1991). So while older persons may adjust their driving patterns and habits, their rate of car accidents per mile driven is comparable to that of their more youthful counterparts.. Although crash severity does not differ substantially with increasing age, the consequences of a given motor vehicle accident are more serious for older drivers, with.
(18) 11 older people more likely to be injured or killed than younger people (Land Transport Safety Authority, 1994). Evans (1988), found that for every year after the age of 20, fatality risk of car occupants in the United States increased by 2%, a phenomenon also evident in New Zealand (Frith & Jones, 1991). Other researchers have also gathered evidence of this fragility effect, substantiating the fact that there are increases in both fatality rates and cases of severe injury for older drivers involved in a motor vehicle accident (McCloskey, Koepsell, Wolf & Buchner, 1994; Peek-Asa, Blander-Dean & Halbert, 1998).. This general pattern of increased fragility with age is visible on New Zealand roads, and can be confirmed by New Zealand traffic accident statistics. Over the course of 1998, drivers over the age of 65 accounted for 17% of the total deaths caused by traffic accident, even though they only held 10% of the car licences (Land Transport Safety Authority, 1999a). During the same time period, older drivers suffering from non-fatal injuries were hospitalized for an average of 11 days, in comparison to an average of 7 days for the 15 to 29 age group, and 8 days for those aged between 30 and 64 (Land Transport Safety Authority, 1999a).. THE IMPORTANCE OF A DRIVERS LICENCE "I can barely hear, barely see, and barely walk. Things could be worse though. At least I can still drive" (Persson, 1993).. Despite the increased risk of death or injury within a given car accident, an older driver's ability to obtain or maintain a drivers licence is an important aspect of maintaining their identification as a functioning and socially capable adult (Persson, 1993). It has been suggested that a marker to successful aging is a person's ability to maintain independence in the community (O'Neill, 1996). A driver's licence not only denotes independence, convenience and responsibility, but also signifies autonomy and competence (Pachana & Long, 2000, Persson, 1993). With 77% of drivers over age 55 perceiving the act of driving as very important, being a licenced driver means that individuals can gain access to appointments, health care, and shopping, as well as allowing the maintenance of social contacts (O'Neill, 1996; Pachana & Long, 2000). Recent figures issued by the New Zealand Transport Minister show that. between May 1999 and February 2001, 120 older drivers made 5 or more attempts at the.
(19) 12 older driver test before passing, at a cost of $41 per attempt (Land Transport Safety Authority, 1999b; "Testing times'', 2001). It was also noted that one individual persevered through 10 attempts before passing (at a cost of $410), which serves to highlight just how important the maintenance of a licence is to drivers over the age of 65 ("Testing times", 2001).. "Driving is a way of holding on to your life. I was 94 years old, and it was like losing my hand to give up driving." (Persson, 1993). The act of driving plays such an important role in affirming an older persons place in society, that when it becomes necessary for an older driver to relinquish their licence, it can often be viewed by the individual as a final rite of passage (Persson, 1993). The loss of a licence is of particular importance to the one third of New Zealand's older persons living in either rural, or minor urban areas (Pachana & Long, 2000). Without a well established public transport system, those that lose their drivers licence may find it difficult to maintain their social contacts, as well as facing increasing difficulty in carrying out daily tasks and routines (Pachana & Long, 2000). With the modem car becoming an essential factor of independent living, for older adults, the loss of a licence can result in loneliness, decreased life satisfaction, and decreases in out of home activity levels (Marottoli et al, 2000; O'Neill, 1996).. The psychological benefits for those older drivers able to maintain their licence are undeniable. As stated, the personal independence and control it offers is an important marker for successful aging. However, the loss of a licence does not only impact on psychological well being, it can also have a physical impact (Owsley, 1997). After conducting a large epidemiological study, Marottoli, Mendes de Leon, Glass & Williams (1997) revealed that driving cessation was associated with an increase in depressive symptoms, even when controlling for socio-demographic and health related factors. In fact, driving cessation was amongst the strongest predictors of increased depressive symptoms. Links have been discovered between depression (and depressive symptoms) and the level of an individual's functional disability (Marottoli, Mendes de Leon, Glass & Williams, 1997). This means that the loss of driving ability or a drivers licence can lead to depression, which can, in tum, further decrease the functioning of older adults (Pachana & Long, 2000)..
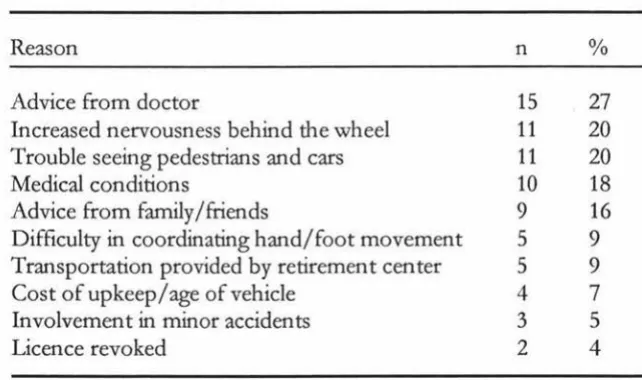
(20) 13. DRIVING CESSATION IN OLDER DRIVERS There is a tendency to think of driving as an inherent right, when in fact documents within both the Land Transport Safety Authority, and New Zealand Government clearly refer to it as a privilege (Pachana & Long, 2000). Despite the significance of a licence for older drivers, it is undeniable that with age come natural decrements across individuals' sensory, cognitive and physical faculties, which can impact on driving ability. This will mean that many older drivers will be faced with the decision to continue, limit or stop their driving.. The decision to cease driving is not made lightly, and it would appear that a number of medical and socio-economic factors play a role. Several studies have shown that the factors associated with driving cessation include increasing age, "At my age, I thought it was time to stop", declining health, medical conditions and recent hospitalisations (Marotolli, Mendes de Leon, Glass & Williams, 1997). It is also thought that socioeconomic factors such as lower income, unemployment, and the availability of alternative transport may play a role (Marottoli, Mendes de Leon, Glass & Williams, 1997). In a recent study Persson (1993) investigated the reasons for discontinued driving in older adults (see Table 1). While most gave multiple reasons for driving cessation, her results have echoed the previous findings of medical and socio-economic factors dette & Branch, 1992; Kington, Reuben, Rogowski & Lillard, 1994).. Table 1. Reasons given by older participants (N=56) for stopping driving Reason. n. %. Advice from doctor Increased nervousness behind the wheel Trouble seeing pedestrians and cars Medical conditions Advice from family/friends Difficulty in coordinating hand/foot movement Transportation provided by retirement center Cost of upkeep/age of vehicle Involvement in minor accidents Licence revoked. 15 11 11 10 9 5 5 4 3 2. 27 20 20 18 16 9 9 7 5 4. Note: Participants could choose more than one response, so the percentage does not equal 100..
(21) 14. Studies have suggested that older drivers believe they should make the decision as to whether or not they continue driving (Persson, 1993). However, at some point, the older driver can no longer be relied upon to be an objective judge of their own ability, and it would appear that it is the General Practitioner's (GP) recommendation that is subsequently most valued in the decision to cease driving (Cooper, Tallman, Tuokko & Beattie 1993; Persson 1993). The GP has a central role within the health care system, and, according to Martinez (1995), is in a unique position to play a significant advisory role in the driving capability of older drivers.. Within New Zealand, under section 18 of the Land Transport Act, there is a legal requirement for medical practitioners to report all cases where either a physical or medical condition is such that, in the interests of public safety, an individual should have driving privileges revoked, or be permitted to drive only under strict conditions and limitations (Land Transport Safety Authority, 1999a). The importance of assessment by a physician can also been recognised by the recent changes to New Zealand licensing laws, which state that a standardised medical examination is required once the driver reaches age 70, 80, and 2 yearly thereafter (Land Transport Safety Authority, 1999a). The Land Transport Safety Authority (1999a) has also published guidelines for medical practitioners who are faced with making decisions regarding an individual's ability to drive.. However, international research has indicated that the decision of a GP is often subjective, due to a lack of firm standards and valid tests of driving competence (Oswley, 1997; Reuben, Silliman & Traines, 1988). Methods of driving assessment have also been under scrutiny, and the validity of testing driving performance with pen and paper tests, as opposed to on road examinations is a point of contention amongst many researchers (Hunt et al, 1997; O'Neill, 1997). Whether or not similar issues exist within New Zealand assessment procedures is unknown, due to the dearth of nationwide research in this field.. RATIONALE FOR THE PRESENT STUDY The aging of the population is an international concern, and as such, has resulted in an upsurge of research focusing on issues concerning the world's older population. The subject of aging and driving is no exception to this fact. It would seem that even though.
(22) 15 almost all aspects of this topic have been investigated, there appears to be a specific focus on the detection of aging decrements, both a result of senescence and those associated with disease, and how they can potentially influence driver performance (O'Neill, 1997).. However, the abundance of international literature in this field can be seen in stark contrast to the apparent dearth of New Zealand literature concerning older adults and driving, and it is this dearth that is the impetus of the current research. Although the discussion thus far has identified a number of issues concerning the older driver, there are two areas of main concern, which warrant further investigation. These are: 1. The true impact of both senescence and dementia (specifically Alzheimer's. disease) on driving skills, and, 2. The medical assessment of fitness to drive conducted by physicians. It is proposed that specific aspects of these topics will be investigated further, in a three-. part study. The rationale for each piece of research is presented below.. Study I Deciding when to stop: assessing the medical fitness of older drivers. In 1995, the Land Transport Safety Authority (LTSA) developed a driving assessment. · procedure in an attempt to both standardise the testing of older drivers, and create an assessment tool that would emulate a real life driving situation, namely, the recognition of road signs. This was then distributed to all General Practitioners in New Zealand.. Since this time, there has been no study conducted as to the level of success, or degree of implementation of this assessment tool, and to date, it would appear that there have been no studies to investigate whether the issues surrounding older driver assessment found internationally are of concern in New Zealand. It is hoped that a large, national survey of General Practitioners will help to ascertain: 1. The current rate of usage of the LTSA common traffic signs driving. assessment tool. 2. Other techniques that are currently used to ascertain driver safety among their older patients, and; 3. Whether the concerns within New Zealand are congruent with those found internationally, or whether there are issues indigenous to New Zealand..
(23) 16. Study II A comparison of major and minor urban areas in their assessment of older drivers. A recent (1996) Australian study conducted by Fox, Withaar and Bashford suggested that there are discrepancies between urban and rural communities with respect to the assessment of older drivers, particularly with regard to referral procedures, use of secondary health professionals, and the assessment methods used.. Within New Zealand, nearly one third of our population aged over 65 resides in either rural, or minor urban areas, and this number is steadily increasing. With the ability to drive playing such an affirming in society, any potential discrepancy in assessment is of concern. It is hoped that additional questions added onto the aforementioned survey of General Practitioners will help to ascertain: 1. Whether any discrepancies exist between minor and main urban areas with. regards to assessment, and if so; 2. Whether they are similar to those found in Australia (or whether they are indigenous to New Zealand) and; 3. The potential impact any discrepancy may have on the assessment of older drivers in New Zealand.. Study III The effect of increasing age and dementia on perception and reaction time in older drivers The effect of driving with dementia has been a somewhat controversial topic. While it would appear that older drivers suffering from dementia are at an increased risk of being involved in an automobile accident, strong arguments have been put forward that individual rates of decline and functioning in patients with dementia necessitate tests of driving competence rather than diagnosis.. Not only are there issues surrounding how to best assess driving abilities, it would also appear that no one in New Zealand has asked whether the signs used in the LTSA common traffic signs driving assessment tool can be perceived by accurately by persons.
(24) 17 of any age, and, in particular, by persons with dementia. Therefore, it is hoped that a simulated driving task will help to discover: 1. How reaction time and perception in drivers is affected by increasing age, as well as the presence or absence of dementia. 2. Whether there are differences between normal older adults and older adults suffering from dementia in terms of sign perception in a semi-realistic setting, as opposed to being shown a two dimensional image in the doctors office. 3. Whether the signs included in the LTSA driving assessment tool can accurately be perceived by persons of any age, and particularly by those persons suffering from dementia..
(25) 18. MODELS OF DRIVING BEHAVIOUR. While the relationship between aging, senescence and driving performance has been intensely investigated in recent years, theories of traffic psychology have not yet satisfied the demand for a comprehensive model of driver behaviour, particularly with regard to older drivers (Huguenin, 1988; Ranney, 1994). With a distinct tendency to focus research and investigations on specific questions and problems (namely particular diving behaviours resulting in accidents) as opposed to theoretical advancement and development, much of our understanding of driver behaviour has been based on empirical generalisations (Huguenin, 1988; Ranney, 1994). This theoretical preoccupation with individual differences in accident causation has created a developmental stalemate, and resulted in mediocre success with regards to the identification of safe driving predictors (Ranney, 1994).. The beginning of the Twentieth Century saw a rapid increase in the predominance of the automobile, and with it came an analogous increase in the number of road traffic accidents. As a course of natural progression, driving began to be considered a perceptual-motor skill, and motor vehicle accidents an inherent failure of this skill (Summala, 1985). These early skill models implied that driver safety was largely determined by their level of skills (such as reaction time and visual attributes) in relation to the situational demands on these skills (Hopewell & Van Zomeren, 1990; Summala, 1985). Initially supported by early accident theorists (after all, if we are clumsy at running, or climbing stairs, why not behind the wheel?) by the mid 1950's, skepticism began to emerge (Summala, 1985).. While there are undeniable differences between peoples driving skills (as in other activities) they do not show up in traffic as reliable and large enough to warrant screening amongst drivers, or to make it useful (Summala, 1985). Modem research indicates that not only do high skill drivers have above average crash rates, but also that the level of driver training and education has little influence in altering accident rates, and the demographic supposedly possessing optimal perceptual-motor skills (young males) actually have the highest accident rate (Evans, 1991). This can be exemplified by New Zealand traffic accident statistics, which clearly demonstrate that drivers aged between 15 and 24 (the majority of whom are male) are the group with the highest accident/traffic.
(26) 19 violation risk (Land Transport Safety Authority, 1999). Although this demographic accounts for only 16% of the licenced population, in 1998, they accounted for 31% of all injury accidents and 25% of all fatal accidents (Land Transport Safety Authority, 1999a). In fact, as shown by Figure 1, when adjusted for the number of kilometres driven, traffic. accident statistics for New Zealand drivers aged between 15 and 24 are comparable to those aged 65 and above - the demographic with the least optimal perceptual-motor skills (Land Transport Safety Authority, 1996).. • • • • • • • • • • • • • • • • • • • • • • • • • • • • • • • • • • • • • • • • • • • • • • • • • • • • • • • • • • • • • • • • 80. -9- killed -+-injured 1.5. .,,.. 40 ~. s. 15-19. 2().24 . 25-29. 30-34. 35.39. 4044. 45-49. 50-54. 55.59. 60-64. 65-69. 7o+. Agt group. Figure 1. New Zealand driver casualties in reported crashes, 1991, per 100,000 people, per 100 million kilometres driven.. TAXONOMIC MODELS OF DRIVING BEHAVIOUR As driver behaviour theory continued to evolve, the realisation that motor vehicle operation requires an interaction between information processing and motor response led to the development of more sophisticated models. When looking at the safety of motorists, it would seem that priority has been given to the identification of risk factors of accident causation, primarily through epidemiological studies. The emphasis appeared to be on trait or test based models, which are taxonomic in that no dynamic relations can be expressed amongst their components - at best the connections are correlative (they are essentially an inventory of facts) (Michon, 1985; Ranney, 1994)..
(27) 20 Early efforts made use of visual attributes and reaction time as predictors, which resulted in unconvincing, negligible relationships with accident causation, presumably due to driver compensation for these deficiencies (Ranney, 1994). Studies into the role of selective attention perhaps provide the best exemplar of taxonomic models. Mihal and Barrett (1976) examined correlations between three information- processing measures (selective attention, perceptual motor reaction time and perceptual style) and accident involvement over a 5 year period. Through retrospective examination of accident statistics from 75 commercial drivers, it was found that both field dependence and selective attention were positively correlated with accidents, while reaction measures were not (Mihal & Barrett, 1976; Ranney, 1994). Subsequent studies have found significant relationships between selective attention measures and driving, and have involved both the auditory and visual modalities of the construct.. Auditory selective attention is most commonly investigated using a Dichotic Listening Task (DL1). This requires a participant response to two separate auditory inputs (such as strings of letters), which are presented simultaneously to each ear, and involves the recording of the number of omissions, intrusions and switching errors (Ranney, 1994; Weiten, 1995). With respect to driving safety, it has been found that stronger correlations exist between driving and switching errors than with either omissions or intrusions, which suggests that rapid switching of attention is of great significance to safe driving (Avolio, Kroeck & Panek, 1985).. Visual attention has come to the fore recently as an accident predictor for older drivers. Owsley and Ball's (1991) measure of attention, the useful field of view (UFOV), incorporates the visual field area over which information can be acquired through a brief glance. They found that drivers aged over 65 with poor visual fields had approximately twice as many intersection accidents as those with normal visual field sensitivity (Owsley & Ball, 1991). When the sample size was increased, correlations were observed between. the UFOV and all types of accidents (Ranney, 1994). Latest research shows that the diminished efficiency of the UFOV in older drivers is exacerbated when driving conditions require division of attention between central and peripheral tasks (Sekuler, Bennett & Mamelak, 2000)..
(28) 21. While taxonomic models of driver behaviour offer promising insights into driver safety, they are not without fault. The use of accidents as a basis for driver evaluation is of concern as accidents are relatively rare events. Evans (1991) and Ranney (1994) claim their infrequency affects statistical power, which decreases the probability of detecting statistically significant differences in rates. Furthermore, questions have also been raised as to the reliability of accident records, prompting concern as to the validity of retrospective studies as opposed to prospective data (Owsley & Ball, 1991; Ranney, 1994). There is also concern over the use of accident data as a criterion measure, as accidents tend to be multi-causal, and may not be related to human error (Ranney, 1994).. FUNCTIONAL MODELS OF DRIVING BEHAVIOUR In contrast to the trait-based perspective of taxonomic models, functional models of. driver behaviour involve the dynamic relationships amongst components, and offer a greater potential for helping to understand complex tasks (Michon, 1985). While individual difference models focus on predicting accident rates, functional models address driving as a whole, emphasising variability and replacing crashes with situational variables (Ranney, 1994). Emerging in the 1960's and 70's as an alternative to skill based models, functional models typically include two general categories: motivational models and information-processing models.. Traffic psychology is fundamentally concerned with traffic safety, and motivational models of road user behaviour are almost synonymous with models of risk taking (Michon, 1985). Assuming that driving is self-paced, and that drivers select the amount of risk they are willing to tolerate in any given situation, motivational models propose that the main influencing factor on driver behaviour is the risk associated with possible outcomes (Ranney, 1994). These models not only focus on driver behaviour over skill, but they also see the driver as an active participant, rather than a passive responder.. Fuller's (1988) discussion of driver behaviour in terms of a threat-avoidance model exemplifies the underlying principles of the motivational paradigm. He proposes that drivers are compelled by two principal incentives - getting to a pre-determined destination, and avoiding potential threats. Driver behaviour can be seen as threatavoidance as, in order to reach our destination, we must continually either avoid aversive stimuli (for example, steering around obstructions) or avoid the possibility of aversive.
(29) 22 stimuli (for example, reducing speed). Through repeated exposure to these obstacles, the basis of risk identification is formed (Fuller, 1988). Compensatory behaviour in older drivers serves to exemplify this point. As revealed in Chapter 1, drivers aged over 65 are more likely to wear a safety belt, moderate speed, and not drive drunk (avoiding the possibility of aversive stimuli) and tend not to drive in heavy traffic or treacherous weather (avoiding aversive stimuli) (Ball & Reebok, 1994; Cooper, Tallman, Tuokko & Beattie, 1993; Persson, 1993; Schieber, 1994).. Despite their appeal, motivational models have failed to generate a significant body of research fmdings (Ranney, 1994). Primarily, it would appear that they lack specificity regarding internal mechanisms (such as goals and motivations), which in tum creates complexity in validation, due to the difficulty in creating testable hypothesis (Michon, 1985; van der Molen and Botticher, 1988). It would also appear that if driving is largely determined by goals and motivations, then the practice of studying driving in a laboratory, simulator or closed course may be immaterial, due to the fact that these situations lack a fundamental goal to the driving experience (Duncan, 1990). Although not as popular as motivational models, information-processing models are still incorporated under the functional paradigm. In contrast to motivational models, information-processing models view the driver as a passive responder, rather than an active decision maker. Developed in response to air traffic controllers' limitations in handling simultaneous messages, these models are usually represented as a sequence of stages (such as perception, decision and response), each assumed to perform a degree of data transformation and take some time for it's completion (Ranney, 1994). The relationship between driving behaviour and information-processing models is best exemplified by studies into automaticity.. Characterised as effortless processing, which develops after consistent practice, the importance of automaticity is not a new idea (Shiffrin & Schneider, 1977). Normally contrasted with the notion of controlled processing, which is described as slow, serial and effortful processing, the notion of automaticity is relevant to driving as much routine driving is done automatically. Based on the theoretical advances of Shiffrin and Schneider (1977) in the field of memory and attention, the characteristics and conditions under which automaticity develop is beginning to influence driving theory..
(30) 23 It is believed that since automaticity is situation-specific, any response depends on the. relationship between that specific situation and all previously encountered situations (Ranney, 1994). This means that a novel situation will disrupt automatic processing and the ensuing uncertainty will instigate controlled processing. One such theory suggests that when uncertainty exceeds a predetermined threshold (which varies between individuals and situations), there is a switch from passive regard of stimuli to active visual scanning (Ranney, 1994). Applied to driving in individuals aged over 65, this may mean that consistent practice following the same route to a destination (such as attending bowls) may lead to automaticity regarding weather variations or traffic conditions. However, if the driver comes across an unexpected obstacle en-route (such as a dog crossing in front of the car) controlled processing will take over.. Whereas motivational models lack detail with regards to the underlying mechanisms, Eysenck (1982) has claimed that information-processing models fail to incorporate motivational and emotional components. There appears to be a lack of specificity regarding the models ability to detail the control mechanisms responsible for changing the allocation of attention (for example, what is it about a novel situation that creates uncertainty and triggers controlled processing?) (Ranney, 1994). There is also a tendency for automatic processes to be defined solely in terms of a lack of attention, when in fact there is a need for greater differentiation amongst different kinds of automaticity (e.g. the identification of those automatic processes that have a direct effect on attention and responding, as opposed to those that have an indirect effect) (Eysenck, 1982).. ERROR THEORIES OF DRIVER BEHAVIOUR In more recent years, theories of error have been applied to driving (Ranney, 1994). To date, much of the current evidence on road user errors has been derived from accident reports and data. However, due to the fact that not all errors committed on the road result in an accident, it has become clear that the use of accident data, which uses human error as a performance measure, is an inappropriate way to analyse the construct, mainly due to the fact that within this context, it is poorly understood and invalidly recorded (Brown, 1990; Brown & Groeger, 1990). This has led to the development of an alternative theoretical approach, which advocates the investigation of errors as part of normal behaviour and has led to an exploration of the construct within the context of all driving behaviour (Ranney, 1994)..
(31) 24 In general, errors can be classified as either perceptual errors (mistakes in situation. evaluation) or execution errors (inability to execute a planned response) (Brehmer, 1990). These two general categories can be dichotomised, with both perceptual and execution errors falling into either a systematic errors category (the systematic difference between a performance measure and a response), or variable errors category (within-subjects variability), both of which act independently of each other (Brehmer, 1990). Systematic errors can be best explained by the limitations of the human information-processing system, while variable errors typify the inherent variability of human nature (Ranney, 1994). According to Brehmer (1990), due to their inherent predictability, it is possible to compensate for systematic errors, and it would appear that humans are quite adept at doing so. This means that this form of error will only result in an accident to an inexperienced driver (Ranney, 1994). Variable errors, however, can be seen in stark contrast. We are generally unaware of variations in driving performance, and even if we were, we are generally unable to predict what state we will be in at any given moment (e.g. we are unable to predict the speed of our reactions, the efficiency of our attention, or our ability to predict the speed of an oncoming car) (Brehmer, 1990). The unpredictable nature of variable errors means that it acts as an obstacle to adaptation, and as such, is a major cause of accidents (Ranney, 1994). One error model suggests that, as drivers are unable to predict the state they will be in, and as it is not sensible to expect their adaptation to variable error to take a behavioural form (such as driving slow on a 'bad judgment' day), a more general protective action is taken (Brehmer, 1990). Safety margins are adopted, which guards against any negative variation in the drivers perception, judgment and behaviour, protecting the individual against the consequences of their errors (Brehmer, 1990). The fact that accidents still occur (especially with relation to speed and accident rate) suggests that although drivers have considerable safety margins, they are not large enough (Brehmer, 1990). This bias towards inadequacy in the safety margins maintained by drivers occurs due to an overestimation of driving skill and an underestimation of road and traffic hazards (especially by drivers who are inexperienced, intoxicated or under stress) (Brown, 1990). This model can result in prediction with regards to the certain types of errors that can be expected within certain situations (Ranney, 1994). Firstly, we can expect a high degree of attentional errors, especially in drivers with inadequate temporal safety margins (when speeding or following too closely), due to self-imposed time stress, and the allocation of.
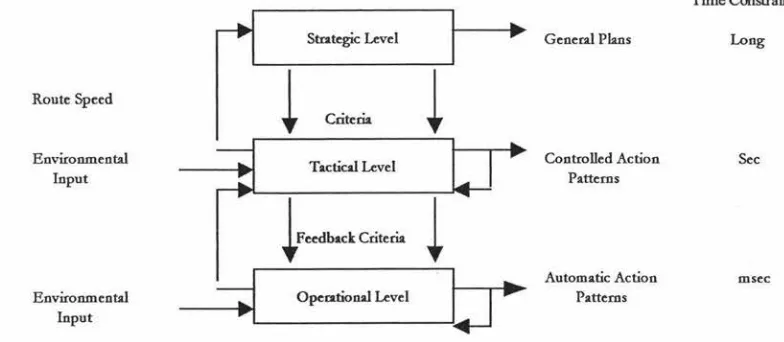
(32) 25 insufficient time to visually sample the wide range of spatially distributed cues that are necessary for driving (Brown, 1990; Ranney, 1994). Secondly, a high frequency of perceptual errors would be expected, given the fact that when speeding or following too closely, drivers effectively limit the amount of time available to process motion cues and traffic information (Brown, 1990). Finally, judgment errors would be anticipated, especially in relation to the evaluation of potential danger presented by traffic hazards, although th e nature of these errors are not well documented in accident studies (Brown, 1990).. MICRON'S THREE LEVEL HIERARCHY MODEL Of all the proposed models concerning driver behaviour, the one that has perhaps made the most significant contribution to the conceptualisation of the driving task is Michon's three level hierarchy model. Hierarchical in the sense that decisions made at a higher level determine the 'cognitive load' at a lower level, Michon's model is based on the notion that there is a hierarchical cognitive control structure of human behaviour in the traffic environment (and also within a mobility and communication context) (Ranney, 1994; Michon, 1985). Conceptualising driving as a concurrent activity at three levels (strategic, tactical and operational), Michon's hierarchical model allows control to be switched between levels, according to driver experience and familiarity of the driving situation (a necessary criteria for a comprehensive model of driving behaviour) (Michon, 1985;Ranney, 1994).. At the strategic level (see Figure 2), there is minimal time pressure, and formation of plans is the most important feature (Michon, 1985). It is at this stage that general trip planning takes place, including choice of route, mode of transport, an evaluation of costs and risks, and the setting of trip goals (such as avoiding heavy traffic) (Michon 1989, Ranney, 1994). Risk acceptance predominates at this level, and the driver, although aware of the danger, nevertheless opts to involve him or herself in a potentially hazardous situation or activity (van der Molen & Botticher, 1988).. At the tactical (or maneuvering) level, it is driver behaviour and subsequent decisions in traffic that predominate (Michon, 1985). This involves the driver's ability to exercise maneuver control, allowing them to negotiate common driving situations, which may include actions such as turning, gap acceptance while overtaking or entering the stream.
(33) 26 of traffic, or avoiding obstacles on the road (Michon, 1989). The time pressure for tactical driving decisions is intermediate (usually measured in seconds), and the level of associated risk involves the fact that performing tactical maneuvers increases the probability that danger will not just be a risk, but actually occur (van der Molen & Botticher, 1988).. The fmal level in Michon's (1985) hierarchy is the operational (or control) level, which consists of immediate vehicle control inputs (the basic actions of driving which are largely automatic habits) such as shifting gears, braking or steering, as well as emergency reactions (van der Molen & Botticher, 1988; Ranney, 1994). Time pressure for operational driving decisions is high (usually measured in milliseconds), and the level of associated risk encompasses the driver's ability to manage the performance of appropriate maneuvers in order to avoid acute danger and threats (van der Molen & Botticher, 1988).. Time Constraint Strategic Level. i. Route Speed. Environmental Input. Environmental Input. i }•"'""'en.-. i. General Plans. Criteria. Tactical Level. ~. Long. Opecational Level. b. ~. Controlled Action Po.ttems. Sec. Automo.tic Action Po.ttems. mscc. Figure 2. The hierarchical structure of the road user task (Michon, 1985). According to Michon (1985), a comprehensive model of driver behaviour not only needs to take into account the various levels (in this instance the strategic, tactical and operational), but also needs to provide an information flow control structure that enables the control to be switched from one level to another, at appropriate times. By conceptualising driving as a concurrent activity that occurs over three levels Michon's model suggests that driver motivation also relates to the different levels of control. For example, while a driver may have selected a route and departure time in an attempt to ensure an uneventful journey (a strategic decision), unexpected situations en route may.
(34) 27 motivate the formulation of short term goals which require adjustment at the tactical level (such as the decision to pass slow traffic) (Ranney, 1994).. Compensatory behaviour may also operate at different levels of control. The rejection of a higher percentage of gaps during on-road merging by older drivers typifies tactical compensations, while their tendency to avoid rush hour or nighttime driving typifies strategic compensation (Planek & Fowler, 1971; van Wolffelaar, Rothengatter & Brouwer, 1987) . It is believed that this compensatory behaviour is triggered by uncertainty (produced from an unexpected event or associated with conflict between motives at different levels of control), which in tum, leads to a reallocation of cognitive resources (Ranney, 1994).. Although as a conceptual model of driving, Michon's three level hierarchy model has not been rigorously tested through empirical measurement, this model has made a significant contribution to the conceptualisation of the driving task. In fact, it has been widely recognised as providing a new impetus for modeling efforts (Ranney, 1994). As such, in Chapter 6, the assessment of driver competence, and the impact of age on reaction and perception time in older adults will be discussed with particular emphasis on Michon's (1985) three level hierarchy model of driving..
(35) 28. DECIDING WHEN To STOP: AsSESSING THE MEDICAL FITNESS OF OLDER DRIVERS. ABSTRACT With the aging of New Zealand's population, there will be an increasing number of older drivers on the country's roads. Although issues regarding the management of older drivers have been raised internationally, whether or not the same issues exist within the New Zealand licencing system is unknown. In order to examine physicians' attitudes, awareness and practice of older driver assessment, a national survey using a randomly selected subset of 350 General Practitioners was conducted. Results indicate a general lack of consensus amongst respondents regarding appropriate assessment methods and management of older drivers. It would also appear that while General Practitioners display sound knowledge of the physical and psychological consequences of aging, the social impact is not so well understood. More research is needed in order to develop standardised assessment and referral methods, as well as investigation regarding ways to improve communication between health professionals and licenced Government agencies.. INTRODUCTION In 1998, there were just over two million full licence holders in New Zealand. Of this number, approximately 16% were aged over 65 (Land Transport Safety Authority 1999a). \Vith the baby boom generation advancing through their later years, and with continuing improvement in life expectancy, the proportion of licenced drivers within this age bracket will steadily increase. Given the high levels of motorisation that developed in the latter part of last century, it is important that as people age they can continue to enjoy their mobility as freely and safely as other road users (Transportation Research Board, 1988).. The continuing reliance on motor vehicles has important implications for the assessment of older drivers. Signifying independence, competence and responsibility, the ability to drive not only offers the older person a means of socialising and participating in community activities, but also acts as a primary mode of access to life's necessities, such as keeping medical appointments (Pachana and Long, 2000; Persson, 1993). For those.
(36) 29 older persons able to maintain their drivers licence, there are benefits of personal independence and control, but with the modem car becoming an essential factor of independent living, for those who relinquish or lose their licence there lies the possibility of depression and loneliness, as well as decreases in life satisfaction and out of home activity levels (Marottoli et al, 2000; Marottoli, Mendes de Leon, Glass & Williams, 1997; O'Neill, 1996). It is for these reasons that accurate assessment of an older person's driving ability is of utmost importance.. Within New Zealand, both health professionals and licenced government agencies (such as the Automobile Association) conduct the assessment of an older person's driving ability (Land Transport Safety Authority, 1999b). Each discipline contributes unique skills to the process, with the agencies responsible for the issuance of licences, and health professionals for the identification of medical conditions that may impair safe driving (Reuben, 1993). Changes to the driver licencing system in 1999 have led to new renewal requirements for older drivers aged over 75. Designed to remove unsafe older drivers from the road, during the month of their 75thbirthday, drivers must renew their licence, at which time they must supply a current medical certificate stating their fitness to drive (Land Transport Safety Authority, 1999b). At the age of 80, and subsequently at two yearly intervals, drivers must renew their licence, produce a medical certificate, and pass an older driver practical test, which is a shortened, 20 minute version of the full licence practical test (Land Transport Safety Authority, 1999c). Failure to successfully complete any one of these provisions results in licence loss.. It is not just the act of licence renewal that can lead to the withdrawal of driving. privileges - older drivers can also lose their licence if their mental or physical condition makes driving unsafe. Under the Land Transport Act, 1986, all registered medical practitioners have a legal requirement to advise of cases in which the cognitive or physical condition of a licence holder may impact on public safety (Land Transport Safety Authority, 1999d). However, while the conditions under which referral must be made are stated clearly in the guide book Medical aspects offitness to drive: A guide for medical. practitioners, the methods used to reach these conclusions are left to the discretion of the individual General Practitioner (with the exception of visual tests, which must measure acuity with a Snellen wall chart, and visual field with a fluorescent wand) (Land Transport Safety Authority, 1999d). Even so, the importance of the medical practitioner's role has.
Figure

+7


Related documents
Given that coronary artery disease is the major cause of death in the Western world, we speculated that this protective Ser249Ser TLR-6 genotype would be overrep- resented in an
Our immediate needs for continuation and expansion of the Mobility Assessment Tool dictated support for both desktop computers (running either Windows or Mac OS X) and Apple
Densitometric parameters (such as mean lung density [MLD], standard de- viation of lung density [SD-LD], kurtosis, and skewness) de- rived from CT attenuation histograms have served
It was decided that with the presence of such significant red flag signs that she should undergo advanced imaging, in this case an MRI, that revealed an underlying malignancy, which
The use of sodium polyacrylate in concrete as a super absorbent polymer has promising potential to increase numerous concrete properties, including concrete
In summary, we have presented an infant with jaundice complicating plorie stenosis. The jaundice reflected a marked increase in indirect- reacting bilirubin in the serum. However,
19% serve a county. Fourteen per cent of the centers provide service for adjoining states in addition to the states in which they are located; usually these adjoining states have
Assessing the Impact of Biodiversity Conservation in the Management of Maize Stalk Borer (Busseola f
Field experiments were conducted at Ebonyi State University Research Farm during 2009 and 2010 farming seasons to evaluate the effect of intercropping maize with
