The economic situation
in the Community
European
Communities
Commission
Directorate-General
for Economic
and Financial
Affairs
3/4
Commission of the European Communities
Directorate-General for Economic and Financial Affairs Directorate for National Economies and Economic Trends
NOTE
In the second half of November, when the present survey had already gone to press, the special money and capital movements which had been noted on the international foreign exchange markets for several weeks-affecting mainly the German mark and the French franc-assumed unusually large proportions. The German and the French Governments were therefore led to adopt various measures, some of them severe ones, to counter speculation and establish better internal and external equilibrium. The existing exchange parities were maintained. At almost the same time the United Kingdom adopted restrictive measures designed to help attain the same objectives.
EUROPEAN COMMUNITIES
COMMISSION
The Economic Situation in the Community
Contents
I. The overall situation
A. Balance sheet for 1968
1. The world economic situation in 1968 2. Demand
3. Production
4. Balance of the markets
B. Outlook for 1969
C. Short-term economic policy
Annex
Council directive of 20 July 1968 granting mutual assistance
II. The situation in each of the Community countries
A. Germany
1. Balance sheet for 1968 2. Outlook for 1969
B. France
1. Balance sheet for 1968 2. Outlook for 1969
C. Italy
1. Balance sheet for 1968 2. Outlook for 1969 D. The Netherlands
1. Balance sheet for 1968 2. Outlook for 1969
E. Be/go-Luxembourg Economic Union Belgium
1. Balance sheet for 1968 2. Outlook for 1969
Luxembourg
1. Balance sheet for 1968 2. Outlook for 1969
Graphs and economic indicators
1. Community trade
2. Economic indicators (graphs and tables)
a) Community b) Germany
c) France d) Italy
e) Netherlands
f)
Belgiumg) Luxembourg
3. Businessmen's views on the industrial situation
a) Germany
b) France
c) Italy
d) Netherlands e) Belgium
f)
Luxembourg Note: Page 3 7 8 10 13 15 23 28 37 39 41 41 47 55 55 63 73 73 79 87 87 93 101 101 101 106 113 113 117 21 33 51 69 83 97 109 121 43 57 75 89 103 115I. THE OVERALL SITUATION
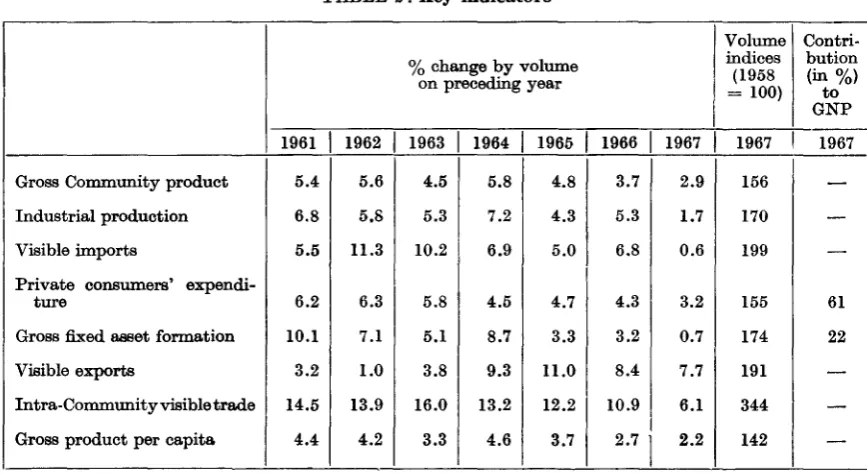
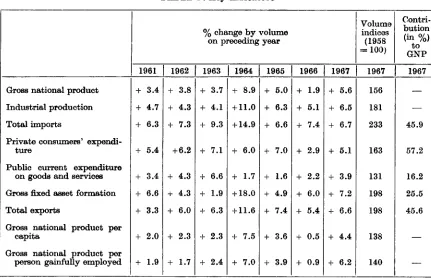
The year 1968 has been one of very vigorous economic expansion for the Com-mu.nity. In spite of considerable production losses in France because of the strike in May and June, the real gross Community product rose by more than 5 o/o from 1967 to 1968, after an increase of barely 3 o/o from 1966 to 1967. This brings the growth of the real gross Community product since 1957 to 69 o/o, compared with 58 o/o in the United States and 38 o/o in the United Kingdom.
The determining factor in the brisk upturn of economic activity in 1968 was a rapid expansion of demand. At first the chief impulse came from external demand and from stockbuilding. In addition, fixed asset formation was running strong. In the course of the year private consumers' expenditure, in its turn, picked up more vigorously.
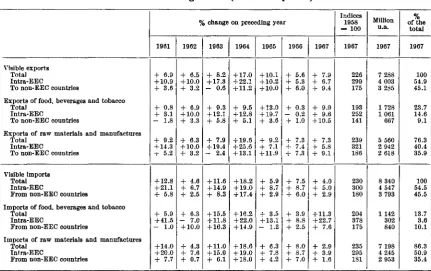
Visible exports from the Community expanded very strongly indeed, especially during the first half of the year, though it must be added that the increase owed much to special factors, especially in the case of sales to the United States and the United Kingdom. According to the foreign trade statistics, the value
of
visible exports to non-member countries rose by an estimated 8.5 o/o from 1967 to 1968, thus exceeeding even the 1966-1967 increase of 7.5 o/o.While the pace of expansion of external demand slackened appreciably as the year went on, internal demand displayed a clear and increasingly steep upward trend. In addition to a very considerable if temporary spell of restocking-although stocks were run down to a sizeable extent in France, investment in stocks probably
same time public investment expenditure rose very appreciably. Gross fixed asset formation, which from 1966 to 1967 had risen in terms of value by only 1.6 %,
consequently expanded at an estimated rate of 8.5 % from 1967 to 1968.
The increase in consumption expenditure gathered more and more speed as the year advanced. It is true that in most member countries, except France, the increase in public current expenditure on goods and services fell short of the preceding year's, but private consumers' expenditure had a decidedly upward trend, especially during the second half of the year. In value, the increase over 1967 was probably around 7.5 %, after a rise of 6.0 % from 1966 to 1967. Noteworthy was the speed at which private consumers' expenditure grew in France. Its total growth in the Community since 1957 works out at 67% in overall terms and at 52% per head of population.
The development of private consumer demand reflects, above all, a rapid advance in the disposable incomes of households. The increase was especially marked in France, thanks mainly to a massive rise in wages in connection with the events of May and June. But in other member countries, too, wage incomes rose appreciably, not least as a result of the improved employment situation. In most member countries, furthermore, transfer incomes rose strongly, and so did incomes from property and entrepreneurship.
In response to the dynamic rise in total demand, supply from within the Com-munity expanded vigorously and, throughout the year, proved highly elastic. Agricultural production, it is true, rose relatively little after the preceding year's excellent results, but industrial production leapt ahead. In terms of the index of industrial production as defined by the Statistical Office of the European Com-munities, the year's increase, notwithstanding production losses in France, probably works out at around 7.5 %, compared with only 1.7% in 1967. While the increase in production was by and large associated with corresponding productivity improve-ments, there was again an upward trend in employment figures during the year, coupled with an appreciable increase in the number of hours worked. Most member countries registered a decline of unemployment in the course of the year, especially Germany and the Benelux countries. In France, however, the events of May and June were followed by a temporary, steep increase in unemployment.
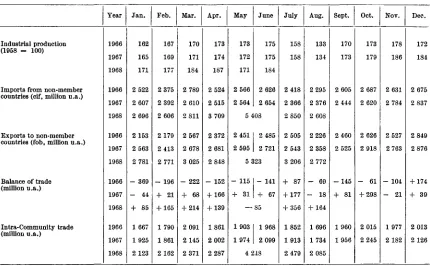
One result of the strong upswing in the Community was a vigorous recovery of imports from non-member countries. W bile the volume of visible imports had stagnated in 1967, the foreign trade statistics suggest that from 1967 to 1968 it rose by 8.5 %. Intra-Community trade probably expanded at the more rapid pace of 14 %, compared with an increase of only 5.5% from 1967 to 1968. This means a more than fourfold increase since 1958.
The Community's balance of visible trade with non-member countries zn 1968 is expected to show almost as large a surplus as in 1967. Since the deficit on capital account was considerably larger in 1968 than in the preceding year, the balance of payments deteriorated sharply. The Community's official net gold and foreign exchange reserves fell by 2 800 million u.a.1 during the first 10 months of
the year, compared with a rise of more than 1 000 million u.a. during the same period of 1967.
Economic expansion in the Community should again be vigorous in 1969. Exports to non-member countries will no doubt grow a goood deal less than in 1968, especially because of the expected slowdown of business activity in the United States, but internal demand may well expand even more rapidly than before.
Gross fixed asset formation is likely to expand more than in 1968 in nearly all member countries, mainly thanks to an increasing propensity to invest on the part of firms. At the same time private consumption will make an appreciably stronger impact on economic growth than it has done in the past year. For one thing, employment should be distinctly higher than in 1968, and secondly there is every likelihood that wages will rise more in most member countries in 1969 than they did in 1968.
Domestic supply is expected to expand very vigorously once more. In the first half of the year, at least, industrial production will still be rather elastic and (as defined for the index of the Statistical Office of the European Communities) might grow in the aggregate by about 8% from 1968 to 1969. On the assumption of a relatively small increase in agricultural output and some further rise of value added in the services sector, the growth of the real gross Community product might thus be of the same order of magnitude as in 1968, that is, between 5 and 5.5 %.
In the light of these demand and supply prospects, unemployment in the Com-munity may be expected to diminish further. In some member countries there may even be a recurrence of a tight situation on the labour markets.
Imports from non-member countries should again be in vigorous expansion in 1969. A possible tendency for raw material imports to slow down should be more than offset by a faster increase in imports of finished goods. Since exports are likely to expand at a slower rate, the surplus on the Community's trade account should diminish appreciably in 1969.
Intra-Community trade should expand even faster in 1969 than in 1968. In spite of the stabilizing effects deriving from rapid import growth and expanding intra-Community trade, prices may come under some upward pressure in the course of the year. For this reason more importance than before will attach to short-term economic policies designed to promote expansion without jeopardizing stability.
A. Balance sheet for 1968
The year 1968 brought with it events of major significance for the Community. Two important stages were reached on the road to economic union. The customs union came into force on 1 July 1968, 18 months before the date envisaged in the Treaty of Rome; internal customs tariffs between member countries were completely abolished, and at the same time the common external tariff came into force, at a general level considerably reduced by the first two instalments of the tariff cuts agreed at the Kennedy Round in GATT. Furthermore, the Council Resolution of 15 October 1968 established freedom of movement for labour within the Community and created additional safeguards for non-discrimination with respect to workers from other member countries.
The establishment of the customs union and of freedom of movement for labour in the Com-munity took place in a favourable economic climate. The year 1968 was one of very vigor· ous and steadily spreading economic expansion for the Community. By the autumn, production was increasing at a pace so far matched only by the boom periods of 1959 and 1965. An appropriate setting for this was created by short-term economic policies designed to pro-mote expansion without jeopardizing stability, such as were explicitly endorsed as necessary by the Council, on a proposal from the Commis-sion, in its recommendation of 9 March and its Directive of 20 July 1968.
Nevertheless, the economy was not spared some difficult situations in 1968, which spelled con-sidemble danger for the Community and pos,sibly even for its very cohesion.
At the tum of the year 1967/68, the Com-munity found itself faced with the recent cur-rency devaluations in the United Kingdom and a number of other countries in Europe and e>verseas. After consultation, especially within the Monetary Committee, Member States decided not to alter the parity of their curren-cies. In practice, the devaluations outside the Community seem so far to have had relatively little effect on the competitive position of its industry. Similarly, the occasional bursts of currency speculation in the course of the year,
as well as the gold crisis in March 1968, had no more than negligible consequences for eco-nomic expansion. Furthermore, the slackening of world trade, which had been feared at the beginning of the year, materialized a good deal later than expected. It was not until the middle of the year, for instance, that the US Congress approved the tax increases proposed some time ago by the President, and their repercussions on world trade, like those of the restrictive measures in the United Kingdom, were relatively slow in taking effect. On the contrary, a number of special factors, such as unusually high steel deliveries to the United States and large sales of consumer goods to the United Kingdom, did much to stimulate Com-munity exports during the first half of the year.
On the other hand, the preferential discount rate for claims arising from foreign transactions was not raised, as had originally been intended. The French Government let it be known that they will completely abolish import quotas on 31 December 1968 and export subsidies on 31 January 1969.1
1. The world economic situation in
1968
The brisk expansion which the world economy experienced during the second half of 196 7 continued throughout the early months of 1968, but around the middle of the year assumed a rather more staid pace, in connection with a slight slowdown in the United States and the United Kingdom, where economic growth had, partly thanks to special factors, been vigorous during the first half of the year. The foreign trade repercussions of these developments were not fully offset by increasingly faster growth within the Community.
In the United States, no reversal of economic trends has so far been caused by the approval, last June, of the tax measures proposed by the Administmtion more than a year earlier (a 10% increase in income and corporation tax), together with the sharp cuts in government spending compared with the original budget estimates for 1968/69. There has been virtually no let-up in the expansion of consumer spending, boosted by substantial wage increases both in industry and in the public sector as well as by a decline in the savings ratio of households, which previously had risen sharply in anticipation of the new tax provisions. Nor does the settle-ment of the wage dispute in the steel industry seem to have had more than a marginal effect on stockbuilding. In any event, the gross national product rose by another 1.2 % in the third quarter of 1968, following a rate of growth of 1.5
'%
from the first to the second quarter.However, the figures available at the time of writing this report suggest that expansion slackened somewhat toward the end of the year. In particular, such indicators as
invest-1 Fuller information on the measures will be found in sec. 1-C "Economic Policy" and sec. 11-B "France".
ment programmes in industry, as well as the trend of residential building projects started during the first half of 1968, point to a slow-down in gross fixed asset formation toward the end of the year.
In spite of this slowdown, the real gross national product will on ,average turn out to be at least 4.5% higher in 1968 than in 1967. A distinct improvement occurred in the overall balance of payments of the United States. Imports increased greatly, not least because of the strike in the copper industry and expecta-tions of a steel strike, while export growth was only moderate; but the capital account probably improved well beyond the target which the US Administration had set itself early in 1968. Calculated on a liquidity basis, the overall balance of payments deficit for 1968 may well turn out to have dropped to $1 500 million from its 1967 figure of $3 600 million.
expanding at an annual rate of about 5
%.
The growth of real gross national product is likely to work out at almost 3 % for 1968. Because of considerable productivity improve-ments, however, the recovery in economic activity did little to alter the employment situation. At 2.5 '% of the labour force, the unemployment ratio was as high in September 1968 as it had been a year earlier. The post-devaluation rise in import prices very definitely made its mark on domestic prices. Between November 1967 and June 1968 the retail price index rose by 4.5 % and, although the price increase now seems to have slackened somewhat, it did continue throughout the second half of the year.With imports still expanding, the trade balance deteriorated once more. In spite of a marked improvement in the second half of the year, the foreign trade deficit is expected to be some $150 million higher than in 1967. Virtually no change, on the other hand, is likely to have occurred in the United Kingdom's basic balance. Latest official estimates put the 1968 deficit at around £500 million, compared with £480
mil-lion in 1967.
Trends in other industrial countries outside the Community were pretty divergent in 1968. In the continental EFTA countries taken together, production probably expanded by around 3 %
in 1968, as it did in 196 7. In some countries where the trend had shown signs of weakening in 1967, the climate improved again in the course of 1968. This applies especially to Sweden, where economic growth had been very slow in 1967 and improved somewhat in 1968, mainly thanks to a vigorous export expansion and investment recovery in response to govern-ment measures. In Switzerland, real economic growth is similarly expected to be slightly in excess of the 196 7 results. Industrial produc-tion, which had been stagnating throughout the preceding year, picked up markedly during the first six months of 1968. The revival owed most to buoyant exports, which brought with them an appreciable improvement in the year's current balance of payments.
In Austria the growth rate of the gross national product was certainly distincly higher than in 1967, and may have reached around 4 % in real terms, given that business conditions improved noticeably as the year went on. After
a 2-year stagnation industrial production has been picking up steadily since the beginning of 1968. Exports continued to expand fairly rapidly, mainly thanks to a lively increase in demand from Germany.
Elsewhere, on the other hand, economic developments were in 1968 affected by govern-ment measures taken to combat inflationary tendencies. In Denmark, for example, regula-tion of demand took a definitely more restrictive tum, so as to contain the sharp rise in costs and prices and to achieve a tangible improve-ment in the trade balance after the devaluation of November 1967. The average growth rate of real gross national product for the year will probably have been at most 2.5 %, after 3 % in 1967. In Norway, economic activity similarly suffered from the weakening of private con-sumption and from less favourable investment trends, especially in shipbuilding.
In Spain, domestic demand had flattened out almost completely after the devaluation and the accompanying restrictive measures, but recovery set in again in the course of 1968. Exports rose very quickly, and during the first 8 months of 1968 their value, in terms of US dollars, exceeded by 17.5 % the corresponding figure for 1967. Together with a marked drop in imports, this is likely to have improved the trade balance considerably. In Canada, the restrictiveness of budget policy and credit policy had virtually no effect on prices and costs until the middle of the year; subsequently economic activity seems to have slackened somewhat, mainly as a result of a slower increase in demand from the United States. In Japan, the restrictive measures introduced in 1967 put a damper on economic expansion early in the year, but all in all the rate of economic grorwth was again very high. Gross national product at constant prices will probably have risen by more than 10 %, after an increase of approxi-mately 13 % from 1966 to 1967. In the balance of payments, the current account again improved considerably, even though the rise in exports to the United States may have slowed down again after having been more rapid until the end of the summer.
on economic activity in the developing countries. Even though the volume of exports from these latter countries expanded considerably, especially up to the middle of the year-the average over the year was probably about 7 % higher than in 1967-the increase in earnings did not keep up with this development. Raw material prices generally were lower than in 1967. As a result, the developing countries' imports, which in the first half of the year had been held back lr.rgely by the loss of purchasing power suffered by many of these countries in connection with the devaluation of their own currencies or of sterling, expanded very hesitantly until the end of the year. In terms of dollar values, purchases abroad by these countries probably increased in 1968 by at most 2 %.
2. Demand
Total demand in the Community expanded distinctly faster in 1968. This development was favoured by strongly rising external demand and by stockbuilding. In addition, investment activity gained in strength and as the year went on private consumption picked up appreciably.
In response to the world economic trends described above, the Community's exports went through two phases in 1968. Until early summer, exports from member countries were &timulated by the revival of economic activity and especially by the appreciable expansion of demand in several major industrial countries. The main beneficiaries were exports to the United States and the United Kingdom. In the first case, there were important special factors such as the strike in the copper industry, expectations of a steel strike and fears of protectionist measures. Exports to the United Kingdom benefited in the early months of the year from the very high level of consumer demand, when the British were expecting restrictive measures at home. As a result, the dollar value of Community exports to the United States was during the first six months of 1968 35% higher, and to the United King-dom 11 % higher than during the corresponding period of the previous year. The overall expan-sion of visible exports from the Community to non-member countries from the second half of 1967 to the first half of 1968 was 8.5 %.
With the disappearance of the special factors, however, export growth slowed down somewhat during the second half of the year. The foreign trade statistics suggest none the less that for the full year visible exports to non-member countries increased at a slightly higher rate than in the preceding year; the increase in value was probably more than 8.5% compared with 7.5% in 1967.
Thanks to the exceptionally good results of the first six months, the total value of annual exports to the United States was some 29 %
higher than in 196 7, when they had risen by only 8 %; exports to the United Kingdom rose by about 13 % in both years. Community sales to continental EFTA countries expanded only slightly more briskly than in 196 7, mainly because of the measures taken by some of them to dampen demand. Similar factors worked against Community exports to Spain and Japan, so that in both cases the annual rate of increase was distinctly lower than the year before. As in 1967, total exports to developing countries went up only ~ little, except for a steeper rise of sales to the associated overseas countries and territories. In exports to the countries of Eastern Europe, finally, the strong expansion of 1967 showed a distinct tendency to slacken. Internal demand in the Community was much more vigorous, and its expansion gathered momentum as the year went on. In annual terms, gross 'fixed asset formation was much the most dynamic element. Near-stagnation in 1967 was followed in 1968 by an increase of about 8.5 % at current prices, and of about 6 % in real terms.
Visible exports to non-member countries
(Values and% changes on preceding year)
1967 1968
Million Full 1st 2nd 3rd Full
u.a. 1 year quar- quar- quar- year 5
ter ter ter
All non-member countries 31 627 + 7.5 + 12 + 2 + 18.5 + 8.5
ofwhich:
Industrial countries 2 20 473
+ 7 + 13 + 3.5 + 16.5 + 8.5
including :
United States 4 423 + 8 + 41.5 + 28.5 + 40 + 29
I
EFTA 10 425 + 4.5 + 8
-
0.5 + 11.5 + 5.5United Kingdom 2 847 + 12 + 20.5 + 1.5 + 3 +13
Developing countries 3 8296 + 4.5 + 10.5 + 4 + 22
+ 7.5
including:
Associated overseas countries and territories 1 789 + 5 + 14.5 - 3.5 + 28.5 + 14
Other countries 4 2 858 + 22.5 +11 -13 + 20 + 10
Source : Statistical Office of the European Communities.
1 1 u.a. = 1 unit of account = 0.888671 g of fine gold = US $1 at the official exchange rate. 1 Class 1 of the Standard Country Classification for Foreign Trade Statistics of the EEC.
3 Class 2 of the Standard Country Classification for Foreign Trade Statistics of the EEC.
' Class 3 of the Standard Country Classification for Foreign Trade Statistics of the EEC, and other destinations.
5 Commission estimates.
act1v1ty and the higher degree of capacity utilization also had a stimulating effect on investment. In addition, France and Italy last summer introduced, or at least announced, measures to promote business investment; this may have led, towards the end of the year, to some improvement in investment activity-though doubtless very limited at first, both geographically and in the range of industries affected.
The metal processing and base materials in-dustries, except for mining, are thought to have
the manufacturing industries have also been endeavouring since last spring to step up modernization of their plant.
After a pronounced slowdown in 1967, invest-ment in building and construction again advanced quite vigorously. Enterprises spent considerably more on building new industrial premises; investment in industrial construction went up particularly fast in Germany and, at least during the first six months of the year, also in Italy. In the latter case, this is all the more remarkable as Italian firms were holding back expenditure for plant and machinery. The overall annual figures for residential building, too, make much better reading than they did in 1967, partly because of the growing impact of the measures which several member countries had introduced in 196 7 and 1968 to promote subsidized housing.
The most vigorous increase was registered by residential construction in Italy, though partly thanks to certain chance factors. In Germany, recovery seems to have gathered more and more speed during the second half of the year, and the number of new residential building projects started probably went up in France as well. In the latter case the development no doubt owed something to the mid-year boost of purchasing power, which must have led households to buy more dwellings, with a resulting improvement on the real estate market during the second half of the year. Expenditure on public works, which account for the great bulk of public investment expenditure, was very considerably up on 196 7, though in most countries some deceleration was unmistakably in evidence during the second half of the year.
Investment in stocks, which throughout the major part of 1967 had exerted a retarding influence, did much to raise total demand in 1968, especially early in the year. In Germany, especially, the tendency to run down stocks was reversed late in 1967, with considerable benefit to demand. In the Benelux countries, too, investment in stocks should prove to have been considerably higher, as firms not only rebuilt stocks previously depleted, but adjusted them to the higher current level of production. In Italy, where stockbuilding had in 1967 advanced rapidly, the pace was calmer, while in France stocks were run down quite considerably in
connection with the losses of ouput in May and June.
Expenditure on consumption made a good recovery in the second half of 1968, after a pronounced slowdown of expansion in 196 7 and a moderate pace in the first six months of the following year.
In most member countries, public current expenditure on goods and services increased, in value terms, a good deal less than from 1966 to 1967. The main reason was that, except for France, pay in the public sector generally rose less, but in most member countries, too, public purchases of goods and services did not expand much.
In private consumers' expenditure there was a distinct tendency for the rate of expansion to gather speed in the course of the year, with the result that the annual average increase, at current prices, worked out at 7.5 % compared with 6% in 1967. In real terms, the cor-responding figures are 4.5 % for 1968 and 3.2 % in 196 7, giving real increases of con-sumption per head of population of 3.5 % in 1968, 2.5% in 1967.
It will be seen from the table below that the real expansion of private consumers' expendi-ture, which had been strikingly uneven as between different member countries in 1967, became increasingly more uniform in 1968. In all the countries except France consumer prices remained relatively stable. Another noteworthy feature is that private consumers' expenditure in Germany, which had barely risen at all during the preceding year, went up more markedly once again in 1968.
Private Consumers' Expenditure
(%change on preceding year)
Value Volume
1967 1 1968 2 1967 1 1968 2
Germany 2.4 6 0.6 4
France 10.5 5.5
Italy 9.3 6.5 6.1 4.5
Netherlands 8.4 7.5 5.1 4.5
Belgium 5.4 7 2.8 4
Luxembourg 2.2 8 0.3 5.5
Community 6.0 7.5 3.2 4.5
1 General Statistical Bulletin of the European Communities, No. 7/8, 1968, Statistical Office of the European Communities.
2 Commission estimates. 3 STATEC, Luxembourg.
expanded comparatively strongly, with the highest rates of increase reported by Germany. Another circumstance that helped to push up disposable incomes was that income tax was being paid, in part, on the two preceding years' incomes, which had risen relatively slowly. In Germany, however, this factor was more than offset by a surcharge levied since 1 January 1968, as well as by higher social security charges.
3. Production
In response to the vigorous expansion of de-mand, internal supply in the Community grew considerably more in 1968 than in 1967, and did so all the more briskly as virtually no bot-tlenecks occurred, either on the labour or the capital markets or in respect of technical pro-duction capacity. In general, therefore, the elasticity of production proved very high. After the excellent results of the preceding year, agricultural production, it is true, rose com-paratively little. Taking the Community as a whole, harvests were only marginally better
than in 1967-when, however, they had beaten all previous records. The Community's total grain harvest exceeded the previous year's by about 1 %. In the case of root crops the incre-ment was larger in quantitative terms, but they were of markedly poorer quality than in normal years. Output of fruit and vegetables, as well as of livestock products, especially milk and butter, was very appreciably higher than in 1967.
To judge by the production index of the Sta-tistical Office of the European Communities, industrial production, excluding construction, food, beverages and tobacco, rose by about
In annual average terms, industrial production expanded most in Germany and in the Nether-lands. In the first country expansion owed much to stockbuilding, to the faster pace of fixed investment by firms and, later, also of consumption; in the Netherlands a major con-tributing factor was that new plant was brought into commission in the natural gas and chemical industries. The main influence on industrial production in Belgium and Luxembourg came
from expanding foreign demand and the strength of the steel market. In France, the social distur-bances in May and June left their mark on the year's results, even though much of the shortfall in output caused by the strike was made good during the second half of the year. In Italy, the rising trend was comparatively weak throughout the year, the expansion of domestic demand having been no more than moderate.
Industrial production in the Community1
(% change on preceding year)
1966 1967 1968 2
Germany
+
1.4-
2+
9.5France
+
7.1+
2.2+
3.5Italy
+
12.5+
8.6+
6Netherlands
+
7.1+
4.4+
9.5Belgium
+
1.8+
0.2+
6Luxembourg - 4.3
+
0.3+
4Community
+
5.3+
1.7+
7.51 Industrial production according to the SOEC Index, excluding, that is, construction and food, beverages and
tobacco.
2 Commission estimates.
Some of the largest output increments were reported by a number of basic materials in-dustries, which were in a good position to take advantage of stockbuilding and of the buoyancy of export demand. After a steady decline since 1964, mining output for the first time once more exceeded the preceding year's; only coal output dropped sharply again, which allowed stocks to be reduced. Very substantial progress was made by the steel industry, where output during the first nine months of the year was 9 % up on the same 196 7 figure. The chemical industry, which had hardly been affected by the slowdown at all, registered another sizeable output increment.
In manufacturing, the capital goods industries benefited from the upsurge of demand.
Pro-duction increased appreciably nearly all along the line, even in shipbuilding, where activity had been quite sluggish for some time. In consumer goods, production rose less steeply than in capital goods, because consumer demand picked up only later in the year and the main initial impulses came from dealers building up stocks. None the less, some specific industries reported very high increases over the-ad-mittedly often very low-levels of the preceding year; this applies, for instance, to motor vehicles
( 15 %) and textiles (10 %) .
expansion of public building, but some con-siderable part must have been played also by increased activity in industrial building and, especially in Germany, by a revival of residential construction.
Similarly, value added in the services sector exceeded the 1967 figures, even though, in contrast with the trend in recent years, the growth of tourism lost appreciable momentum. This is no doubt mainly attributable to the fall in the number of American tourists and to can-cellations in France in connection with the May/ June events. Value added in retail trade prob-ably increased very little during the first half of the year, but with the subsequent recovery of private consumers' expenditure there was probably a pronounced improvement later. The contribution to Community gross product made by transport services, banking and insurance, on the other hand, kept rising briskly throughout the year under the impact of the vigorous recovery.
All in all it can be assumed that the real gross Community product rose by more than 5%
from 1967 to 1968, compared with an increase of 2.9% in 1967. In spite of the strikes and the connected production losses in France, the growth rate of 1968 was the highest since 1964. Germany leads the field with a real GNP growth rate of 6.5% (0% in 1967), followed by the Netherlands with 6 % ( 5.6 % ) ; in Italy the figure was 5% (5.9% ), in Belgium 4.5%
(3.5% ), in France, notwithstanding the pro-duction stoppages in May and June, it was still 3.5-4% (about 5% ), and in Luxembourg
4.5 % ( 2 %) . Since the Rome Treaties came into force, the gross Community product at constant prices has thus risen by altogether 69 %, compared with 58 % in the United States and 38 % in the United Kingdom.
The faster pace of growth in internal production was associated with useful gains in productivity (gross value added at constant prices per person employed).
The total number of persons in paid employ-ment was probably barely higher than in 1967 in annual average terms. However, as the upswing gained ground in the course of the year, the situation on the labour market defi-nitely improved: for the first time since 1965 employment expanded (apart from variations)
during the year in the Community as a whole. Unemployment tended to fall everywhere in the second half of the year, in spite of a relatively large number of school-leavers, and in most :inember countries the curve of job vacancies was upwards. Even in France, where unemploy-ment rose abruptly after the May/June events, the most recent figures suggest that unemploy-ment is again declining, and at the same time the economy's demand for labour is beginning to rise. But in annual average terms, the num-ber of unemployed in France was probably still much the same as in 1967. Last September, the seasonally adjusted unemployment rate was 0.8 % in Germany, 1.8 % in the Netherlands, 2.5% in Belgium, 2.5 % in France and 3.5 %
in Italy.1
The number of self-employed persons probably declined more in 1968 than in 1967, since there was an increased outflow of them from sectors with a relatively high proportion of marginal firms, a tendency which was reinforced by im-proved job opportunities in industry and in certain tertiary activities.
The total number of persons gainfully employed in the Community may well have declined slightly, as indeed it had already been doing in
previous years. To some extent this tendency is explained by the higher school-leaving age and earlier retirement; but the decline was stemmed by the relatively large numbers of young people taking up their first jobs.
4. Balance of the markets
The Community's imports from non-member countries expanded very vigorously in 1968. In annual average terms, their value was probably about 8.5% higher than in 1967, and, with import prices tending to fall, the volume of im-ports should have increased even more ( 9.5 % ) . During the early months of the year the key to the increase in Community imports was rising demand for raw materials and semi-manufac-tures. Other factors worked against the expan-sion of imports during the first quarter, such as the persistent decline of agricultural purchases abroad after the preceding year's good harvests, the normalization of crude oil imports after an
exceptional spurt o£ restocking late in 196 7, and Italy's general weak import demand. As the upswing gained momentum in the course of the year, more manufactures were imported, at first mosdy capital goods but later consumer goods as well. Since the middle of the year agricultural imports, too, have been rising again.
The main beneficiaries of the Community's vigorously expanding import demand, especially for manufactures, were the United States and the United Kingdom, whose sales to the Com-munity had been declining in 1967. But im-ports from developing countries also did a good
deal better than in 1967. By contrast, the Com-munity bought litde more than before in the European countries of the Eastern bloc.
The faster growth of the Community's internal demand helped intra-Community trade, in its turn, to move on from the preceding year's pronounced slowdown to renewed vigorous ex-pansion. Import statistics suggest that in 1968 the value of trade between member countries exceeded the previous year's figure by about 14 %, which means a more than fourfold increase in intra-Community trade since the Rome Treaties entered into force in 1958.
Visible imports from non-member countries
(Imports 1967 and
%
year-to-year changes)1967 1968
Million Full 1st
I
2nd
u.a. 1 year quar-
quar-I
terI
ter
All non-member countries 30 767 + 0 + 6.5 + 5
ofwhich:
Industrial countries 2 16 954
~ 2 ..J_ I 6 + 3
including :
United States 5 858 - 2.5 + 7 - 1.5
EFTA 7 093 - 2 + 6.5 + 4.5
United Kingdom 2 701 - 3 + 5.5 + 2.5
Developing countries 3 11 521
+ 1.5 + 7 + 8.5
including:
Associated overseas countries and territories 2 275
-
0.5 + 12 ·+ 4Central and South America 2 743 + 0.5 - 3.5 - 8
Other countries 4 2 292
+ 8.5 + 11.5 + 3.5
Source: Statistical Office of the European Communities.
1 1 u.a. = 1 unit of account = 0.888671 g of fine gold = US $1 at the official exchange rate.
2 Class 1 of the Standard Country Classification for Foreign Trade Statistics of the EEC. 3 Class 2 of the Standard Country Classification for Foreign Trade Statistics of the EEC.
3rd quar-ter
+ 14
+ 17.5
+ 20.5
+17
+ 17
+11
+11
-10
+ 0
Full year 5
+ 8.5
+8
+ 10
+ 9
+ 10.5
+ 10.5
+ 9.5
- 5
+ 4.5
It was the greatly increased import demand of Germany and France that did most to boost intra-Community trade in 1967. With the upswing gaining ground in Germany and especially with the recovery of private con-sumers' expenditure, German imports from other member countries expanded strongly in 1968-probably by more than 17 % in value terms. France, which had already stepped up its purchases from other member countries early in the year, bought even more after the May/ June events, with the result that total 1968 imports from other EEC countries exceeded their previous year's value by almost 20 %.
This is all the more remarkable because the Fiench Government, with the Commission's approval, introduced temporary import quotas in July to contain the expansion of imports of certain "sensitive" goods like motor cars, steel, electrical household appliances and certain tex-tile products. The Belgo-Luxembourg Economic Union and the Netherlands, whose imports from ether member countries had hardly risen at all in 196 7, increased their purchases under the impact of steadily growing economic expansion at home. In Italy, by contrast, domestic demand went through a comparatively quiet phase during the first half of 1968, with the result that imports marked time for a while in the early months of the year; subsequently they picked up again, but rather slowly until the autumn. The overall annual increase, in value terms, probably did not exceed 5 %.
Italian exports, on the other hand, captured the main share of the increment in import demand in Germany and France. Italian industry was all the better equipped to deal with this situa-tion as slower domestic growth had made available an ample margin of spare capacity. But the dynamics of intra-Community trade were such as to enable all the other member countries to step up their exports to EEC partners.
In looking at the 1968 trade balances of each separate member country with the others, the most striking feature is the deterioration of the French position. Even though French exports to the rest of the Community did well enough, France ran up a deficit of something like 1 000 million u.a. on trade with the five, after 672 million u.a. in 1967. Germany's trade surplus, though reduced by the vigorous import expansion, was still high. In Italy, the moderate
increase in imports and the powerful upsurge of exports entailed a distinct improvment in the trade balance, which showed a surplus once again in 1968 following a deficit of 17 million u.a. in 1967. The Belgo-Luxembourg Economic Union had high surpluses in 196 7, and higher ones in 1968. No significant change occurred in the intra-Community trade position of the Netherlands, which again showed a heavy deficit.
Prices in the Community spurted briefly early in 1968, and thereafter remained remarkably stable on the whole. The one exception was France, where they rose distincly faster than in recent years. Retail prices were pushed up considerably early in the year by the extension of the tax on value added to retail trade and the services sector, and climbed even more steeply during the second half of 1968 as a result of the massive wage rises following the strikes in May and June. In Germany, the introduction of the tax on value added entailed considerably higher prices at the beginning of the year. At the same time, Dutch retail prices were rising under the impact of an increase in turnover tax rates. Italy enjoyed an absolutely stable price level throughout the whole of 1968-indeed wholesale prices actually declined a little in this country. In nearly all countries the effects of the 196 7 price increases were still reflected in a rise of the price index of private consumption, adjusted by the GNP deflator.
Prices remained largely stable in most member countries in the course of the year, mainly because the elasticity of supply was relatively high. In addition, wage costs in industry exercised little upward pressure on prices. Except for France, wage costs per unit of output were very nearly stable, thanks in part to the reasonable attitude of both partners in wage negotiations and in part to the substantial pro-ductivity gains in most member countries due to the rapid pace of the upswing.
World prices for some staple raw materials were still weak, and this also helped to keep prices stable.
Rise in Private Consumption Prices1
(o/o
changes on preceding year)1966
Germany
France
Italy
Netherlands
Belgium
Luxembourg
Community
1 As defined for the national accounts.
2 Commission estimates.
livestock products, pigmeat prices were still falling in the early months of the year, but hardened later. Beef prices, which in 1966 and 196 7 had declined in most member countries or had at least shown no change, rose everywhere except in Italy during the course of 1968. With wages keeping to a steady course, prices in the services sector rose less than during the preceding years. At any rate, public service charges were raised neither as often nor as much as in 1967. Rents, however, went up again, and possibly more than in 1967.
The Community's visible trade balance with non-member countries probably closed with a surplus ( cif-fob) of the same order of magni-tude as in 1967, when it had reached the high level of 860 million u.a.
The surplus on current account, calculated on a cash basis, probably declined, and the capital account is expected to show a considerably higher deficit than in 1967. The net outflow of both short-term and long-term capital increased very much, in connection, mainly, with the widening of the Eurodollar and the Euro-capital markets, and with speculative Euro-capital exports from France triggered off by the social disturbances.
3.9
2.8
3.0
5.8
4.3
3.5
3.5
1967 1968 2
I
1.8 2
3.0 5
3.0 2
3.1 3
2.5 3
2 2.5
2.6 3
To judge from the incomplete figures available when this report was prepared, the Community's overall balance of payments must have closed in 1968 with a sizeable deficit. The member countries' official net gold and foreign exchange reserves certainly declined by about 2 800 mil-lion u.a. during the first ten months of the year, compared with an increase of about 1 100 mil-lion u.a. during the corresponding period of
1967. At the same time, however, the net fcreign exchange position of commercial banks improved very appreciably.
It follows that transactions with non-member countries had an inhibiting effect on liquidity in the Community taken as a whole. This applies especially to France, but also to the Netherlands and Belgium; in Italy and Germany the effect was expansionary-slight in the first case, but fairly strong in the second.
In all member countries, the cash transactions of the public authorities had liquidity-raising effects. In France, especially, the budget deficit of FF 2 500 million provided for in the original estimates was subsequently raised to FF 10 500
and in the Benelux countries the budget deficit was no doubt also larger than in 1967, and in the Netherlands it certainly was the main factor
in the expansion of domestic liquidity. Only in Germany was there a tendency for the cash deficits of the Federal Government and the Lander to decline after their strong rise in the preceding year. Not only did tax revenue increase more than in 196 7, but federal expend-iture rose relatively little, and was indeed actually falling until July.
The volume of bank lending to business and private customers expanded m all member
countries, though in some of them more slowly than in 1967. Although profits were rising in Germany, firms needed more money for stocks and for their rapidly rising fixed investment, with the result that bank credits to business expanded sharply, after they had been virtually stationary in 1967. As the year went on, the banks were also lending more to private customers. The very considerable expansion of bank lending in France was in part attributable to the liquidity difficulties with which firms, and especially those of small and medium size, had to contend during and after the strikes in May and June, because of the
Demand for and supply of goods and services
19661 1967 1 1968 2 4
At
current % changes on preceding year prices
in '000 million u.a.5
Volume Value Volume Value
Gross fixed asset formation 73.4
+
0.7+
1.6+
6+
8.5Public current expenditure on goods and
services 47.1
+
4.2+
7.4+
3+
8Private consumers' expenditure 197.0
+
3.2+
6.0+
4.5+
7.5Gross Community product 323.6
+
2.9+
5.3+
5+
8.5Balance exports &less imports 6 (at current
prices, in '000 million units of account)
+
3.5+
5.7+
5.91 General Statistical Bulletin, 1968, No. 7/8, Statistical Office of the European Communities. 1 Commission estimates.
a Commission forecasts.
1969 34
Volume
+
7.5+
3.5+
5.5+
5.5+
4.5' Based on Community totals of the aggregates of the individual member countries at official exchange rates.
5 1 u.a. = 1 unit of account = 0.888671 g of fine gold = US $1 at the official exchange rate.
• Goods, services and factor income.
Nott:
(a) The difference between the figures for demand and those for supply is accounted for by movements in stocks. (b) The estimates and forecasts are approximations based on certain hypotheses, generally mentioned in the Quarterly Surveys. They have been discussed with the experts of the member countries but are established and published on the sole responsibility of the Commission.
production stoppages and the subsequent for-midable wage increases; to help them, the Government introduced special credit facilities. Although private investment expanded vigor-ously in the Netherlands, bank lending to the private sector increased hardly more in absolute terms than in 1967, when admittedly the credit expansion had been exceptionally strong. On the other hand, companies borrowed more on the capital market in 1968. In Belgium, too, bank credits did not expand any more than in J967. In Italy, finally, domestic demand was so calm that during the first seven months of the year the volume of credit expanded to only about two-thirds the extent of the increase recorded during the corresponding period of 1967.
The money markets were fairly liquid in most member countries during the greater part of the year. This affected the Eurodollar market, where interest rates eased. In Belgium, the central bank reduced its discount rate from 4 to 3.75% in March. In France, large speculative capital outflows led the Government to rein-troduce temporary exchange control at the end of May, and for balance-of-payments reasons the Banque de France twice raised the Bank rate-in July from 3.5 to 5
%,
and in November to 6 %. At the same time it tightened up credit terms.With prevalently easy conditions on bond markets in the Community, interests and yields were tending downward in some countries with the deliberate encouragement of those in charge of credit policy. In Germany, yields declined fairly sharply from April onwards, in spite of a large volume of new issues floated mainly by public authorities and foreign borrowers. In Belgium and Italy, yields were virtually stable, even though in the latter country new bond issues assumed an unprecedented scale. In France, too, yields were fairly stable, apart &om a temporary steep climb in May; it should be added, however, that during the second half of the year the public authorities displayed great restraint in their recourse to the bond market. The only country where interest rates rose-and here they showed only a moderate increase-was the Netherlands, no doubt largely because of heavy debenture issues by companies.
COMMUNITY TRADE
Monthly averagesIntra-Community trade (1)
In million u. a.
*
2 400
I I I I
2300
..,... I
r
~"
.L'\I
2200
2100
2000
I
""'
\
~I
I 900I
v
I 800
1 700
1 600 I I I
300 Trade with A.O.S. (2)
I I I I
250
200
--....
~~
/ '
1'-~"'
150
/
-
...
~
...
100
50
Trade with developing
1 100 countries (3)
I I I I
I 000 /'
--900
~
~
~I
800
700
/ '
r
~~
/
~~
600
500
400 I I
111
I
I
I
I
v
/
111
950 Trade with EFT A countries
900
I I
/'
b-..,
850
I'
~/
tvt
L
v750
700
650
600
I'
"
_L
I
-
\
1\/
550
y
500
Trade with Eastern Europe, 300 USSR and Continental China
I I I
250
I ...
,.
_l
I
200
L'
" ,/<..
~/
/
-
~v
"'-150
100
50
0 _l
Ill
I
L .
_j
I
t/
-111
1966 1967 1968 1966 1967 1968
-~- Exports Imports
(1) According to import returns.
(2) A.O.S. : Associated Overseas States (overseas departments, countries and territories).
(3) According to GATT classification~ non-industrialized regions other than A.O.S.
* 1 unit of account = 0.888671 gramme of fine gold.
B. Forecasts for 1969
When the time came round for working out forecasts for 1969, the upward trend of world economic conditions, which had been fairly steep up to the middle of 1968, had already lost a little momentum. This tendency is likely to continue into 1969, though it is hard to tell at present what proportions it will assume, how long it will last and whether it will give way to a recovery some time in the course of the coming year.
No doubt the United Kingdom and the United States will go on trying to achieve equilibrium in their balance of payments, and their efforts in this direction could well slow down the growth of world trade in 1969. But the success of these efforts is still too uncertain to allow at this stage of any conclusions regrading the possible reorientation of these countries' eca. nomic policies in the early months of 1969, and it is on this that world economic conditions in the second half of the year will largely depend. On top of that there are the uncertainties, especially important for the United States, about developments in Vietnam and about the new Administration's economic policy.
In these circumstances, the forecasts concerning world economic trends in 1969, and especially during the second half of the year, had to be based on a set of working hypotheses. It was assumed that the restrictive measures introduced so far by the United States and the United Kingdom would be sufficient to contain infla-tionary pressures in the United States and to reduce the external disequilibria of both countries. For the United States it was assumed, in addition, that any cessation of hostilities in
Vietnam would not as yet have an appreciable effect on public expenditure in 1969. Finally,
it was assumed that the predicted vigorous expansion of internal demand in the Community will prove a strong expansionary factor in world trade.
In an attempt to assess likely economic develop-ments in the United States, it would seem appropriate to make a distinction between the first and the second half of the year, because the budgetary restrictions introduced apply so far only to the current fiscal year ending in
mid-1969. Domestic demand has hardly responded as yet to these restrictive measures, but they should begin to bite during the first half of 1969, for a number of reasons. For one thing, the additional tax payments to which taxpayers are liable as a result of the retroactive application of the increase in direct taxes are not due until the spring of 1969. As of 1 January 1969, furthermore, social insurance contributions are raised by $3 000 million without any corresponding increase in benefits; half the increment will come from households. Finally, the greater part of the total reduction of the budget deficit from $25 000 for the fiscal year 1967/68 to about $5 000 million for 1968/69 is to take effect during the first two quarters of 1969. It may be, however, that the expenditure cuts of $6 000 million will turn out to be rather smaller than originally intended, because the items which escaped cuts at the time may prove to occasion higher costs than was estimated. All in all, it must be expected that the restrictive measures will considerably slow down the expansion of the major compo-nents of domestic demand during the first half of 1969, and possibly even cause it to stagnate. Under the impact of a profit squeeze and an increase in spare capacity corporate investment may lose momentum, but above all there will no doubt be a marked slowdown in private con-sumers' expenditure. The effect may be rein-forced should the savings ratio of households, which has recently been falling, stop doing so or indeed
if
the propensity to save of households should again increase. It is unlikely that the inhibiting impact of trends in corporate invest-ment and private consumers' expenditure will be made good by the expected improvement in residential construction, especially since, in view of the slight effects of the budgetary restrictions so far, no significant easing of credit policy can be expected for some months.There should be another improvement in .the US visible trade balance, though with domestic prices still rising the competitive position of American industry must be suffering. In the event that prices continue to rise to any marked degree early in 1969, the US authorities may be led to maintain their restrictive measures beyond the middle of the year.
Allowing for the level of production already reached at the end of 1968 and for the fact that the present restrictive measures entail no danger of the demand expansion being cut back too sharply, the gross national product at constant prices may be expected to rise in 1969 by 2-3 %. The growth rate is likely to be the closer to the upper figure the more quickly prices stop rising and the sooner, therefore, a relaxation of the restrictive measures can be contemplated. The rate of import expansion is likely to fall far short of the soaring pace of 1968.
If the American economy takes the course described above, the effects on the United King-dom in 1969 are likely to be far-reaching. Given that British export growth in 1968 owed much to the steep rise of sales to the United States, even a temporary weakening of US demand would significantly affect the rate of increase of British exports. To make matters worse, demand from other EFTA partners and from developing countries is not expected to rise more than a little in 1969. Provided, however, that export prices remain reasonably stable for the next few months, there is, nevertheless, a presumption that the beneficial effects of the sterling devaluation will be felt more and more, so that the United Kingdom may look forward to a larger share in world trade next year.
But even allowing for devaluation, British exports are unlikely to expand so fast as to make room for any major reflation of domestic demand in 1969,
if
the Government is to achieve its aims of balancing external payments in accordance with the time schedule for repay-ment of the United Kingdom's foreign debts; the country's propensity to import is too high for that. Given that recent surveys suggest that firms are planning to invest a good deal more next year, the balance of payments can be brought into equilibrium only if the rise of private consumers' expenditure is kept within narrow limits. All in all, the real growth rate of GNP must be estimated at around 2.5 %,with imports of goods and services rising only very slightly for the year as a whole.
The slowdown to be expected during the first half of next year in the United States and, to a lesser extent, also in the United Kingdom is
bound to weaken import demand in these two countries and hence will no doubt curtail eco-nomic growth in the other industrial countries outside the Community. The recovery which set in during 1968 in some of them may well
be slowed down. This applies particularly to Sweden, where the expansion was definitely export-led. Elsewhere, notably in Denmark and Norway, the climate will certainly improve less fast in 1969 than was originally expected in the light of the progressive relaxation of anti-inflationary measures. Japan and Spain may well find that the improvement in their trade balances, which is a priority aim of their Governements and was very distinct in 1968, is jeopardized by demand developments in the United States, their chief export market. The same factor may cause some deceleration of economic growth in Canada. Except for Austria and Switzerland, it certainly does not look as though the above-mentioned adverse effects could be fully compensated by such impulses as can be expected to derive from continuing economic expansion in the Com-munity.
For developing countries, the outlook is not particularly favourable, so that no major contri-bution to activity on world markets can be expected from this quarter. Since import demand in a number of industrial countries is likely to weaken, developing countries may find their markets expanding only very moderately in 1969. They must also expect continuing pressure on their foreign exchange reserves in 1969, because of relatively low world prices for raw materials and because international develop-ment aid is unlikely to rise more than a little. A relevant factor is that the foreign exchange reserves of the developing countries have been gradually concentrating in only a small number of them.