Rochester Institute of Technology
RIT Scholar Works
Theses Thesis/Dissertation Collections
5-6-2015
Effective and Efficient Communication and
Collaboration in Participatory Environments
Shiraz Qayyum
Follow this and additional works at:http://scholarworks.rit.edu/theses
This Dissertation is brought to you for free and open access by the Thesis/Dissertation Collections at RIT Scholar Works. It has been accepted for inclusion in Theses by an authorized administrator of RIT Scholar Works. For more information, please contactritscholarworks@rit.edu. Recommended Citation
EFFECTIVE AND EFFICIENT COMMUNICATION AND COLLABORATION IN
PARTICIPATORY ENVIRONMENTS
by
SHIRAZ QAYYUM
A dissertation submitted in partial fulfillment of the
requirements for the degree of
Doctor of Philosophy
in Computing and Information Sciences
B. Thomas Golisano College of Computing and
Information Sciences
Rochester Institute of Technology
Rochester, New York
EFFECTIVE AND EFFICIENT COMMUNICATION AND COLLABORATION IN
PARTICIPATORY ENVIRONMENTS
by
SHIRAZ QAYYUM
Committee Approval:
We, the undersigned committee members, certify that we have advised and/or supervised
the candidate on the work described in this dissertation. We further certify that we have
re-viewed the dissertation manuscript and approve it in partial fulfillment of the requirements
of the degree of Doctor of Philosophy in Computing and Information Sciences.
Dr. Mohan Kumar Date
Ph.D. Supervising Professor
Dr. Minseok Kwon Date
Ph.D. Committee Member
Dr. Sumita Mishra Date
Ph.D. Committee Member
Dr. Tae Oh Date
Ph.D. Committee Member
Dr. Mihail Barbosu Date
Dissertation Defense Chair
Certified by:
Dr. Pengcheng Shi Date
Copyright cby SHIRAZ QAYYUM 2015
ACKNOWLEDGEMENTS
First and foremost I would like to thank my supervising professor Dr. Mohan Kumar
for constantly motivating and encouraging me. I appreciate all his contributions of time,
ideas, and funding to make my Ph.D. experience productive and stimulating.
I wish to thank my committee members Dr. Minseok Kwon, Dr. Sumita Mishra and
Dr. Tae Oh for their interest in my research and for taking time to serve in my dissertation
committee.
I would also like to thank Dr. Matthew Wright, Dr. Donggang Liu, Dr. Yonghe
Liu and David Levine for being on my dissertation committee when I was affiliated with
The University of Texas at Arlington. I am especially grateful to Dr. Umair Sadiq for his
interest in my research and for the helpful discussions and invaluable comments. I also
wish to thank Dr. Sajal Das, Dr. Peizhao Hu, Dr. Daisuke, Mehrab and Swathy for taking
the time to critically evaluate this manuscript.
Lastly, I would like to thank my parents and sisters for all their love, encouragement
and support. And most of all, the faithful support from my loving, encouraging and patient
wife Qurrat Ul Ain during the final stages of this Ph.D. is appreciated. Thank you.
ABSTRACT
EFFECTIVE AND EFFICIENT COMMUNICATION AND COLLABORATION IN
PARTICIPATORY ENVIRONMENTS
SHIRAZ QAYYUM, Ph.D.
Rochester Institute of Technology, 2015
Supervising Professor: Dr. Mohan Kumar
Participatory environments pose significant challenges to deploying real
applica-tions. This dissertation investigates exploitation of opportunistic contacts to enable
ef-fective and efficient data transfers in challenged participatory environments.
There are three main contributions in this dissertation:
1. A novel scheme for predicting contact volume during an opportunistic contacts (PCV);
2. A method for computing paths with combined optimal stability and capacity (COSC)
in opportunistic networks; and
3. An algorithm for mobility and orientation estimation in mobile environments (MOEME).
The proposed novel scheme called PCV predicts contact volume in soft real-time.
The scheme employs initial position and velocity vectors of nodes along with the data
rate profile of the environment. PCV enables efficient and reliable data transfers between
opportunistically meeting nodes.
The scheme that exploits capacity and path stability of opportunistic networks is
based on PCV for estimating individual link costs on a path. The total path cost is merged
partic-ipatory environment. A polynomial time dynamic programming algorithm is proposed to
compute paths of optimum cost.
We propose another novel scheme for Real-time Mobility and Orientation Estimation
for Mobile Environments (MOEME), as prediction of user movement paves way for
effi-cient data transfers, resource allocation and event scheduling in participatory environments.
MOEME employs the concept of temporal distances and uses logistic regression to make
real time estimations about user movement. MOEME relies only on opportunistic message
exchange and is fully distributed, scalable, and requires neither a central infrastructure nor
Global Positioning System.
Indeed, accurate prediction of contact volume, path capacity and stability and user
movement can improve performance of deployments. However, existing schemes for such
estimations make use of preconceived patterns or contact time distributions that may not
be applicable in uncertain environments. Such patterns may not exist, or are difficult to
TABLE OF CONTENTS
ACKNOWLEDGEMENTS . . . iv
ABSTRACT . . . v
LIST OF ILLUSTRATIONS . . . xii
LIST OF TABLES . . . xiv
Chapter Page 1. Introduction . . . 1
1.1 Participatory environments . . . 1
1.2 Research problems . . . 2
1.2.1 Contact volume . . . 2
1.2.2 Capacity and stability of paths . . . 3
1.2.3 Mobility . . . 3
1.3 Contributions . . . 4
1.3.1 Predicting contact volume between opportunistically meeting nodes 4 1.3.2 COSC: Paths with Combined Optimal Stability and Capacity in Opportunistic Networks . . . 5
1.3.3 Real-time mobility estimation in participatory environments . . . . 6
1.4 Outline . . . 7
2. Related Literature . . . 8
2.1 Contact volume . . . 8
2.1.1 Finding patterns . . . 8
2.1.2 Throwboxes and RSSI based techniques . . . 8
2.2 Data flow . . . 11
2.2.1 Data dissemination . . . 11
2.2.2 Informed mobile prefetching . . . 11
2.2.3 Data centric approaches . . . 13
2.2.4 Time varying graphs . . . 13
2.3 Mobility estimation . . . 14
2.3.1 Routing . . . 14
2.3.2 Multi Dimensional Scaling . . . 14
2.3.3 Two phased localization based on Simulated Annealing. . . 14
2.3.4 RSSI based centralized localization . . . 15
2.3.5 Coordinate System Stitching . . . 15
2.3.6 Interferometric Ranging Based Localization . . . 16
2.3.7 Beacon based distributed localization . . . 16
2.3.8 Plausible mobility . . . 17
3. PCV: Predicting Contact Volume for Reliable and Efficient Data Transfers in Opportunistic Contacts . . . 18
3.1 Introduction . . . 18
3.2 System Model . . . 21
3.2.1 Contact Duration . . . 21
3.2.2 Instantaneous Distance . . . 23
3.3 Data Rate Profile . . . 25
3.3.1 Custom Android Application for Learning Data Rates . . . 26
3.3.2 Cubic Splines for Estimating Data Rates. . . 27
3.4 Contact Volume . . . 28
3.5 Performance Evaluation . . . 29
3.5.2 Simulation Results . . . 35
3.6 Discussion. . . 37
3.6.1 Conserving Battery Power . . . 37
3.6.2 Bandwidth Sharing Application . . . 38
3.7 Summary . . . 38
4. COSC: Paths with Combined Optimal Stability and Capacity in Oppor-tunistic Networks . . . 40
4.1 Introduction . . . 40
4.1.1 Graph theoretic model . . . 44
4.1.2 Time varying connected clusters . . . 45
4.1.3 Synthetic Mobility Models . . . 46
4.2 Path Selection . . . 47
4.2.1 Link capacities . . . 48
4.2.2 Stability of paths . . . 49
4.2.3 Finding a path set . . . 50
4.3 System Architecture and Implementation . . . 52
4.3.1 Contact volume estimator and aggregator . . . 53
4.3.2 Path finder . . . 54
4.4 Evaluation . . . 56
4.4.1 Simulation setup . . . 56
4.4.2 Connectivity of time varying clusters . . . 57
4.4.3 Possible data transfer . . . 59
4.4.4 File transfer failure rates . . . 61
4.5 Summary . . . 62
5.1 Introduction . . . 64
5.1.1 Contributions . . . 66
5.2 Related Work . . . 67
5.3 System Description . . . 67
5.3.1 Types of nodes . . . 67
5.3.2 Dictionaries at NOIs . . . 68
5.3.3 Underlying network . . . 69
5.3.4 Temporal distance . . . 69
5.3.5 Timer update . . . 69
5.3.6 Additional timers at the time of contact . . . 70
5.3.7 Time since last contact and threshold parameter matrix . . . 72
5.4 Learning the threshold parameter matrix . . . 72
5.4.1 Logistic regression . . . 72
5.4.2 Feature selection . . . 75
5.5 Real-time estimation of directional mobility . . . 75
5.5.1 Estimation at NOIs . . . 75
5.5.2 Time complexity and scalability . . . 76
5.6 Direction estimation with orientation sensor . . . 77
5.6.1 Local orientation readings on a device . . . 77
5.6.2 Sharing of orientation information . . . 78
5.6.3 Prediction criterion and features . . . 79
5.7 Implementation . . . 81
5.7.1 Wi-Fi Direct module . . . 82
5.7.2 Network module . . . 83
5.7.3 Estimation module . . . 83
5.8.1 Simulation setup . . . 86
5.8.2 Direction estimation . . . 87
5.8.3 Distance estimation. . . 89
5.8.4 Count estimation . . . 90
5.8.5 Orientation estimation . . . 91
5.8.6 Successful downloads in a video sharing application . . . 92
5.9 Summary . . . 95
6. Conclusion . . . 96
6.1 Summary . . . 96
6.2 Broader applications . . . 97
6.3 Future work . . . 98
6.3.1 Contact volumes over multiple devices . . . 98
6.3.2 Path sharing in COSC . . . 99
6.3.3 UAVs & drones . . . 99
6.3.4 Vehicular networks . . . 99
LIST OF ILLUSTRATIONS
Figure Page
3.1 Series of transformations applied for calculating contact duration of two nodes 20
3.2 Effect of rotational transformation by angleθ . . . 23
3.3 DatPro results. . . 25
3.4 Prediction strength for different ranges of actual contact volume . . . 29
3.5 Bandwidth wastage with and without prediction. . . 31
3.6 Effects of chunk sizes and waiting times on bandwidth recovery for Disney World trace . . . 32
3.7 Cumulative distributive function (CDF) of stronger and weaker predictions against nodes’ initial state . . . 33
3.8 Effect of false negatives . . . 37
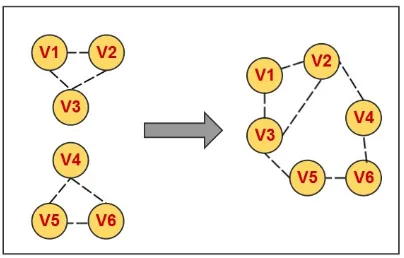
4.1 A TVG representation of an opportunistic network where one connected clusterC1, ...C4comprising{v1, ..., v5}is highlighted, witha= 1andb = 4 anda, b ∈ τ[0,4].. An example of a path set is also depicted, with a single changeover betweent= 1andt= 2. . . 42
4.2 The three scenarios that mark the lifetime of a cluster . . . 46
4.3 System Architecture . . . 53
4.4 Path finder’s flowchart. The tuning parameter is provided by a high level application. The path finder adaptively switches between using maximum utility path set and epidemic routing with anti-packets. . . 54
4.6 Average contact volume on a path set between arbitrarily chosen nodes in
clusters. Longer communication range opens up the opportunity for
trans-ferring more data.. . . 60
4.7 Percentage of file transfer failure rates at communication range of100m. A comparison of COSC against shortest paths computed based on number of hops . . . 61
5.1 A mobile environment . . . 68
5.2 Timer updates . . . 71
5.3 Orientation coordinate system . . . 78
5.4 Data at an arbitrary node and time showing whether the orientation values fall within the same quadrant/division . . . 81
5.5 Architecture of MOEME implementation on an Android framework . . . 83
5.6 Direction and distance estimation . . . 88
5.7 Count prediction . . . 90
5.8 Prediction accuracy of orientation against timer values. The accuracy is plot-ted for the five different real-world mobility traces. . . 92
LIST OF TABLES
Table Page
3.1 Wireless devices used to gather data rate profiles . . . 26
3.2 Distribution of files transferred . . . 32
3.3 Percentage of false negatives at different estimated contact volume ranges
[Contact Volume Ratio (Predicted vs Actual) = PCVR] . . . 32
3.4 Percentage of maximum possible data transmission in real experiments
(com-pared to Bluetooth Specification) . . . 34
4.1 SLAW mobility trace used for simulation . . . 58
4.2 HCMM mobility trace used for simulation . . . 58
5.1 Real-world mobility traces used in this chapter to show orientation
predic-tion accuracy . . . 85
CHAPTER 1
Introduction
This dissertation investigates exploitation of opportunistic contacts to enable
effec-tive and efficient data transfers in challenged participatory environments. In this chapter,
we provide an overview of our research on effective and efficient communication and
col-laboration in participatory environments. We also introduce participatory environments and
provide motivation for the research presented in the rest of the dissertation. Furthermore,
we discuss key research problems and their proposed solutions. The chapter is concluded
with an outline of rest of the dissertation.
1.1 Participatory environments
Participatory environments are formed when a set of users carrying smart devices
come in the vicinity (radio communication range) of each other to execute a common
col-lective task. Such a collection of users may result in the formation of an opportunistic
network. There is no end to end connected path between source and destination nodes
in opportunistic networks. In order to transfer data or messages between interested users,
intermediate nodes may act as ferries by physically carrying information along with them.
Participatory environments and dynamic networks are of considerable interest as they
hold promise in offloading traffic from licensed spectrum to unlicensed spectrum, such as
Wi-Fi or Bluetooth. However, in order to deploy real-world applications in participatory
environment there is a need to study a number of characteristic problems that arise due to
1.2 Research problems
In this section, we discuss the research problems that arise in achieving effective
communication and collaboration between participating devices in a dynamic participatory
environment. As the participants are mobile, often there are no patterns in user movement
that can be exploited to achieve reliable and efficient data transfers. Data corruption and
un-der utilization of the network are common problems that arise while deploying applications
in participatory environments.
1.2.1 Contact volume
In recent years, the number of smartphone users has exceeded one billion, thus
cre-ating the opportunity for developing and deploying useful applications in opportunistic
networks. As an example, consider a group of smartphone users running a bandwidth
shar-ing application to download and possibly stream a video. In such an application, a group
of nearby users simultaneously download different chunks of a video with the help of a
low speed cellular network connection and share it among themselves over a high speed
wireless LAN (possibly at no cost) [1]. The advantages of bandwidth sharing include, but
are not limited to increased download speeds, better video quality, reliability and reduced
delays.
Research problem: In the existing bandwidth sharing schemes [2] [3] [4] [5], it is assumed that the group of users wanting to watch the same video are within proximity of
each other and are not mobile. However, situations where a group of mobile users may
not be within their radio communication range, but can be connected in an opportunistic
network are quite common in such public places as streets, train stations and state fairs.
Therefore, it is of paramount importance to have an accurate prediction of contact volume
nodes. The prediction of contact volume helps applications to determine what files or data
can be reliably transferred to other nodes in the environment.
1.2.2 Capacity and stability of paths
Wireless devices that make up such a network are mobile and resource constrained.
Furthermore, the network needs to be self configurable and be able to route data between
interested users. In order to tap into the full potential of dynamic networks, researchers have
aggressively modeled their structure and properties [6] [7] [8]. Data centric approaches [9]
[10], along with temporal reachability [11], for data transfers have also been proposed in
the literature.
Research problem: To the best of our knowledge, there is no existing literature on modeling of real-world link capacities along a path in opportunistic networks. In some
works link costs are incorrectly assumed to be uniform throughout the network, while in
some others, bandwidth limitations are not considered [12]. The individual radios and
in-terfaces may also be different in a set of heterogeneous devices, thus giving rise to greater
complexity. Therefore, there is a need to model the real-world path capacities in a
partici-patory environment in order to choose the best path for transferring data between interested
nodes. Despite the dynamic nature of such environments, it is important to maintain stable
paths in order to minimize overheads due to routing table updates. Moreover, frequent path
changes lead to poor data quality and disrupt user experience.
1.2.3 Mobility
As participatory environments rely primarily on user mobility as a mechanism for
transporting content and data in general, identifying and modeling user mobility provides
researchers and network designers with key insights for improving performance, efficiency
mes-sage delivery, however, knowledge of user mobility and diffusion has been exploited by
various schemes to considerably cut down energy expended in already resource constrained
devices with a small tradeoff on delivery times [14] [15] [16].
Research problem:Though there are several existing works in the literature that aim at modeling human mobility, Self Similar Action Walk (SLAW) and Community-based
Mobility Model (HCMM) are the two popular synthetic state of the art mobility models
[17] [18]. However, participatory environments are dynamic and there may not be existing
patterns, hence there is a need to predict human mobility in real-time to mitigate the effects
of randomness in user movement.
1.3 Contributions
To address the aforementioned research challenges we make the following novel
contributions towards effective collaboration in participatory environments a reality.
1.3.1 Predicting contact volume between opportunistically meeting nodes
We propose a novel scheme called PCV that effectively predicts the contact volume
and enables usability of an opportunistic contact. PCV makes use of the pre-calculated
data rate profile expressed as a function of distance, as well as the instantaneous velocity
vectors of the mobile nodes. This work makes the following major contributions:
1. Analytical model for estimating contact duration and a scheme for Predicting
Con-tact Volume (PCV) in opportunistic conCon-tacts to enhance file transfer capability. The
scheme has been shown to work in the absence of user mobility patterns and contact
duration distributions.
2. A novel custom Android Application called DatPro: Data Rate Profiling Agent, to
learn Bluetooth data rate profiles for outdoor environments. Source code available
3. PCV algorithm predicts the contact volume for pairs of nodes. The algorithm is
sim-ple, scalable and runs in linear time in terms of the number of opportunistic contacts
a node makes.
1.3.2 COSC: Paths with Combined Optimal Stability and Capacity in Opportunistic
Net-works
In the aforementioned work, we modeled link costs based on the actual amount of
data that can flow between two opportunistically meeting nodes [20]. We define contact
volume as the maximum amount of data that can be transferred between two
opportunis-tically meeting nodes. Our studies show that contact volume is dependent on - initial
ve-locities of nodes, distance between nodes, environmental characteristics such as data rate
profile and radio characteristics. We model real-world link costs for multi hop paths
be-tween source and destination nodes. Main contributions include:
1. Modeling of real world path capacities in opportunistic networks;
2. A scheme to incorporate cost and stability of a path for selecting data transfer paths
that guarantee a minimum number of packet transfers;
3. A polynomial time algorithm to calculate desired paths of minimum cost; and
4. Implementation on a test bed of Google Nexus 5, Android 4.4.3 (KitKat) devices to
validate theoretical findings.
In order to evaluate our scheme, we run rigorous simulations on both real-world
and synthetic mobility traces and discover possible data transfers of up to 120 M B at a
communication range of 150 m between the mobile devices. COSC demonstrates 60%
1.3.3 Real-time mobility estimation in participatory environments
We present a novel scheme called MOEME: Real-time Mobility and Orientation
Estimation of Mobile Environments MOEME. MOEME empowers both users and system
architects with the knowledge of user mobility. MOEME estimates relative directional
mobilities of all the users in a participatory environment, in addition to counting the number
of users present within a desired spatiotemporal radius. We demonstrate how MOEME
can be used in a variety of scheduling and resource allocation applications. The accuracy
of predicting contact volume can be improved directly with the knowledge of directional
mobility of users. Furthermore, it helps in predicting the total volume of information that
can be pushed from one end of the network to the other or from a particular source node to
a desired destination node.
Major contributions of MOEME include:
1. Estimation of relative directional mobilities of all users in real-time without requiring
their movement histories; and
2. Estimation of the number of users, that are likely to be within a spatiotemporal region
of interest.
To the best of our knowledge MOEME is the first scheme to make the above mentioned
contributions for estimations of user mobilities in mobile environments.
MOEME estimates distance of users and number of users within a distance of 300m with
an accuracy of 89%. The estimates of direction of users are 77% accurate for nodes within
200m.
The novelty of MOEME lies in its ability to estimate user mobilities with noa priori
knowledge of movement histories. MOEME can be employed in indoor as well as outdoor
environments. MOEME is fully distributed, lightweight and has a time complexity ofO(n)
1.4 Outline
The rest of the dissertation is organized as follows: We give an overview of the
related work and state of the art in Chapter 2. In Chapter 3 we give the details of
pre-dicting contact volume between two opportunistically meeting nodes. Chapter 4 extends
that idea and models real-world capacities of multi-hop paths and simultaneously considers
path stability for efficient collaboration among nodes. Next, chapter 5 gives the details of
CHAPTER 2
Related Literature
In this chapter we present survey of literature related to this dissertation. The survey
is organized under the three categories: (1) Contact volume, (2) Data flow in opportunistic
networks, and (3) Mobility estimation.
2.1 Contact volume
2.1.1 Finding patterns
There exist several algorithms for predicting future contact times among nodes. The
main purpose of these predictions is to enhance message delivery to destinations with
smaller bandwidth consumption. Long Vu et al. [21] constructed a model called Jyotish
which provides prediction of location, stay duration, and contact of a person altogether with
a considerably high accuracy. Marchini et al. [22] developed a mechanism for successfully
detecting cyclic movements and predicting the next appearance of the mobile node. As
pro-posed by Yuan at el. [23], nodes themselves determine the probability distribution of future
contact times and choose a proper next-hop in order to improve the end-to-end delivery
probability.
2.1.2 Throwboxes and RSSI based techniques
Regarding the measurement of contact volumes, Chowdhury et al. [24] proposed a
framework based on IEEE 802.11n wireless to give an analytical model on contact volumes.
Neto et al. [25] used the findings from [24] and predicts the contact volume as a function
using energy efficient throwboxes. These throwboxes are battery-powered stationary nodes
with radios and storage, in an opportunistic network setting. These nodes can predict the
opportunistic contact volume by using a long range radio equipped with a GPS to detect
mobile nodes and to measure their speed and direction.
However, none of the above mechanisms exploit mobility vectors coupled with data
profiles at variant distance to optimize contact volumes. Cyclic pattern detection is not
feasible for environments with high dynamics. Coming up with a probability distribution
function as a predictor of future contact demand sufficient historical information, which
is unavailable in many scenarios. . Although being inexpensive, throwboxes can not be
deployed everywhere to cover areas where opportunistic networks are formed once in a
while. Finally, the idea of calculating of contact volume as a function of RSSI has been
proven to be inadequate [27].
2.1.3 Contact volume application
Color Barcode Streaming for Smartphone Systems (COBRA) is an interesting piece
of work that utilizes Visual Light Communication (VLC) to transfer information between
off the shelf smartphones, using a display screen and on board camera [28]. The foremost
contribution is the design of a new color barcode. The researchers have primarily used three
more colors i.e., red, green, blue, in addition to the standard black and white, to encode
information in a bar code. Special corner blocks and timing references are introduced
along with the main code blocks for accelerated extraction and processing at the receiver
side.
1. Corner blocks: The unique feature of the corner blocks is that the color scheme allows the system to identify the orientation of the bar code in addition to the usual
2. Timing reference blocks: Allows direct access to color code sections for faster decoding.
2.1.3.1 Adaptive code generation
Authors consider the fact that, though theoretically smaller code blocks allow to pack
in more information, doing so may lead to higher blur, which in turn decreases the system
throughput. Therefore, COBRA adaptively adjusts the size of the code block. The idea is
that whenever the acceleration experienced by the device is higher, bigger code blocks are
used and vice versa.
2.1.3.2 Color ordering and blur assessment
The authors have designed clever techniques to optimize the order of the colors to
minimize the blurring effect. Intuitively, most blur occurs at the boundary of different
colors, however, placing similar colors adjacent to each other can reduce the blur
consid-erably. Moreover, the concept of blur assessment is employed, wherein each image (the
system sends multiple images of the same code) is labeled with a Degree of Blur (DOB)
value. The image with the lowest DOB is used for further processing. Apart from this, the
authors use HSV values to match the detected color against the most plausible color. This
enhances the image, making it more crisp for code extraction.
2.1.3.3 Implementation of COBRA on smartphones
The authors have developed a real-world implementation of COBRA on smartphones
2.2 Data flow
One of the earliest works on data transfers in opportunistic networks falls under
the category of routing. There are schemes such as single copy [30] and multiple copy
[31] that try to improve message delivery ratio while making a trade-off between
end-to-end delays. Sadiq et al., presented a method that utilizes nodes’ diffusion and proximity
to improve both delivery ratio and delays [14]. The fastest method to perform routing
in intermittently connected mobile networks is epidemic routing, which entails flooding
the message throughout the network [13]. However, this has obvious drawbacks, such as
overflowing buffers and significant battery consumption on resource constrained mobile
devices. Though routing in essence is related to our work, it generally deals with messages
that are short and do not require considerable contact volume.
2.2.1 Data dissemination
Data dissemination has been studied for conventional Mobile Ad Hoc Networks
(MANETs) [32] [33]. In general, these systems assume that network paths are rather stable
and in some cases generate significant amount of traffic just to maintain knowledge of other
nodes’ caches. Therefore, they are not suitable for user-based opportunistic networks.
2.2.2 Informed mobile prefetching
Prefetching is a technique where data or instructions are loaded in anticipation of
their need in the future [34]. In mobile systems, this hides latency over poor and
inter-mittent wireless connection, but at the same time energy and cellular data usage costs can
grow considerably. In this paper the authors propose a scheme called Informed Mobile
Prefetching (IMP), that boosts performance of higher level application layer by
prefetch-ing data items specifically labeled by an application. The key idea IMP hprefetch-inges on is an
runs a control loop to check the state of budgeted resources and accordingly adjusts the
conversion rate to reduce latency. IMP tries to utilize resources as best as possible, without
exceeding the upper bound. The argument is that most schemes will try to minimize the
use of budgeted resources, overlooking the fact that data plans do not roll over to the next
month. A similar argument applies to battery life, i.e., when a user knows she will recharge
the battery by the end of the day, prefetching should be carried out rather aggressively to
reduce latency and improve user experience as best as possible.
2.2.2.1 Decision algorithm
There are three parts to the decision algorithm used:
1. Performance:The performance benefit of prefetching is calculated as the product of time (Tf etch) to fetch an item in the future and the application/class specific accuracy.
Tf etch is estimated by taking into consideration, the type of network that might be
available in future (WiFi or Cellular), its latency and the size of the data item to
fetch. Similarly, the application accuracy is estimated using ratio of number of items
correctly prefetched to the total number of items prefetched in the past.
2. Energy consumption:The total energy benefit of a prefetch is given byEpref etch− Ef etch×Accuracy. WhereEpref etch = Tpref etch×(PW iF i or P3G). Depending on
which network is available and/or cheaper to use currently.
3. Data usage: Modeling the data usage cost is easier and intuitive. It is given by Dpref etch − Df etch × Accuracy. Where Df etch = S × (1− AvailabilityW iF i).
AvailabilityW iF i is a boolean value, indicating whether the WiFi network is
avail-able or not in the future. Similarly, the value of Dpref etch depends on whether the
WiIFi network is available at the time of prefetch or not.
IMP calculates the net benefit of prefetching by using the above mentioned three
Tf etch×Accuracy−(cenergy×(Epref etch−Accuracy×Ef etch) +
cdata×(Dpref etch−Accuracy×Df etch))
is calculated. If it is positive for a given network, IMP will prefetch it.
2.2.2.2 Implementation
Apart from the decision algorithm for informed mobile prefetching, the authors of
the paper have shown a real world implementation of their scheme. They have modified
two mobile applications i.e., News reader and K9 email application. They have tested the
performance of IMP against other schemes. As mentioned in the paper these schemes
are: ”never prefetch anything, prefetch items with size less than an application-specific
threshold, prefetch over WiFi when it is available but never over the cellular network, and
always prefetch everything.”
2.2.3 Data centric approaches
There are other methods in the literature that take the data centric approach to
in-formation dissemination in opportunistic networks. Conti et al., define how a semantic
representation of information can be used to determine relevance of information to be
ex-changed in opportunistic networks [9]. Pietilanen et al., approach the problem of data
dissemination from a social networking point of view [10].
2.2.4 Time varying graphs
A closely related work to ours is by Bui Xuan et al., who have proposed algorithms
for calculating shortest (in number of hops), fastest and foremost (i.e., earliest arrival) paths
desti-nations from a source and a fixed starting time. However, they do not take into account the
costs associated with the links, instead, their work focuses on number of hops in calculating
the shortest distance. Casteigts et al., study deterministic computations to broadcast data
where edges in a TVG do disappear, but appear infinitely often [36]. However, they also
only take into account the hop counts.
2.3 Mobility estimation
2.3.1 Routing
In dynamic and pervasive networks, a significant amount of research has focused on
efficient routing schemes [37] [38] [39] [40] [41] and content dissemination frameworks
[42] [43] that exploit repetitive patterns in human movement. Recently, there has been
some focus on content and service distributions in open environments, such as parks, malls
etc. where history from past visits is not available [14] [44] or repetitive patterns do not
exist at the time scale of few minutes (0 to 15 minutes).
2.3.2 Multi Dimensional Scaling
Multi Dimensional Scaling (MDS) is a powerful centralized technique for node
local-ization [45]. As the scheme is centralized it is quite accurate and performs well. However,
as the message over head is high (relaying a lot of messages to a central authority), the
required memory, power and computational complexity is high
2.3.3 Two phased localization based on Simulated Annealing
This is a two phased technique, where in the first phase, simulated annealing is used
to get the distance estimate of the localizable nodes. In the second phase, the error caused
by flip ambiguity is removed. This is a centralized approach, which means the
The technique is most suitable in an environment where the nodes are well connected and
resilient to failures. Moreover, it is important that the central agent, handling all
computa-tions, is powerful and robust.
2.3.4 RSSI based centralized localization
This is a three step process, where in the first step a general map of the network is
formed. In the next step, anchor nodes are used to get a view of distance ranges between the
nodes. Finally, an optimization problem is solved to get an accurate position of the nodes.
The method is both power hungry and complex because of the optimization involved. In
terms of implementation, the memory and networking costs are high as well.
2.3.5 Coordinate System Stitching
There are two main methods that fall under this category of localization.
1. Construction of Global Coordinate System in a network of Static Computa-tional Nodes from Inter Node Distance: In this approach a spatial map and the distance matrix are computed for the whole wireless network. Once this step is
completed, discrepancies in the aforementioned data are minimized using Euclidean
translations, rotations and reflections. The scheme has good accuracy without the
need of explicit anchor or seed nodes. However, there is high communication cost
associated with this method. The primary reason being the transfer of coordinate
system information from the source to every other node in the network. For similar
reasons, the addition of each node to the network adds complexity to the scheme
making it less scalable.
2. Cluster based approach:This technique has good accuracy and low communication overhead. The main advantage of the scheme is deployment for an application where
can be a result of a difficult terrain or inaccurate sensors (with high noise variance),
then the cluster based approach may not be able to localize a considerable number of
nodes.
2.3.6 Interferometric Ranging Based Localization
This is a localization approach that requires no other sensors, other than the ones used
for wireless radio communication [46]. However, the problem of localization itself is
NP-complete. As pointed out in the paper, there are genetic algorithms and other RSSI based
techniques that optimize the solution by reducing the search space. Though the accuracy
of these methods is high, but at the same time the messaging overhead is quite large. The
overall advantage of Interferometric Ranging Based Localization is that the measurements
can be very precise, however, the scheme requires large sets of measurements, which makes
it less suitable for smaller WSNs.
2.3.7 Beacon based distributed localization
Beacon based distributed localization techniques can be broadly categorized into
three methods [45].
1. Diffusion based: For the diffusion based method the position of the node is esti-mated by calculating the centroid of the neighboring already localized nodes. As
the scheme requires a large number of nodes, the overall power consumption can
get considerably large, increasing the computation and memory requirements on the
whole. However, the scheme is robust to failures, as there are many nodes and if
some of them fail, (though not the critical ones) localization with good accuracy can
still be achieved. The strong points of this technique are simple and easy
implemen-tation. As mentioned before, the scheme will work best in an environment, where
2. Bounding box:As the name suggests, these techniques form a bounding box around and node and subsequently, redefine its position based on this view. The main
ad-vantage of this technique is good accuracy which is achieved by using beacons or
anchor nodes that are located on multi hop paths. The two of the algorithms
dis-cussed in the paper have a provision of making a tradeoff between communication
and computation costs.
3. Gradient based: In the gradient based approach the nodes keep counters to deter-mine the hop count from the ‘seed’ nodes. Seeds are similar to anchor nodes, which
are aware of their global coordinates. The advantage of gradient based approach is
that it is scalable in terms of addition of both seeds and regular nodes. Moreover,
it is resilient to node failures. However, the accuracy of the system depends on the
node density in the environment, where more number of nodes translate into higher
localization accuracy. Finally this scheme is easy to deploy but works best in terrains
where there are no obstacles blocking the communication. Such obstacles will lead
to incorrect hop counts.
2.3.8 Plausible mobility
There is only one work [47] that aims to create plausible mobility merely through
user contacts but requires a centralized server to keep track of all contacts in real time.
In contrast, we present the first work that estimates: 1) relative directional mobilities of
all users in real-time without requiring their movement histories; and 2) the number of
users, that are likely to be within a spatiotemporal region of interest, through opportunistic
CHAPTER 3
PCV: Predicting Contact Volume for Reliable and Efficient Data Transfers in Opportunistic Contacts
3.1 Introduction
There are various challenges posed by participatory environments for delivering
con-tent and transferring data between participating nodes. In this chapter we identify and deal
with one such challenge. We have focused our attention on two mobile participating nodes,
and leverage their physical properties to reliably and efficiently transfer data between them.
The work presented in this chapter lays the groundwork for extending the scheme to
mul-tiple nodes in the environment.
Employing PCV1, it is possible to exploit contact durations among pairs of
interme-diate nodes to deliver video chunks to a group of mobile users reliably. When the contact
duration is short, it is worthwhile to transfer at least part of the information, as compared
to the full video chunk a node may have. The latter has a higher chance of failure than the
former in opportunistic networks. In such a case, an accurate prediction of contact volume,
defined as the maximum possible amount of data transferable during a contact, can help
in making better choices (in terms of cost, delay, and/or fidelity) at the application level.
Knowledge of contact volume at the start of an opportunistic contact would facilitate
effi-cient management of resources in challenging network environments to meet the needs of
a variety of application and user requirements. It should be noted that the user mobility
patterns are haphazard in dynamic and unpredictable public environments. Existing works
1The work presented in the chapter was completed during 2012-13, when the PhD candidate and the
utilizing cyclic mobility patterns or forecast peer interactions [48] [22] for effective
infor-mation dissemination in opportunistic networks, are likely to perform poorly in such an
environment. Furthermore, the use of contact duration distribution [49] for the prediction
of contact volume does not hold promise for similar reasons.
In this chapter, we propose a novel scheme PCV that is used to predict the contact
volume between two opportunistically meeting nodes based on their initial position and
velocity vectors at the time of contact. The energy consumption is reduced by PCV by
switching on Global Position System on a device only at the time of contact. PCV is the
first scheme that also supports bandwidth sharing among mobile users who may or may not
be within each other’s communication range.
PCV is primarily developed to assist applications in opportunistic networks, by
mak-ing data transfers reliable and efficient. Conceptually, PCV serves as a middleware
inter-face between the application and the opportunistic network layers. PCV estimates contact
volume for any pair of nodes meeting opportunistically in soft real-time and subsequently
sends this information to the application layer above. Our major contributions are
summa-rized below.
• System Model: Analytical model to compute instantaneous distance and contact
duration between nodes. These values are used in the PCV algorithm to compute
contact duration and instantaneous distance between the nodes in an opportunistic
network.
• Data Rate Profile: A custom Android Application to acquire data rate profiles of
contacts between nodes in an opportunistic network to facilitate the prediction
pro-cess. Data rate profile incorporates wireless characteristics for different
environ-ments. In order to validate PCV, we have collected data rate profiles for a real world
v
j
v
i
(p
j
)
X Y
(p
j
)
(0,0)(a) Initial scenario, i.e., before applying transfor-mations
v
j
v
’
i
(p
j
)
X Y
-v
i
v’
j
=0
(p
i
)
(0,0)(b) In the Inertial Frame of Reference of nodeni
v’
i
(p’
j
)
XY
v’
j
=0
.
α
β
do
[image:35.612.199.404.326.496.2](c) After applying Euclidean Translation to posi-tionni at (0,0)
Figure 3.1: Series of transformations applied for calculating contact duration of two nodes
• PCV Algorithm: PCV algorithm predicts the contact volume for pairs of nodes.
The algorithm is simple, scalable and runs in linear time in terms of the number of
opportunistic contacts a node makes.
The primary focus of PCV is to make file transfers reliable and efficient to improve the
privacy and security issues that may arise out of sharing data among untrusted nodes. To
address this, PCV is designed to have a compartmentalized structure in order to
accommo-date anonymity and encryption techniques. Moreover, PCV can also use any state of the
art routing and forwarding schemes for opportunistic networks [14].
3.2 System Model
In this section, we develop a model for opportunistic contacts between two nodes in
an opportunistic environment. Expressions for contact duration and instantaneous distances
between nodes are derived using nodes’ positions and velocities at the time of contact.
Both contact duration and instantaneous distances of the nodes capture the dynamics of an
opportunistic contact, and are critical for the estimation of contact volume.
3.2.1 Contact Duration
LetN = {n1, n2, n3, ..., nl}be the set of l nodes, where all nodes have a
homoge-nous radio communication ranged0. Whenever two nodesni,nj ∈N, where1≤i, j ≤l, come within each others’ radio communication range, they are said to be in ‘contact’. Let
tij = tji be the duration of this contact. For the sake of simplicity we assume the nodes
to move in a two dimensional space. However, the analysis can easily be scaled to three
dimensional space. Instantaneous position and velocity vectors are used to predict the
con-tact duration. Let
~
pi =
pix piy
, ~pj = pjx pjy ~vi =
vix viy
, ~vj = vjx vjy
be the instantaneous position and velocity vectors of the nodesni andnj, at the start of the
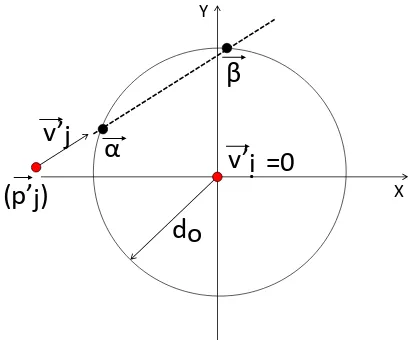
3.2.1.1 Inertial Frame of Reference and Euclidean Translation
In nodeni’s inertial frame of reference, applying Euclidean Translation to position
ni at the origin, the transformed position and velocity vectors ofniandnj are,
~ p0 i = 0 0 , ~p
0 j =
pjx−pix
pjy−piy
~ v0 i = 0 0 , ~v
0 j =
vjx−vix
vjy −viy
respectively. Fig. 3.1 illustrates the effect of these transformations in succession. The
durationtij is the time for whichnjstays within distanced0of nodeni, which is essentially
the time it takes for a node to traverse a chord in a circle of radiusd0, as depicted in Fig.3.1c.
The chord through the circle, defined by x2 +y2 = d
0 is traced by a line y = mx+σ,
where
m = vjy−viy
vjx−vix
σ = (pjx−pix)−(
vjy−viy
vjx−vix
×pjx−pix)
Solving the equation of the line and circle simultaneously leads to a quadratic equation in
x, as follows:
(m+ 1)x2+ 2mcx+σ2−d02 = 0 (3.1)
Let the solutions of the quadratic Equation (3.1) be
~ α= αx αy
and ~β =
βx βy
The effective displacement of chord that nodenj traverses while staying in contact
withniis expressed as
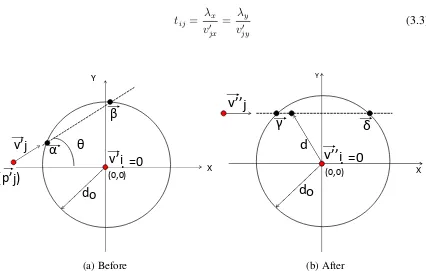
Therefore, the final contact duration of the nodes is given by
tij =
λx
vjx0 =
λy
v0jy (3.3)
v’
i
(p’
j
)
X Y
v’
j
=0
.
α
β
do
θ
(0,0) (a) Beforev’’
i
X Y
v’’
j
=0
.
γ
δ
do
(0,0)
d
[image:38.612.93.519.106.377.2](b) After
Figure 3.2: Effect of rotational transformation by angleθ
3.2.2 Instantaneous Distance
In order to make an estimate of the contact volume, the instantaneous distance
be-tween nodesniandnjis calculated as a function of time. This will be used in Section3.3to
express the data rate profile as a function of time. In wireless communications, the received
signal powerPrec at the receiver varies inversely with the distancedfrom the sender. The
relationship is concretely represented as Prec ∝ 1/dψ, where the exponentψ depends on
the environment in which the nodes operate. It is also known that the transmission data
rate depends onPrec, making the data rate a function of instantaneous distance [50]. In a
dynamic environment the nodes are usually mobile during an opportunistic contact.
As-suming a constant data rate between these mobile nodes for the entire duration of contact
model accounts for the changing distance and hence, variable data rate during the contact
period.
3.2.2.1 Distance as a function of time
In Section3.2.1 we see that the essential dynamics of the model are characterized
byv~0i, v~j0, ~α andβ~. In order to exploit the inherent symmetry in the problem, a rotational
transformation is applied as follows:
M0 =
vix00 vjx00 γx δx
v00iy vjy00 γy δy
= cosθ sinθ
−sinθ cosθ
vix0 v0jx αx βx
viy0 v0jy αy βy
=RM
where, θ = arctan(v
0
jy
v0
jx). This rotational transformation moves every vector in M by the
angleθclockwise about the origin to give their rotated counterparts inM0. Fig. 3.2 shows the result of this rotational transformation. Note that after rotation, the trajectory of nj is
parallel to the horizontal axis, therefore:
γy =δy; vjy00 = 0; v~i00 =v~
0
i = 0. (3.4)
Using (3.4), we can trace the trajectory of nodenj after it comes within the communication
range ofni. Thus, for any timetwhere,0≤ t≤t0(contact duration), the motion ofnj in
two dimensional space is given by
x=γx+ (vjx00 ×t) (3.5)
1 2 3 4 5 6 7 8 9 10 0 2 4 6 8 10 12 14 16 Distance (m)
Transmission Time (s)
Experiment Bluetooth Spec
(a) File Transfer time at different distances be-tween two Nexus One smartphones (filesize =1000KB)
1 2 3 4 5 6 7 8 9 10
0 40 80 120 160 200 240 Distance (m)
Data Rate (KBps)
[image:40.612.101.503.105.275.2](b) Cubic spline for obtaining data transmission rate at different distances
Figure 3.3: DatPro results
From Equations (3.5) and (3.6), the instantaneous distance betweenniandnj is given by,
d =
q
(γx+ (vjx00 ×t))2+γy2 (3.7)
3.3 Data Rate Profile
The data rate between wirelessly communicating nodes depends on the distance
be-tween the nodes and the environment in which they operate. Specifically, the environment
characterizes the amount of interference faced by the communicating nodes. For
exam-ple, environments cluttered with buildings, trees or terrain irregularities will give rise to a
higher value of the exponentψ, i.e., the received power at the receiver drops steeply with
the distance from the sender, thereby lowering the data rate at a given distanced≤d0. It is
usual practice to determine the value ofψ empirically for a given environment. Empirical
models have the benefit of limited reliance on detailed knowledge of the terrain and speed
pro-file for a given environment. Subsequently, in order to interpolate the discrete set of data
rates obtained from the application, cubic splines [52] are used.
3.3.1 Custom Android Application for Learning Data Rates
We developed a custom Android Application called DatPro in order to obtain data
rate profiles as a function of distance. DatPro is primarily designed to obtain Bluetooth
data rates in a real-world scenario. However, it can be enhanced to work with 802.11n and
WiFi Direct [53]. DatPro serves as a proof of concept and aids the application designers
to better understand the data rate constraints prevalent in a specific opportunistic network
environment.
In this chapter, the DatPro is used to collect data rate profile in the outdoor
environ-ment of our university campus. The experienviron-ments were carried out in the walk-ways beside
a multi-storied building and in a parking lot, of the university. Table3.1shows the different
wireless devices used for collecting data rate profiles. As all the devices had similar trends
in data profiling, we use results obtained only from Google Nexus One in the following
sections. This particular device ran Android version 2.3.6 operating system and Bluetooth
version 2.1 EDR (Enhanced Data Rate). Fig. 3.3ashows the effect of distance on the file
transmission period. It is evident that with increasing distance, a file requires more time for
transmission, implying the drop in data transmission rate with distance.
Table 3.1: Wireless devices used to gather data rate profiles
Device Name Platform
Google Nexus Android2.3.6
Motorola Milestone Android2.1
Acer Iconia A500 Android4.0
3.3.2 Cubic Splines for Estimating Data Rates
Once the data rates are measured at different distances of separation between the
wirelessly communicating devices, a curve is fitted through these discrete set of points to
compute the data rate function denoted byR(d). Cubic splines are used for curve fitting,
as they have the advantage of giving good estimates without the danger of over fitting.
Moreover, as the first and second derivatives are continuous on the break points, the curve
is nicely smooth [52]. Fitting the data rate points with cubic splines defines the data rate
profile as,
R(d) =
R1(d) d1 ≤d≤d2
R2(d) d2 ≤d≤d3
.
.
.
Rk(d) dk ≤d≤dk+ 1
where thekthcubic polynomial is represented as
Rk(d) =ak(d−dk)3+bk(d−dk)2
+ck(d−dk) +dk
and d1, d2, ..., dk are the distance values at the break points. Using cubic spline on the
set of data presented in Fig. 3.3a, we plot the changing data rate against distance in Fig.
3.3b. This data rate profile is used to measure the final contact volume possible when node
ni meets nj. It is also noted that the actual data rates obtained in this environment are
considerably lower (R ≤220KBps) than the ones mentioned in the official Bluetooth 2.1
Algorithm 1Contact volume estimation by PCV
Require: R(d),~vi,~vj ,~pi and~pj
for allOpportunistic contactsdo
Transform velocity and position vectors to~v0i,~vj0,~p0i andp~0j
tij ←Evaluate eq. (3.1), (3.2) and (3.3)
d ←eq. (3.7)
SubstitutedinR(d)to getR(t)
Vc0 ←Evaluate eq. (4.1)
return Vc0 end for
3.4 Contact Volume
In Sections 3.2 and 3.3 we have derived the important parameters that PCV uses
to estimate the contact volume, defined as, the maximum amount of transferrable data
during an opportunistic contact. This section glues together contact duration, instantaneous
distances and data rate profile in an algorithm that forms the backbone of PCV.
LetdVc be the small amount of data that can be transferred during a contact. Then
the instantaneous data rate is represented as, dVc
dt = R(t)wheredtis an infinitesimal time unit. To derive an upper bound on the total amount of data that can be transferred, i.e., the
contact volumeVc0, the above expression is integrated over the contact durationt0.
Vc0 =
Z t0
0
R(t)dt. (3.8)
PCV estimates the contact volume at the start of an opportunistic contact as detailed in
0−9 9−18 18−27 27−36 36−45 0 20 40 60 80 100
Actual Contact Volume (MB)
Percentage (%)
Weaker Prediction Stronger Prediction
(a) Disney World
0−9 9−18 18−27 27−36 36−45
0 20 40 60 80 100
Actual Contact Volume (MB)
Percentage (%)
Weaker Prediction Stronger Prediction
(b) State Fair
1−4 4−8 8−12 12−16 16−20 20−24 0 20 40 60 80 100
Actual Contact Volume (MB)
Percentage (%)
Weaker Prediction Stronger Prediction
(c) TLW
0−10 10−20 20−30 30−40 40−50 0 20 40 60 80 100
Actual Contact Volume (MB)
Percentage (%)
Weaker Prediction Stronger Prediction
[image:44.612.95.521.90.487.2](d) SLAW
Figure 3.4: Prediction strength for different ranges of actual contact volume
3.5 Performance Evaluation
In this section, we present results of exhaustive simulation experiments pertaining to
both real world mobility traces [54,55] as well as synthetic mobility traces [17,56]. Data
3.5.1 Simulation Setup
The real world traces used for simulation were acquired from two groups of
volun-teers who visited the NC State Fair [54] and Disney Land in Orlando, [55] respectively,
where each of the volunteer’s positions were recorded at 30 seconds intervals. There are 19
and 41 log files for the State Fair and Disney Land traces respectively. We consider each
file as a mobility trace of one independent smartphone bearer agent or node. The State
Fair and Disney Land traces span over a period of less than 3 hours and less than 12 hours,
respectively.
Additionally, we use two synthetic traces based on the Truncated Levy Walk (TLW)
[56] and Self-Similar Least Action Walk (SLAW) [17], to emulate the statistical features
observed in human mobility.
An opportunistic contact begins when the distance between the nodes is≤ d0 and
ends when the distance is >d0. The contact volume calculated through PCV is called
predicted contact volume. We also define thestateof a node, as its velocity at the beginning
of a contact.
In our simulations, during each opportunistic contact, the objective is to transmit a
file. At the instance when two agents come in contact of each other, the PCV algorithm
makes a prediction of the contact volume. If the file size (SF) is less than the predicted
contact volume (Vc), then PCV initiates transmission. Otherwise the transmission is
de-layed. If the predicted volume is in the range of 70%-100% of the actual contact volume,
we term the prediction asStronger Prediction. Otherwise, we call it aWeaker Prediction.
The choice of range for differentiating between stronger and weaker prediction is justified
in Table3.3, which demonstrates the results obtained from all the test scenarios. The range
is chosen carefully based on the minimization of the false negatives. Through
experimenta-tion, we observed that the percentage of false negatives falls with decrease in PCVR range
Disney World State Fair TLW SLAW 10
20 30 40 50 60 70 80 90 100
Bandwidth Wastage (%)
[image:46.612.178.414.103.297.2]Without PCV With PCV
Figure 3.5: Bandwidth wastage with and without prediction.
drops from 7% at a PCVR range of 50% to 100%, to 5% at a range of 70% to 100%, and
remains at 5% for the range of 80% to 100%. As this trend is consistent across all traces,
we have chosen 70% to 100% as a safe choice for stronger prediction. It should be noted
that a weaker prediction is not synonymous with a wrong prediction, which we elaborate
in section3.5.2.
Simulation details and Relevant Metrics: We developed a custom simulator in MATLAB. To retrieve each node’s position every second in real world traces, we use linear
interpolation between two sample points from the trace, which are temporally 30 seconds
apart.
We generate synthetic traces of 50 persons for 6 hours, using TLW [56] by modifying
the implemention suggested in [57]. We set the Levy exponent for flight length distribution
as αl = 1.6 and Levy exponent for pause time distribution as βl = 0.8. The choice ofαl
andβlis also inspired from [57], where the authors successfully generated the inter-contact
time distribution of the UCSD trace [58]. The simulation area is chosen as1km x1km, and
1 50 100 250 500 1K 2K 3K 4K 5K 30 60 90 120 180 300 600 900 1800 0 10 20 30 40
Chunk Size (KB) Waiting Time (s)
[image:47.612.181.430.94.273.2]Bandwidth Recovered (%)
Figure 3.6: Effects of chunk sizes and waiting times on bandwidth recovery for Disney World trace
is logged after every 10 seconds. We generate the intermediate poisitions between two
[image:47.612.199.415.413.538.2]sample positions using linear interpolation. In addition, synthetic mobility traces of 50
Table 3.2: Distribution of files transferred
File Type
Percentage among all files
(mean, standard deviation) in megabytes
Image 48 (0.5,0.4)
Text 35 (0.75,0.6)
Video 3 (15,12)
Audio 3 (6.3,5.5)
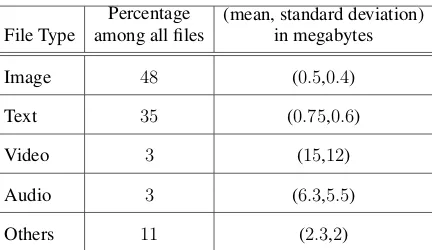
Others 11 (2.3,2)
Table 3.3: Percentage of false negatives at different estimated contact volume ranges [Con-tact Volume Ratio (Predicted vs Actual) = PCVR]
PCVR Disney World State Fair TLW SLAW
0.5−1.0 7% 9% 7% 6%
0.6−1.0 6% 7% 6% 5%
0.7−1.0 5% 7% 5% 4%
people for6hours, are generated using SLAW [17], also by modifying the implementation
suggested in [59]. Thus 600 waypoints are generated within a square area of side length
of1500m. The distance parameterαsis set to3, Levy exponent for pause timeβs is set to
1, Hurst parameter for waypoints (H) is set to 0.75. A node’s pause time varies from10
seconds to5minutes. We record each node’s position at30second interval and retrieve the
intermediate positions through linear interpolation.
0 0.5 1 1.5 2
0 0.2 0.4 0.6 0.8 1 Velocity (m/s) CDF Stronger Prediction Weaker Prediction
(a) Disney World
0 0.3 0.6 0.9 1.2
0 0.2 0.4 0.6 0.8 1 Velocity (m/s) CDF Stronger Prediction Weaker Prediction
(b) State Fair
0 0.2 0.4 0.6 0.8 1
0 0.2 0.4 0.6 0.8 1 Velocity (m/s) CDF Stronger Prediction Weaker Prediction (c) TLW
0 0.2 0.4 0.6 0.8 1
[image:48.612.95.519.247.657.2]0 0.2 0.4 0.6 0.8 1 Velocity (m/s) CDF Stronger Prediction Weaker Prediction (d) SLAW
In order to determine the file sizes, to be transferred in the simulation, we consider
PCV’s prospect in potential human centric applications aimed at online social network
(OSN) and Pocket Switched Network (PSN). This makes the distribution of the downloaded
multimedia contents by smartphones as a feasible candidate for determinining the sizes of
our synthetic files.
To this end, results from [60] and [61] are used for assessing the downloaded contents
both in terms of the number of files and bytes and the average file size. In addition, using
the results from [62], we use log-normal distribution with separate parameters for each type
of files. The combined decisions are elaborated in Table 3.2.
The following performance metrics are considered in the simulation studies:
• Prediction Strength: Reliablity and success potential of the predictions with PCV, for
different ranges of actual contact volume.
• Bandwidth Saving: The range of possible bandwidth savings through the
implemen-tation of PCV.
• File Chunk size and Waiting Time Frame: Impact of variable chunk sizes and variable
waiting time frame, on bandwidth savings, after initial file transmission distruption.
• Initial State: Influence of nodes’ initial state, defined by their velocity, on the
predic-tion accuracy.
• False Negative: Impact of false negative predictions in PCV.
Table 3.4: Percentage of maximum possible data transmission in real experiments (com-pared to Bluetooth Specification)
Disney World State Fair TLW SLAW
3.5.2 Simulation Results
The maximum amount of transferable data during a contact volume is computed
using the DatPro results plotted in Fig. 3.3b. Table3.4shows the comparison between the
practical higher limit of total data volume calculated through DatPro and theoretical higher
limit mentioned in Bluetooth specifications. However, without a sophisticated prediction
mechanism, even the practical higher limit is difficult to achieve.
Fig. 3.4shows the percentage of stronger and weaker predictions for different ranges
of actual contact volumes. As evident from the charts, the predictions are stronger for larger
contact volumes. This gives an insight about the PCV’s effectiveness in reducing bandwidth
wastage, as the system suffers most in terms of energy and bandwidth due to its failure
to transmit larger files. Again, recall that a weaker prediction does not imply a wrong
prediction. Both over-prediction and under-prediction may eventually lead to successful
transfer of many files. However, over-prediction runs the risk of initiating the transfer of
a file larger than the actual contact volume, which is destined to fail, thereby resulting
in bandwidth wastage. On the other hand, under-prediction may lead to disallowance of
the initiation of eligible file transfers, resulting in unused resource. In our experiments,
the average percetage of successful transmission in case of weaker predictions are67.3%,
62.1%, 68% and 73% in terms of data volume for Disney World, State Fair, TLW, and
SLAW respectively.
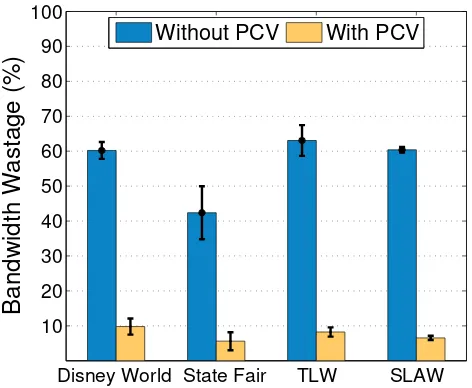
Fig. 3.5 compares bandwidth wastage in two cases: with PCV and without PCV.
From the graph, it is evident that over50%of bandwidth is wasted when nodes try to
trans-mit during oppportunistic contacts, without predicting. However, if they make decisions
based on PCV, the wastage is reduced to less than10%. This is demonstrates a significant
achievement of PCV.
Transmitting data in chunks can further reduce the bandwidth wastage. It can be
spe-cific time frame to re-establish contact with the recieving node, after the initial contact
is distrupted. Trying to transmit the whole file together, results in wastage of bandwidth.
In Fig. 3.6 we plot the percentage of bandwidth, recovered from this wasted bandwidth,
against different chunk sizes and waiting times in Disney World scenario2. Since more files
transmit successfully with smaller chunks and larger waiting times, the bandwidth wastage
is reduced. On the other hand, very small chunk sizes incur additional overhead whereas
very large waiting times increases buffer consumption. Considering this trade-off, the
ap-plications can decide on the best operating point for a suitable chunk size and waiting time
frame.
From Fig. 3.7 it is evident that the state of the node, which is characterized by its
velocity, also affects PCV performance. Velocities are plotted along the x axis and their
respective cumulative distribution function (CDF) is plotted along the y axis. As we can
see from the graph, for weaker predictions, the CDF grows much faster at the beginning,
meaning that when the nodes have relatively smaller velocity, it is difficult to predict their
movement, which is intuitive. For example, if both nodes remain static, the predicted
contact volume can be extremely large, which may not be true in reallity.
One major concern about any prediction scheme can be the false negative generation
rate, that blocks the otherwise eligible transmissions. In a worst case scenario, the available
bandwidth may remain unutilised, thus offsetting the bandwidth savings. To quantify this
aspect, we plotted the percentage of false negatives with respect to the number of files as
well as the unused bandwidth. As illustrated in Fig. 3.8, the portion of the files affected
by false negatives is quite small to have an impact on the overall gain of the system. More
importantly, in terms of bandwidth less than 10% , implying that smaller files are more
likely to be affected.
2Results for Disney World, TLW, and SLAW are similar to State Fair scenario, so we do not report them
Disney World State Fair TLW SLAW 0
10 20 30 40 50
Unutilized Bandwidth (%)
[image:52.612.183.413.103.289.2]File Count Bandwidth
Figure 3.8: Effect of false negatives
3.6 Discussion
3.6.1 Conserving Battery Power
GPS and accelerometer readings on contemporary smart phones give a measure of
position and instantaneous velocity. Using accelerometer readings instead of GPS has been
shown to consume less energy [63] [64]. Moreover, as accelerometers are usually active on
smartphones to detect screen orientations, their usage does not incur additional cost.
In order to minimize battery consumption, PCV, senses a node’s position and velocity
only at t


![Figure 4.1: A TVG representation of an opportunistic network where one connected cluster C1, ...C4 comprising {v1, ..., v5} ishighlighted, with a = 1 and b = 4 and a, b ∈ τ[0, 4].](https://thumb-us.123doks.com/thumbv2/123dok_us/95629.8977/57.612.89.694.218.356/figure-representation-opportunistic-network-connected-cluster-comprising-ishighlighted.webp)