Modeling, Simulation and Fabrication of 100 nm (Leff) High Performance CMOS Transistors
Full text
Figure


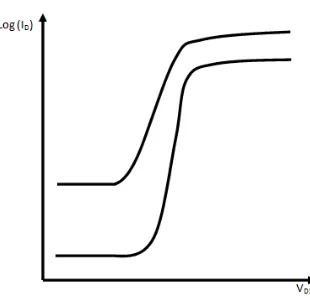
![Fig. 6: IV curve showing weak, moderate and strong inversion region of operation [2].](https://thumb-us.123doks.com/thumbv2/123dok_us/96769.9077/22.595.181.432.220.454/fig-curve-showing-moderate-strong-inversion-region-operation.webp)


![Table 1: Comparison of NTRS physical parameters with simulated device at RIT [3].](https://thumb-us.123doks.com/thumbv2/123dok_us/96769.9077/27.595.112.523.278.550/table-comparison-ntrs-physical-parameters-simulated-device-rit.webp)
![Table 4: Duration of TED at various temperature ranges [5].](https://thumb-us.123doks.com/thumbv2/123dok_us/96769.9077/48.595.102.530.308.573/table-duration-ted-various-temperature-ranges.webp)


Outline
Related documents
In critically ill patients with circulatory shock, there was disagreement and clinically unacceptable trending ability between values of cardiac output obtained by uncali-
In the first stage, the algorithm determines whether a node belongs to the graph proper which consti- tutes the core network, or to a tree structure in the periphery.. The
At the same time, the quality of these algorithms’ query answers is high: 75.2%, 66%, and 82.5% of the previously unsuccessful queries have rel- evant answers based on the
PROCEEDINGS Open Access Are quantitative trait dependent sampling designs cost effective for analysis of rare and common variants? Yildiz E Yilmaz1,2*, Shelley B Bull1,2 From Genetic
Genetic correlations across seasons were sig- Heterogeneous natural selection can maintain quan- titative genetic variation in the wild if it favors different nificantly ⬍ 1 in
Whereas, applying the filter to the same profile of water pipe at a depth (0.632m)near the road for the faculty of pharmacy at the direction from north to south. When applying
The objective of this study is to determine if a new prescription of an antidepressant upon inpatient discharge is associated with a reduction in the number of future
Five-year changes in gait biomechanics after concomitant high tibial osteotomy and ACL reconstruction in patients with medial knee osteoarthritis. Zaffagnini S, Bonanzinga T,
