Rochester Institute of Technology
RIT Scholar Works
Theses Thesis/Dissertation Collections
10-2015
A VISUALIZATION AND
CHARACTERIZATION OF
MICROSTRUCTURES OF COHESIVE
POWDERS
Vineeth R. Patil
Follow this and additional works at:http://scholarworks.rit.edu/theses
This Thesis is brought to you for free and open access by the Thesis/Dissertation Collections at RIT Scholar Works. It has been accepted for inclusion in Theses by an authorized administrator of RIT Scholar Works. For more information, please [email protected].
Recommended Citation
A VISUALIZATION AND CHARACTERIZATION OF
MICROSTRUCTURES OF COHESIVE POWDERS
Vineeth R. Patil
B.Tech. Metallurgical & Materials Engineering
National Institute of Technology Karnataka Surathkal, India
A thesis submitted in partial fulfillment of the
requirements for the degree of
Master of Science in Materials Science & Engineering in the
School of Chemistry & Materials Science,
College of Science
Rochester Institute of Technology
October 2015
Signature of the Author _________________________________________
Accepted by __________________________________________________
ii
SCHOOL OF C HEMIS TR Y AND M ATER IA LS SC IENCE COLLEGE OF SC IENCE
ROCHESTER INST ITUTE OF TECHNOLOGY ROCHESTER , NEW YOR K
CERT IF IC ATE OF A PPROVAL
M.S. DEGREE THES IS
The M.S . Degree Thesis of Vineeth R . P atil has been exami ned and approved b y the Thesi s Committ ee as sati sfactor y for the thes is required for the M.S. degree in M at eri als Science and Engi neering.
______________________________________________ Dr. Shu Chang, Thesis Advisor
______________________________________________ Dr. Marcos Esterman, Thesis Co-Advisor
______________________________________________ Dr. Scott Williams, Committee Member
______________________________________________ Dr. Denis Cormier, Committee Member
iii
ABSTRACT
In thi s work, a framework for the det erm ination of t he part icl e
positi ons in a fluorescent powder st ructure was creat ed . The feasi bilit y of
imagi ng and quanti f ying sedim ent ed part iculate s amples in ai r was
dem onst rated b y usi ng mi cron -siz ed pol y-di spersed elect rophotographic
printing parti cl es . Parti cle positions were det ermined b y a C onfocal Las er
Scanni ng M icros cope (C LSM ) t o capture a stack of cross -s ect ional im ages
of flu ores cent particle clust ers . The resulting images were anal yz ed using
Matl ab im age proces sing tool s . The XYZ coordinat es and radii for thes e
parti cles (assum ed s pheri cal) were cal cul at ed i n s everal s el ect ed sam pling
volum es , and the packi ng fractions were cal culated . A t hree -dimensional
visualization of the part icl e st ructure was then created . The C LSM parti cl e
results obtai ned from this stud y were compared wit h S canning Elect ron
Micros cop y (SEM ) parti cle imaging res ults . A di fference in the average
parti cle radii of the C LS M result s from t he SEM res ults was obs erved . The
three-dimensi onal reconstruction of t hese parti cl es showed a highl y porous
struct ure. The average packing fracti on of 14.07% ± 0.84% was com parabl e
to the lit erature packing fraction values for cohesive parti cles [1]. The
cohesi ve nat ure of t oner was not ed from this com paris on. Bas ed on thi s
finding, the sel f -sim ilar nature of the particl e clusters was invest i gated i n
the sampl es.
This m ethodol ogy of thre e-dim ensional particle m apping and
iv
struct ural anal ys es for fine particl es. The fram e-b y-fram e part icl e-t racking
method devel oped in this stud y can be adapted int o ot her di gi tal im aging
methods like X -ra y micro -computed tom ograph y (μCT) where the s canned
v
DEDICATION
To m y parents , R aghavendra P atil & Kam al a P atil , for all the
unconditional l ove and support the y have provided during m y M ast er’s
degree. Al though hal f a world awa y, I never felt impoveri shed of thei r care
throughout the three years I have s pent awa y from hom e. You have gi ven
me ever ything, and I am the luckiest son in the world.
To m y si st er, Nam rat a Pat il, for cheering m e up even in the toughes t
of t imes and for alwa ys being a support i n such tim es .
To al l m y fri ends here and i n Indi a, without whom li fe woul d have
vi
ACKNOWLEDGMENT S
Fi rst, I would like t o thank m y advis or, Dr. Shu Chang, for all t he
care, gui dance, support and knowledge s he has provided duri ng m y thesis
research. I am t rul y grateful to her for having accept ed the t as k of
ment ori ng m e on t hi s research despi te al l the odds faced. I feel extrem el y
luck y to be t he firs t student advi sed b y h er for a Master’s Thesis . I would
also like to t hank m y co -advisor, Dr. Marcos Esterm an for helping m e s et
up m y experim ental space initi all y and for being supporti ve duri ng m y
research da ys . Special thanks t o m y com mi ttee m embers, Dr. Denis Cormi er
and Dr. S cott Willi ams for thei r professi onal gui dance and valuabl e i nput
on all part s of this thesis . Special t hanks t o the mem bers of t he PR ISM Lab
and the Next Print Lab – Dr. Alvaro Roj as, Nathan Ost rout , Heng Li , Di
Bai, M ariel a Rodri guez and Yuan Tia n. Speci al thanks t o Dr. Cher yl
Hanzlik and P rof. Ted Ki nsm an for the guidance provided for t he Confocal
Las er S canni ng Mi cros cop y and S canni ng Elect ron Mi cros cop y sessions
respectivel y.
This res earch i s s upport ed b y t he M elbert B. Car y J r. endowm ent b y
the Coll ege of Im agi ng Arts and S ci ence and b y the Nati onal S ci ence
Foundati on P artnerships for Innovation Building Innovation C apacit y (P F I:
B IC) subprogram under Grant No. 1237761. An y opi nions, findings , and
concl usions or recom mendati ons expressed i n t his m at e ri al are thos e of the
aut hor(s ) and do not necessaril y reflect t he vi ews of t he Nati onal S ci ence
vii
TABLE OF CONTENTS
ABSTRACT………. iii
DEDICATION………... v
ACKNOWLEDGEMENTS………... vi
TABLE OF CONTENTS………. vii
LIST OF FIGURES………. viii
LIST OF TABLES………...ix
CHAPTER 1: INTRODUCTION……….. 1
1.1: Theoretical Background……….. 5
1.2: Overview of Previously Published Literature………... 10
1.3: Research Directions………... 25
CHAPTER 2: METHODOLOGY………...… 27
2.1: Sample Preparation………..………. 28
2.2: Imaging Methodology………....………….…. 29
2.3: Image Analysis………. 34
2.4: Packing Fraction Analysis……… 40
CHAPTER 3: RESULTS………..…... 43
3.1: Particle Distribution Analysis……….….. 44
3.2: Three Dimensional Reconstruction of Particle Structures………..….. 51
CHAPTER 4: DISCUSSION & CONCLUSIONS………..……… 58
4.1: Discussion………... 59
4.2: Conclusions………... 62
CHAPTER 5: SUGGESTIONS FOR FUTURE RESEARCH………..…….. 64
REFERENCES………..……... 68
viii
LIST OF FIGURES
Chapter 1:
Figure 1.1: P rocess -St ructure-P ropert y rel ations hip ……… …….. …... 3
Figu re 1.2: Illustrati on of t he Poi nt Spread Functi on pheno m enon…….. 7
Figu re 1.3: C LSM i mage of p arti cl es m arked b y circl es using imfindcircles
in Matlab……….………. 8
Figu re 1.4: Il lust ration of sti ck y p arti cle and non -sti ck y p article scenarios. ……… ……… …. 1 6
Figu re 1.5: Cont act s cenari o bet ween t wo parti cles wit h an angle of contact = θ……….… 17
Chapter 2:
Figu re 2.1: Sampl e s etup for im agi ng under t he C onfocal Mi croscop y … 29
Figu re 2. 2: C LSM i mage of an area covered with toner parti cl es … ….… 31
Figu re 2.3 : Illust rati on of di git al sampl e s lici ng of XYZ s can mode along Z-axis using C LSM ………. 33
Figu re 2.4: C LSM i mage where a parti cle is s el ected as t he parti cle of interest……… .... ……… 3 5
Figu re 2.5: C LSM i mage - anal ysi s to obtain the Z -position for the p arti cl e of i nt erest ……… ………...………. 3 6
Figu re 2. 6: Z position and radi us anal ys is using fram e -count ing m ethod.
………..… ……. 37
Figu re 2. 7: C LSM i mage showing coordinat es & radius of t he parti cl e of interest……… .…… ……… 38
Figu re 2. 8: Flowchart for a three -st epped process t o obtai n the parti cl e coordi nates and radi i ……… . ………… . 40
Figu re 2.9: Particle counting for packing fraction analysis……… 41
Chapter 3:
Figu re 3. 1: Siz e di st ribution chart of the toner parti cl es from C LS M …. 45
Figu re 3. 2: Normalit y t est for C LSM dat a……… 45
Figu re 3. 3: Siz e di st ribution chart of the toner parti cl es from SEM …… 46
ix
Figu re 3.5: 95% Confidence Int erval Mean Compari son for t wo s ampl e t -test compari ng C LS M and S EM dat a……… 4 8
Figu re 3 .6 : Sam pl e wis e box plot of part icl e radi us dis tri buti on… …….. 50
Figu re 3. 7: ANOVA results for the C LSM sam pl es.……… … 51
Figu re 3.8: Reconst ruction of a parti cl e volum e cel l usi ng Matl ab and Rhino 3D ……… …….. 53
Figu re 3.9: Number of parti cl es per l a yer of Fi gure 3. 8……… . 54
Figu re 3.10: C orrelation of t he packi ng fraction of the s ampl es to the m e an parti cle radius of each s ampl e ……… … ………… .. 56
LIST OF TABLES
Chapter 3:
Table 3.1: Li st of the XYZ coordinates and Radii of the parti cl es in Fi gure 3.1……… .……… 52
2
Conventi onal met hods of m anufacturing b y m elti ng and cas ting of
mat eri al s is sl owl y being repl aced b y the use of mi cron siz ed parti cles [2
-6] due t o t he reducti on i n the wast age of mat eri al s and bett er control over
the m anufacturing process es [2-6]. Industri al appli cations using particles
incl ude process es like coati ng, el ect rost ati c pri ntin g and addit ive
manufacturing, and t he mat eri als used i n these appli cations are governed
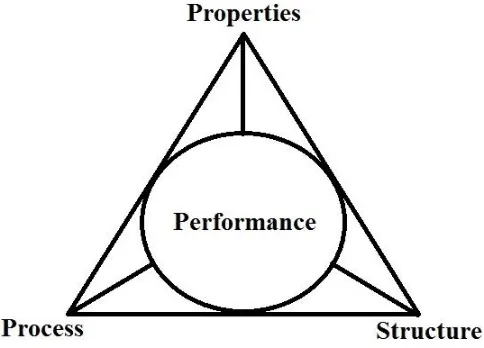
b y the P rocess -St ruct ure -Propert y rel ationshi p. The t erm ‘Process ’
t ypi cal l y refers to the set of procedures followed, includi ng ph ys ical
conditions and m at erials us ed for the m anufacturing of an obj ect i n an
indus tri al s cal e. Fol lowing t he predefi ned process resul ts i n a s peci fi c
‘Structure’ (the microstructure) of the manufactured object. The
microst ructure pla ys an important rol e in the det ermination of the
mechanical ‘Properties’ of the object. ‘Performance’ refers to the
conditions of operat ing the manufact ured obj ect based on it s m echani cal
properti es . As shown in Fi gure 1.1, t he manufacturing process us ed, t he
t ype of st ructure ob t ained and t he properties of the st ructure i nfluence the
perform ance of thes e powder structures . In theor y, t he material and the
process us ed for manufacturing the obj ect det erm ine t he st ructural
3
Figure 1.1 – Process-Structure-Property relationship in an industrial scale manufacturing process. The process used for manufacturing an object plays an important role in the microstructure of the object, which influences the properties of the object. The properties of the object determine the performance limitations of the object in specific scenarios.
For t he det ermi nati on of t he materi al propert ies of an obj ect
manufactured usi ng powder particles , it is necess ar y to underst and t he
struct ural arrangem ent of the parti cles i n t angibl e obj ects , and com pare
thes e arrangem ent wi th s imul ations to ass ess the accurac y of t he sim ulation
predi ction of the st ruct ural characterist i cs . The st ruct ural arrangem ent is
ver y im portant for t he det erminati on of the properti es of the obj ec t that
incl ude t ensile st rength and creep resist ance. A change in the manufacturing
process could produce an unfavorabl e mi crost ruct ure that can l ead to poor
mechani cal properties that cause the obj ect to fail , provi ng detrim ent al for
the performance of th e obj ect. Thus , the P rocess -St ruct ure-P ropert y
rel ati ons hip governs the m at erial performance of t he obj ect. P rocess
paramet ers like tem perat ure, pressure and other operating condi tions can be
tuned through modeling and simulat ions and then vali dated throug h
4
t ypi cal s teelm aki ng process, different process paramet ers like the ratio of
iron and carbon us ed, us e of addi tives, t emperat ure, press ure and cooli ng
rat e can be si mul at ed and m odele d to obtain various t ypes of st eels to be
used in a range of applicati ons . Thus, sim ulati ons pl a y a m ajor rol e i n t he
devel opm ent and m anufacturing of obj ect s on an indus tri al scale.
Part icl e st ructures are form ed b y inter -parti cl e forces that are
responsibl e for holding the parti cles together. When desi gni ng a
manufacturing process i nvolving m icros copic granul ar mat eri als,
simul ations can be perform ed for different s cenari os [1, 7-17] to develop
the ri ght arrangem ent of the part icl e st ructure with the ri ght properti es for
the m anufactured struct ure. For exam pl e, the creat ion of a printed ci rcuit
using met all ic nanoparti cles can be sim ulat ed usi ng complex al gorithm s
that account for all i nter -parti cular cont act possibiliti es under the infl uence
of external forces on the parti cl es [18-22]. Th e si mul ation provides an
insi ght on t he part icl e arrangem ent in the printed circuit b y det erm ining t he
unknown param et ers like parti cl e positioning, parti cl e cont act scenario and
contact forces bet ween parti cl es for t he experim ent al verificati on of
ph ysi cal process es [20-22]. This provi des a basis for the development of
the ri ght processing fact ors like particl e depositi on rat e, area of depos ition
and the poros it y of t he deposited parti cl es, whi ch pl a y a m ajor rol e i n t he
det ermination of t he conduct ance of the pri nted ci rcuit [18 -22].
Furthermore, t his hel ps to provide t he i nsi ght requi red to desi gn
5
hel p det ermine thes e experim ent al factors, the y need not necess ari l y match
up t o t he experimental results or provide the ultim at e answer to the
experim ent perform ed. Thereb y, p ost complet ion of the deposition, it is
desi rabl e to anal yz e and underst and the ph ysi cal structure of t he deposit ed
parti cles for com pari son with the simul ati ons performed .
In li ght of this, a n experim ent al proces s is necess ar y t o obt ai n the
parti cle packing dens it y in a dense particl e st ruct ure for recons truction and
com paris on wit h particl e simul ati ons. Th e met hod ology in thi s st ud y was
desi gned for comparison wit h the p acking fraction result s for parti cl e
simul ations b y performi ng meas urem ent s of parti cl e positions i n t hree
-dimensional s pace. Measurements of the X, Y and Z posi tions of the
parti cles and calcul ation of their radii hel ped to det erm ine the packi ng
fraction of the structures. The calculation of packing fraction help ed to
det ermine t he struct ural arrangem ent of the part icl es in t he object . B y
det ermini ng the mi crost ructure of t he object , a relat ionship to t he
mechani cal properti es of the obj ect can be obt ained, as m ent i oned earli er.
Thus , t hrough the packi ng fracti on cal cul ations, it i s possi bl e to det ermine
the m echani cal propert ies rel at ed to t he struct ure of the products creat ed
b y using powder part icl es t hrough additive m anufacturing.
1.1: Th eoreti cal Ba ckground
This thesis utiliz es the Fluores cence mode of s canning for the
charact eriz ation of the powder parti cl es , since the parti cl es used are
6
the M ethodol ogy s ection . The C LSM us es Arg on, Argon Kr ypt on, Heli um
-Neon gas l asers to generate li ght in t he wavel ength range of 352 nm t o 633
nm. In t he fl uorescence mode used for C LSM imaging , li ght of a parti cul ar
wavel ength produced usi ng gas l asers i s focus ed on t he particl es, which
tri ggers the excit ati on of valence elect rons in t he fluores cent mat erials
inside the parti cl es [ 23]. The el ectrons quickl y get de -excit ed t o the ground
stat e, em itting phot ons i n a range of wavel engt hs i n t he li ght s pect rum .
These emissi on phot ons are det ect ed and converted into di git al s i gnals to
generate the i mage. Simil arl y, the refl ective m ode [24] works on t he
princi ple of refl ect i on of li ght from t he s ampl es . R eflect i ve mode is
parti cul arl y us eful when t he sampl e us ed in imaging is not fl uores cent i n
nat ure. Since the s am ple parti cl es were fluores cent i n t his stud y, t he C LSM
was im aged in t he XYZ scan mode usi ng fluores cence technique.
Li ke an y opti cal mi croscop y t echni que, t he C LSM suffers from the
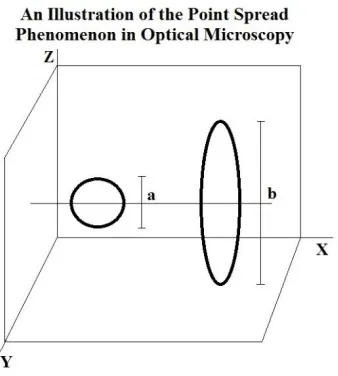
Point Spread Function (PS F) [20-22] along t he Z-axis or XY plane of s can.
An ill ust rati on of thi s phenom enon i n the Z-axis is shown in Fi gure 1.2. In
this phenom enon, a circular obj ect in fi gure 1.2 occup ying ‘a ’ number of
fram es in t he Z axis of the s can is depi ct ed occup ying ‘ b’ num ber of Z-axis
fram es in the im agi ng, where b > a. Al though the cent roi d of the obj ect
rem ai ns the s am e [25] , the obj ect appears to be el ongat ed or stret ched onl y
7
Figure 1.2: An illustration of the point spread function in optical microscopy. In this figure, a circular object occupying ‘a’ frames in the Z-axis is shown to occupy ‘b’ number of frames, where b > a.
In this stud y, the Z-axis PSF is neglect ed with an ass umpti on t hat the
parti cles are spheri cal wi th a radi us equal to t he XY pl ane radi us of the
parti cles for 3-dim ensional reconstructi on purposes. The part icle radi us i n
the XY pl ane was considered as the C LS M at R IT offered PS F correction
in the XY imaging plane. However, when obt aini ng a 360̊ 3-di mensional
proj ection of t he sample imaged in the C LS M , t he Lei ca SP -5 C LSM is
provided with an im agi ng software suit e, which has deconvol ution fact ors
built i nto the s oft ware for point -spread correction in the XY pl ane .
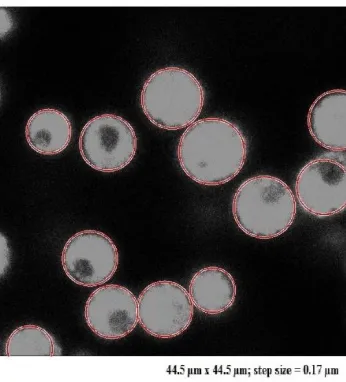
The im ages obt ained in t his research from the C LS M were anal yz ed
using the imfi ndcir cl es funct ion in M atl ab . This function is a shape
-det ecting al gorithm bas ed on the ‘Ci rcul ar Hough Transform ’ al gorithm .
The Hough Trans form al gori thm is a comput ational al gorithm whi ch can
det ect lines or ci rcl es in an im age [28] . This al gorithm converts gra y -s cal e
[image:17.612.244.413.74.262.2]8
circl es using p att ern recogniti on [28] . Th e imfindci rcl es functi on can detect
circular obj ects i n an im age and provi de the size of the obj ects i n pix el
measurements. Fi gu re 1. 3 illust rat es the det ection of t he ci rcular part icl es
from a parti cl e image fram e usi ng imfi ndcircles, where al l the parti cles
pres ent in t he im age were outlined wi th a circl e.
Figure 1.3 – Confocal image of particles analyzed using
imfindcircles in Matlab. All the particles (bright circular discs) in the image are marked by a circle using the imfindcircles function.
The imfindcir cl es function uses three paramet ers [29] ; Obj ectP olarit y,
Sensi tivit y and EdgeThreshol d. ObjectP olarit y indi cat es t he color contras t
of the ci rcul ar objects to the background. The default set ting is ‘bri ght ’,
where the objects are bri ghter than t he background in the im age . Sens itivit y
is a param et er i n the range of [0, 1], wit h a default value of 0.85. As the
Sensi tivit y val ue i s increased, the functi on detects m ore ci rcular obj ects,
incl uding partial and weak ci r cles. A very hi gh Sensiti vit y value (>0.95)
runs a ri sk of fals e detecti on of parti cl es and must be avoided. The
[image:18.612.238.411.225.416.2]9
edge pixels of a ci rcular obj ect i n an image. It is s et in a range o f [0, 1],
where a s etti ng of 0 det ect s more circular obj ect s with both weak and st rong
edge and a s etti ng of 1 det ect s fewer ci rcul ar obj ects wit h onl y s trong edges .
The out put for t he functi on is a mat rix in the form at [centers , radii], where
the cent ers and radii val ues are i n t erms of pixels.
Using this t heoreti cal knowl edge, the res earcher has devel oped a
conveni ent m ethod for the anal ysi s of part icl e st ructures in thi s stud y,
where t he C LSM in fluores cence mode was used for im agi ng the cl ust ered
struct ures of particles and Mat lab was used in proces sing the C LS M im ages .
The res earcher began b y exploring the struct ural requi rem ents of deposi ted
powders in t he electrophotographic indus tr y and met rology usi ng
simul ations , where multipl e parti cl e depositi on s cenarios and param et ers
were consi dered in sim ulating parti cl e st ructures . Since the particle
depositi on t echni que used in this research was simi lar to R andom Ballisti c
Deposit ion (R BD) s imulation due to it s simpl e nature , the res earcher
perform ed a det ai l ed anal ys is of R BD , incl uding the vari ati ons in R BD
simul ations . The res earcher subsequent l y explored the pri or experim ent al
imagi ng t echni ques used for t he stud y of parti cl e st ructures as a foll ow up
for the simulat ions. Thes e t echni ques incl uded S canni n g El ectron
Micros cop y (SEM), Confocal Las er Scanning Mi croscop y (C LS M) and X
ra y Mi crotom ography (X ra y μCT). A struct ural phenom enon of s elf
-similarit y obs erved i n parti cl e arrangement was explored in relation to the
10
1.2: Overvi ew of Previ ously Publish ed Literatu re
The packing den sit y of parti cl e s truct ures has been demonstrat ed to
affect t he propert ies of im ages in el ect rophotographic pri nting [1, 25] . The
use of a l ow toner particl e densit y in printi ng result s in a poor qualit y im age
of l ow resoluti on , while having a hi gh t oner parti cl e densit y result s in a
smudging and t hereby bad qualit y of the image [30] . To print an im age of
optimum resoluti on and hi gh qualit y, it is necess ar y t o deci de the ri ght
amount and m ix of t oner deposit ed on the subst rat e [26 -28]. Simulat ions
hel ped det ermine the exact am ount of t oner neces sar y and the charging
requi red on t he substrat e to generat e t his hi gh -res oluti on image. Thus,
simul ations of packed parti cl e st ruct ures have been perform ed for mul tipl e
scenarios [1, 7, 8, 10 -12, 14-16, 25, 29-43] for packi ng densit y calculations
for the i mprovem ent of print qualit y in t erms of the arrangem ent of part icl es .
These s cenarios incl ude the m ethod us ed to deposit the parti cl es [1, 7, 8,
11, 14, 25, 29, 30, 3 5-39], t he t ypes of part icl es used [1, 7, 11, 25, 38] , t he
sizing of t he parti cl es [34-36, 42, 43] and the influence of ext ernal forces
on t he particles duri ng depositi o n [1, 7, 8, 30] . The s imul ations have been
used to predi ct t he packing densit y or the packing fract ion of the resulting
struct ures and thei r properti es of m echanical strength, hardnes s and fati gue
paramet ers [37] .
The si mul ations have been broadl y classi fi ed int o t wo main
categories based on the siz e dist ribution of the parti cl es used –
11
monodispers e s cenario, all parti cles in the s ampl e are as sumed to be
roughl y the s ame si ze [1, 12, 15, 32 -35, 42, 43] . In t he pol ydispers e
scenario, s ampl es are consi dered where t he particles are i n a bimodal [34,
42, 43] or Gaussi an di stributi on [33, 34, 36, 42 -44]. The parti cl e
distribut ion us ed affects the packi ng densit y of the s truct ures, obtained
from the simul ati on [1, 10, 12, 14, 15, 29, 32 -36, 42, 43] . Increasing
parti cle siz e had no effect on t he packi ng fracti on of t he parti cl e st ruct ure
obt ained from a m onodis perse parti cl e s imulation [1, 12, 14, 42] . It was
obs erved that the packi ng fraction was barel y influenced b y the parti cl e
size in an equal -size parti cl e dist ri buti on (monodi sperse) [34, 43] . For a
bimodal parti cl e dis t ribution, sim ulation using a l arge parti cl e siz e rati o
result ed in a l oos e packing st ructure, while a s mal l parti cle s ize rati o had
no si gni fi cant effect on t he packing fract ion of t he st ructure [34, 42, 43] .
In a Gaussi an parti cl e dis tri buti on, simul ation wit h a large r di am eter range
of parti cl es in the pol ydisperse mixture res ulted in a hi ghl y porous st ructure
(low packing fraction) and low part icl e coordi nation number [34, 43] as
opposed to a sim ulat ion wi th a sm all er diam et er range of particl es in the
pol ydispers e mixture . The simul ati on resul ts have al so been classi fi ed
bas ed on t he adhes i ve properti es of t he powders and the us e of external
forces to improve the packing densi t y of t he structures obtained [12, 15, 29,
32].
Anal yti call y, mi cron-siz e powder parti cl e st ructures have been
12
Dis cret e El em ent M ethod (DEM) [7, 9, 11, 40] . The R BD considers st ati c
conditions like parti cl e depos ition i n three dim e ns ions on a substrat e [1, 7,
11, 14, 29, 30, 39, 44, 45] , rolling of particl es or parti cl e rest ructuring [1,
7, 11, 25, 30] due t o the influence of external forces on the p arti cl es for
simul ation purpos es . Thus, R BD assum es man y situati ons observed in a
real -li fe deposi tion s cenari o of parti cl es on a subst rate us ed in this res earch
through simpl e al gorit hms [7, 9, 11, 40] . Simpl e mod els have been
devel oped for t he bet ter underst andi ng of proces ses li ke colloidal
sedi mentation, t hin -film deposition , diffusion process es and man y other
non -equili brium growth and aggregati on process es whos e scal ing propert ies
have not been completel y unde rst ood; using R BD. Dis cret e Element M ethod
(DEM ) is an ext ensi on of R BD in t erms of parti cle depos ition, but considers
simul ation d ynamics that are compl ex in t erm s of calculations [34, 42, 43] .
In DEM, the compl ex it y aris es as paramet ers li ke parti cle traj ector y,
parti cle cont act angle, coordination number and contact forces bet ween
parti cles are tracked d ynami call y [34, 42, 43] as com pared to RBD, whi ch
is a st ati c sim ulat ion scenario. DEM i s a cal cul ations -heavy s imul ation
process limit ed b y comput ational power of the si mul ation generator [34, 42,
43].
The concept of R BD was int roduced b y Vold [45] , whil e s im ulati ng
the form ati on of a s edim ent b y t he successi ve depositi on of equall y s ized
parti cles during the anal ysis of clust er formations . P articles were pl aced at
13
coordi nate onto a s ubstrat e [45] . For a cohesi on probabilit y of 50% (where
0 = no cohesion and 99 = cohesion probabilit y uni t y ), 69 parti cles of radius
10 units were dropped in a 100 x 100 x 120 uni ts volum e cell, whi ch yi elded
a packing dens it y of 19.9%. P aram et ers like packi ng densit y and m ean
contact number (coordinati on number of each parti cl e) were cal cul at ed for
different cohesi on probabi liti es and part icl e radi i. Thus, a bas e paradi gm
was creat ed for the exploration of R BD. In the past fi ve decades, R BD was
researched i n det ail and devel oped for vari ous t ypes of s cenari os in parti cl e
depositi on [1, 7, 11, 12, 15, 16, 25, 30, 31, 33, 34, 39 -41, 44, 45, 50 -53].
Some of the scenarios in the R BD sim ul at ions included :
The consi deration of adhesive particles for si mul ation , and the us e
of monodispers e and pol ydispers e part icl es to unders tand the effects
of sizing [51 -53] on the packing dens it y in sti ck y [16, 25, 32, 33]
and non-sti ck y s cenarios [10, 15, 33, 35, 36, 44, 45, 54] ; and
the int roduction of external forces for the rearrangem ent of the
parti cles i n the structures [1, 36] .
These s cenari os have been di scuss ed in detail here -
RBD b as ed on th e a dhesive p rop erties and sizin g of th e particles us ed:
In t he R BD s imul ati ons with cohesive powders [1, 25, 29, 31, 55] , it
is assumed t hat a cohesive parti cl e att aches where it cont acts another
cohesi ve parti cl e during the deposition process . Thi s cohesi veness or
14
maki ng powder st ructures whi ch res ult in t he colum nar growth of the
struct ure [1, 36] . J ullien et al . and M eaki n et al . extensivel y s tudi ed R BD
[7, 9-11, 30, 39 , 44, 45] , and proposed si mple models for R B D wi th st ick y
and non-sti ck y parti cl es [11] , R BD with restructuring [7], R BD at ob li que
inci dence [50] and R BD with pol ydispers e spheres effects on packi ng [49] .
Dependence of the width of the active depositi on zone (zone where t he
parti cles are deposit ed on the subst rat e) on t he m ean deposit thickness was
est abli shed b y J ull ien et al. [7], where the deposit thi ckness reduced with
increasing number of contacts (coordination number) for each depos ited
parti cle [7]. The dependence of m ean penetrati on depth (average change i n
the Z coordi nate of the parti cl e s between t he pos ition where the y fi rst
contact the deposit and t he posi tion where the y come t o rest at a local
minimum ) of parti cl es was obs erved to be linear on the pol ydispersit y of
the parti cl es [49] . P arti cles were deposit ed at vert ical i ncidence on oblique
surfaces , where the s u bst rates were at di fferent angl es (15˚, 30˚, 45˚, 60˚,
75˚ and 87.5˚) [50] and the step size in the upper surface of the deposits
increased with i ncreasing angle of inci dence [44, 50] .
Meakin et al. also report ed t hat parti cl e st ructure simul ati ons s howed
maximum parti cl e concentrati on near the s ubst rat e, with waning parti cl e
concent ration along the +1 direction (or the Z -axis ) of the parti cle
struct ures (rel ati ve t o the thi cknes s of the deposition) i n sti ck y and non
-stick y deposition s it uati ons [7, 11, 30, 39, 44, 45] . Zhou et al . [15] studied
15
parti cle size ratios . Zhou et al . [15] als o st udi ed the dependence of packing
densit y and coordination numb er on the X and Z direction box dimensi ons
for monodispers e parti cles i n a non -sti cky particle s cenari o. This stud y i s
rel at abl e to t he decision of the vol ume cell size to be considered for
experim ent al anal ys i s of m onodispers e and pol ydi sperse particle st ructures
[15] . R a y et al. [22] , M al et al. [52] and Banerj ee et al . [53] studi ed the
surface properti es , morphol ogi es and s caling behavior of parti cles of
var ying cohesi venes s using ballis tic deposition sim ulat ions. The growth
and evoluti on of t he surface was obt ai ned a gainst i ncreasing time [51 -53]
for var ying parti cl e cohesi on probabil it y.
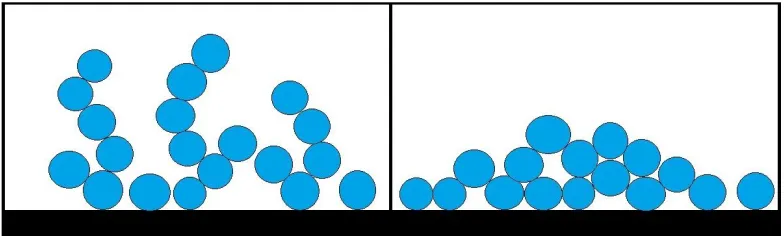
In th e s cenario of sti ck y parti cl es shown i n Fi gure 1. 4. A , the hi ghl y
cohesi ve parti cl es form hi ghl y porous s truct ures s uch as t hos e have b een
depict ed in references [1, 25, 29] . On t he contrar y, in the other extrem e
scenario of non -s ticky particl es shown i n Fi gure 1.4. B, where the parti cl es
have restructured under appli cation of ex ternal forces and rol l to posi tions
of equil ibriums with lower pot enti als as il lustrat ed i n references [1, 10, 15,
30, 32, 35, 36] . Thes e st ructures show lower porosit y becaus e of the hi gher
packi ng of the parti cles t hat i s due to t he parti cle rearrangem ent obs erved.
Thus , sti ck y particle struct ures show low packi ng fraction of 14.7% [1, 36] ,
whil e non -sti ck y part icl e struct ures show ver y hi gh packi ng fraction of 58%
[1, 15, 31] . Int erm ediat e st ructures t hat represent t hos e st ruct ures neit her
16
dependence on the contact angl e param et er and under the infl uence of
external forces on the parti cl es.
Figure 1.4 – Illustrations of A. Sticky Particle Scenario and B. Non-Sticky Particle Scenario. In the Sticky Particle Scenario, the falling particle sticks upon contact with a previously deposited particle and the critical angle of contact θc is 90˚. In the Non-Sticky
Particle Scenario, the falling particle rolls off the contacting particle until it reaches a stable equilibrium. For this scenario, the critical angle of contact θc is 0˚.
Influence of external forces on th e p arti cl es du ring RB D:
The packing fracti on from rest ruct uri ng of part icl es i s bas ed on the
angles of contact am ong parti cl es, where if the contacti ng parti cle is at a
contact angle great er t han the cri tical angl e of contact θc, wit h the
stati onar y parti cl e, t he cont acting p arti cle rolls over the surface of the
[image:26.612.129.521.136.254.2]17
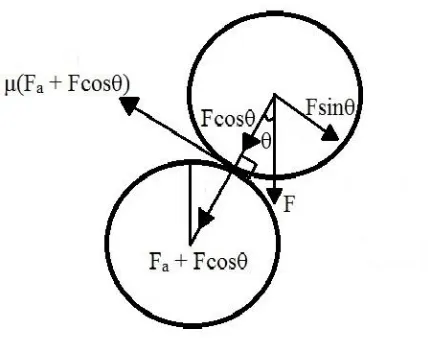
Figure 1.5 – Contact scenario between two particles with an angle of contact = θ under the influence of an external force F. When the sin component of the force exceeds the cohesive force between the two particles, the particle starts rolling on the surface of the stationary particle. (Adapted from Reference [1])
A falli ng parti cl e comes in contact wi th a previ ousl y deposit ed
parti cle at an angle θ. This angl e θ is the angle of contact bet ween t he t wo
parti cles. An ext ernal force F (el ect rost ati c or magneti c) acting on t he
fal ling parti cl e exerts a tangenti al force Fsinθ to initi at e rolling on t he
surface of the st ati onar y parti cl e t o reach a st abl e equilibrium posi tion.
However, t he parti cl e is prevent ed from rolli ng off the st ationar y parti cl e
through the force of fri cti on bet ween the two parti cl es μ(Fa+Fcosθ), whi ch
is a combi nation of the adhesive or cohesive force Fa and t he horizontal
com ponent of the external force Fcosθ, with the co -effi ci ent of fri cti on μ.
The point bal ance of thes e two forces res ults in a cri tical angl e of cont act
θc bet ween t he two part icl es. Mizes [1] s t udi ed the angle of contact am ong
parti cles i n a s cenari o of different cohesi ve force and the rel ations hip wit h
packi ng fract ion us i ng spherical parti cles for R BD simul ati ons. The
[image:27.612.234.451.85.254.2]18
com plet e restructuri ng of charged toner parti cles b y rolli ng of deposit ed
parti cles t o s table equilibrium positi ons [1]. To i niti ate rolli ng, the for ce
Fsinθ must be great er than the fri ctional force , where the angle of cont act
θ i s great er than θc. An abs ence of external force F i n this work caus es the
parti cles t o sti ck together under the force μ*Fa, creat ing a st ick y parti cle
scenario ( depicted earli er in Fi gure 1.4A ). However, in the R BD
simul ations for rest ruct uri ng scenario, part icl e rolling is facilitati ng for
different crit ical angles of contact θc b y var ying t he external force F [1],
with the extremes at 90˚ for sticky particle scenario and 0˚ for non -sticky
parti cle s cenari o .
In simul ati ons , s t ructures of powder parti cles have been inferred
through their packi ng fraction [1, 56, 57] , or the ratio of the vol ume
occupied b y parti cl es in a cell t o t he total vol um e of the cell [56, 58, 59] .
Thus , in R BD using sti ck y parti cl e s, cohesi ve part icl es hit -and -sti ck ,
resulti ng in a packing fraction of 14.7% [1, 36] . In the non -sti ck y s cenari o,
parti cles compl et el y restructure (or hit -and -roll ) res ult i ng i n a st ruct ural
packi ng fraction of ~ 58% [1, 15, 31] . This als o est ablis hes an invers e
rel ati ons hip bet w een the packing fraction of a parti cle st ructure and the
cri tical angl e of cont act θc [1], where t he packi ng fraction of t he struct ure
decreas es from 58% to 14.7% as the θc increases from 0˚ t o 90˚ . This
research expect s t he parti cle packi ng fraction to be around 14.7%, si nce the
parti cles in the experim ent have been est abli shed as cohesive particles [1,
19
Parti cl e I maging S tudies :
While simulati ons generate particle st ruct ures for di fferent scenarios,
the experim ent a l charact eriz ati on of mi croscopi c st ructures in the i nteri or
of a powder st ructure is diffi cult . Man y ph ys i cal charact erizati on
techni ques for parti cl e st ructures are unabl e to confi rm the act ual st ructural
vali dit y of t he R BD model for hit and s ti ck parti cl es, where t ent acle -li ke
col umnar arrangem ent of parti cl es is observed [1, 36] . This is due to the
fact that the y ei ther are l imit ed t o surface vi sualizat ions [3, 5, 29, 60, 61]
or have been perform e d for packed coll oidal s ys t ems where the s yst em us es
dilut ed s oluti ons wit h sus pended parti cl es [59, 62, 63] and res embles a non
-stick y parti cl e s cenario [59, 62, 63] .
Hi gh R es oluti on S canning El ectron Mi croscop y (SEM) im ag i ng h as
been the t echnique of choi ce to vi ew surface mi cros truct ures form ed b y
powders [34]. Bl um et al . imaged the surface of a n agglomerate cons isting
of Si O2 mi cro-parti cl es of an average diamet er of 1.5 µm using a Scanning
Elect ron M icroscope [34]. The agglom erat e was gravit ational l y deposi ted
using l ami nar st ream of gas i n an ex perim ent al s etup consisti ng of a
cogwheel deaggl om erat or in a pr es surized chamber [34] and a packing
densit y of 15% was cal cul at ed for t his agglom erat e . Unidi recti onal
com press ional pressure was appli ed on the aggl omerat e using a microm et er
stage connect ed t o a force t ransducer [34] . Packi ng densit y quant ifi cation
of t his agglom erate was cal culat ed as a rel ati onship of the unidi recti onal
20
in the aggl om erat e . This was perform ed through a power l aw relat ions hip
(rel ative change i n one quanti t y resul ts i n a proporti onal rel ati ve change i n
the ot her quantit y) bet ween t he compression and packing densi t y of the
agglom erat e, as t he parti cl es were subject to var yi ng unidi recti onal
com press ion for dens ifi cat ion purposes [34] . This st ructure was ass umed to
resem bl e an agglom erat e of stick y part icl es obt ained from simul ations
through packi ng fraction com parison [1, 34, 36] . Wit h i ncreasing
unidi rect ional compressi onal force (up to 105 P a), agglom erat e st ructures
of hi gher packing densi t y up to 33% were obt ained. Hi gh magnifi cation
two -dim ensional (2D) mi crographs from the SEM hi ghli ght ed the
amorphous nature of the parti cl e struc tures and voids on the surface and the
immediat e few l a yers of the powders. The parti cles appear to be st acked on
top of each ot her . However, it i s not possi ble to m ap i ndi vidual particles in
the int erior of the dense aggl omerat e using SEM im agi ng and the packing
fraction quant ifi cation d oes not neces saril y reflect the actual
microst ructures in t he int erior. Using S EM , it is not pos sibl e to image t he
parti cles in the l ower l a yers or i n the i nterior of the structure, t herefore
rendering the st ructure unquant i fi abl e for reconst ruction . Thus, it is
necess ar y t o have an imaging t echnique, whi ch can be us ed t o im age and
anal yz e parti cl es present beneath t he top -most la yer of the part icl e structure.
Confocal Las er Scanning Mi croscop y (C LSM) can be used in t his sit uati on.
Confocal Las er S canning Mi croscop y (C LS M) has been us ed for
21
s yst ems where parti cles are m ore close l y packed [63 -65]. Since the siz e of
coll oidal parti cl es optimall y li es near t he vi sibl e s pect rum of li ght, l as er
li ght s catt eri ng has been used for stud yi ng the d ynamics of coll oids [63] .
C LS M can be us ed t o resol ve mi cron -siz ed indivi dual colloi dal parti cles
due to the s am e reas on [63] . Al though lower in resolut ion and magnifi cation
in compari son t o the el ect ron m icroscop y methods as it is an opti cal
micros cop y t echni que , t he C LSM has depth selecti vit y due to a cont roll ed
and hi ghl y limit ed depth of focus, and is capabl e of im aging i nt eri or
struct ures for sampl es that are t ranslucent or fluores cent in nature [24] . The
C LS M has been us ed extens ivel y for col loidal s ys t ems [62 -65] for stud yi ng
coll oidal phas e t rans itions [62 -64] and reconstruction of parti cl e st ruct ures
[65] .
Man y st udi es on colloidal s ys t ems have focus ed on mi cron-siz ed
parti cles [62 -65]. Dinsmore et al . dem onst ration that t wo -dimensional
tracking of parti cles was possi bl e when the 1.2 μm di am et er Pol y-M et h yl
Methacr yl at e (P MM A) parti cl es were suspended i n the colloidal sol ution
and in constant mot ion [62] . Howeve r, parti cles were tracked i n three
-dimensions upon aggregation (caused b y addition of pol ys t yre ne pol ym ers
to t he coll oid) , which sl owed the particl es adequat el y to m ake provi sions
for a ful l three -dim ensional scan using t he C LSM [62] . To avoid los s of
resolution, a sol vent matching the refractive index of the part icl es was
chosen for the col loi d preparation to faci litat e s canning of m ore than 100
22
tracking colloidal parti cles using C LS M [62, 63, 65, 66] . Bes seli ng et al .
used a t hree-dim ens ional rod -fitting al gorit hm for t racking rod -shaped
coll oidal sil ica parti cl es [66] . St andard micros cop y gl a s s sli des and cover
slips were us ed for sampl e preparati on with an 85% gl ycerol in water
solvent to correct t he three -dim ensional dist ort ion of im ages [66] . The
parti cles were coat ed with non -fluorescent out er s hell to avoid overl apping
of the fluores cent si gnals of t he parti cl es for bett er resol ution of indi vidual
parti cles [66].
Prasad et al. [63] imaged colloidal parti cl es consi sti ng of
monodispers e PMM A of diamet er 2 μ m through C LSM. Pixel b y pixel
reconst ruction images of m ultiple t wo -dimensional plane s cans of t he
sample was performed over a depth of 30 μm to 50 μm , scanni ng around 15
to 25 l a yers of t he close packed part icl es [63] . S ubs equent combination of
thes e images gave a t hree-dim ensi onal reconst ructi on of the parti cl e
struct ure. This t hree-dimensional capabi li t y is one of the i nbuil t advantages
of the C LS M over El ectron Mi cros cop y t echniques . Alt hough P rasad et al.’s
reconst ruction cannot be used t o quanti fy ever y part icl e indi viduall y; t he
images of the vari able depth s canning of t he particl e structure provide
means for quant i fi cat ion of parti cl e pos iti ons in the colloidal s olution . The
parti cle t racki ng i n real s pace wit h the C LSM als o provides an
unprecedent ed level of i nform ati on on nucleati on [18, 66] and phas e
transiti ons [62, 63, 66] , based on the arrangem ent of parti cl es in dens e
23
Although C LSM im agi ng is l imit ed to fluores cent parti cl e s in
powders or coll oids , st ructures consi sting of fluores cent and
non-fluores cent (met all ic and non -m et alli c) powders and colloi ds have been
visualized using X -ra y Micro -comput ed tomog raph y (μC T) [68-82]. This
method has been used i n Additive M anufacturing for non-dest ructi ve
imagi ng and reconst ructi on of parti cl e s ys tems through s ys t em ati c s canni ng
of t he s ampl e [75, 77, 78, 81, 82] . The X -ra y μC T captures st acks of i mages
and di gi tal l y com bine the i mages to reconstruct the obj ect , li ke t he C LSM
[68-73, 75, 77 -82], but using X -ra ys in place of lasers for s canni ng t he
samples. Thus , this t echni que has a bett er res oluti on com pared to optical
micros cop y, reachi ng up t o 50 nm using hi gh -res oluti on zone pl at e l ens es
[81] . The obj ect to be scanned i s pl aced on a rotatable disc and s canned at
planar rot ati on -bas ed angul ar increm ents for incrementing thi rd dim ens ion
to scan t he s am pl es [68-71, 79, 82] to obt ain a multi -axial vol umet ri c s can .
X-ra y μC T has been used to stud y gr anular m at erials , focus ed
prim aril y on obt aini ng the represent ative di stri buti ons of local void rati os
of porous m edia, evolution of the voi d rat io, localized deformations of
coll oidal and granular m ateri als [72, 73, 77, 78] and ex traction of
ph ysi call y reali sti c pore net work st ruct ure of porous m edi a [75, 76] .
Addit ionall y, X -ra y μCT has been used for dens it y cal culati ons of m et alli c
obj ect s and non m etalli c powder s ampl es [78] and quant it ative t hree
-dimensional charact eriz ation of bone i mplants [79] ; provi ding a diverse
24
samples is poss ibl e through th is m ethod [77] , where particle dist ribution
contours can be obt ained using X -ra y μC T for det ail ed anal ys is of parti cl e
distribut ion on the s ubst rate.
Self -Si milari ty in Parti cle Stru ctu res:
Part icl e structures are known t o exhibit fractal -li ke s elf -sim ilar units
duri ng aggregati on [32, 47, 55, 83 -89], where parts of the s tructure are
struct urall y simil ar t o the whol e structure , but m uch sm all er in siz e . The
parti cle arrangem ent shows simi lar fractal -li ke patt erns at different
magnifi cations of t he parti cl e st ructure. Kranenburg [82] obs erved t hat s elf
-similarit y for cl ust ers of par ti cl es im pli ed that a unique rel ationship exist ed
bet ween aggregat e si ze and t he number of pri mar y parti cl es t hat form the
aggregat e. Lesz cz ynski [89] s imul at ed particle contact s cenari os for
cohesi ve parti cles t o obt ain a model of generaliz ed vis coel asti ci t y operating
on fract al s urfaces . Gil abert et al . [85] observed t hat aggregat ion process es
were well known t o produce fract al s tructures, and that fract al -like
net works cont ai ned denser regi ons and l arger caviti es. The y also obs erved
fract al-l ike regim es were observed in very -low -densi t y s ampl es [85] . Di rect
measurements of the cohesi ve parti cle aggregate st ructures were carri ed out
using t he m ethod of li ght scattering b y dilute s uspensions [83, 84] and x
-ra y s catt ering [83] on sili ca cl ust ers of part icl e siz e ≈ 27 Å by S chaefer et
al. [83], where fract al nat ure was observed i n the clust ers of sizes 500Å to
25
1.3: Research Di rections
The obj ective of thi s research was t o identif y micron -sized part icl e
positi ons i n real space and produce a three -dimensional reconstruction of
the parti cl e st ructure . To do thi s work, i t was neces sar y t o have an accurat e
procedure t o obt ain the radii and coordi nat es of all parti cl es in a parti cl e
struct ure for packi ng densi t y calcul ations . A quantit ative approach was
used in this thesis for the const ruction of thes e granul ar parti cle st ruct ures
and for packing fraction cal cul ations . Unlike previous particl e anal ys is
using C LS M for st udyi ng colloi dal phases and t rans itions [62 -64, 66] , this
work was focused on i ndividual part icle quanti fi cation to obt ai n the
coordi nates and s izes of t he parti cl es for reconstruction purpos es. As
opposed t o t he coll oi dal di spersion of particl es for C LS M im agi ng [62, 63,
65, 66] , powder part icl es were used i n t his research for part icl e t racking
using C LSM . The s ample part icl es used i n thi s res earch were stati onar y due
to thei r powder nat ure, unli ke colloidal dispersi on of part i cl es i n pri or
research techniques using C LS M, which experi enced Browni an motion [59,
62, 63, 65, 66] .
In this thesis , pol ydi sperse t oner powder was used for im aging under
the C LS M due t o t he fl uorescent nat ure of t oner com ponent s . The parti cl es
are bi gger i n siz e compared to t he part icl es t hat were us ed in previous
C LS M parti cle stud i es [62, 63, 65, 66] . The C LS M i n the Fluores cence
mode was used to identi f y the centroids of part icl es i n a vol ume st ack of
26
parti cle st ruct ures t hree -dimensionall y b y obtai ning the coordi nates and
sizes of i ndivi dual parti cles and quanti f y the packi ng fraction of the
struct ures. M atl ab was us ed for t he im age proces sing t o obt ai n the parti cle
cent roids and sizes.
The st ud y use d the resulting p arti cl e posi t ions and radii t o reproduce
a three -dim ensional represent ation of the struct ure formed b y t he parti cl es.
Compari son of the resul ting packing fraction values wit h the sim ul ation
results calcul ated previousl y in independent res earch [1, 31, 55] will reveal
the nature of the particl es used in this work . The framework used in this
thes is can be ext ended to det ermine the st ructures of t he granular parti cl es
withi n a given volum e. This will be us ed t o st ud y t he s el f-simil ar nat ure of
parti cle cl ust ers in cohesive powder st ructures. This work can lead t o the
det ermination of parti cle cont act paramet ers like coordination number
(num ber of parti cles a given parti cl e is i n contact with ), cont act area and
28
In this chapt er, the t opi cs of sampl e preparati on, i maging of s ampl es
with the C LSM, anal ys is of the C LSM im ages obt ained us ing Matl ab, and
the calculation of the packing fracti on of the structures anal yz ed will be
explai ned.
2.1: Sampl e Preparation
Emulsi on Aggregati on (EA) process ed Elect rophotographi c (EP)
Yel low toner from a las er print er cart ridge was us ed to creat e the sam pl es
for anal ysi s . The toner consi sts of num erous sub -parti cl es i ncl uding the i nk
pi gm ents enclos ed wi thin t he pol ym er shel l. Thes e pi gm ents are fluores cent
in nature and appropriate for use in the C LS M. A bi g challenge with usi ng
toner is t hat i t cont aminat es t he s urfaces b y adheri ng to the surface upon
contact. Hen ce, a m ethod was devised t o s eal the toner particl es whi le
ret ai ning t he parti cl e st ructures. For this experim ent , t oner from different
cart ridges was used t o create ni ne sampl es for im agi ng under t he Confocal
Micros cope to maint ain sampl e diversit y .
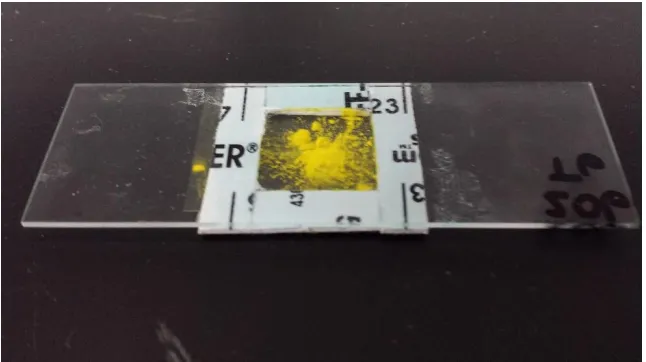
A cov er sli p and a m icros cop y sl ide were used to create the s amples.
Cover sli ps were not us ed on top and bot tom t o prevent speci men loading
com pati bilit y is sues with the C LS M. Using doubl e-sided tape, an en cl osure
was creat ed on a mi cros cop y cover slip . The to ner part icl es were dropped
on a clean cover slip in t he absence of an external fi eld . The cover sli p was
used as a bas e to im prove t he im age qual it y since t he sam pl e is expos ed to
more l i ght with a thinner cover sli p as compared to a thicker gl ass sli de.
29
cover sli p, without disturbi ng the t oner. Thus , th e powder part icl es were
drop-deposi ted, sandwiched bet ween mi cros cop y gl ass slide and a cover
slip and s ealed as shown in Fi gure 2.1 .
Figure 2.1 – Sample setup. Sample is prepared by encasing toner particles within a sealed setup using microscopy glass slide, cover slip and double-sided tape. The encasing prevents the smudging of toner to preserve the structures formed by the toner.
This arrangem ent was us ed for two reas ons: (1) generati on of thick
but im age -abl e part icl e struct ures and (2) C LS M calls for transparent
subst rat es for the t ransm issi on of li ght. Trans parenci es were not used as
subst rat es for s ampl e preparation t o avoid th e scatt ering of l as er beams and
subs equent blurring of im ages , as the y c onsist of feat ures which do not
transmit li ght as wel l as gl ass [91] .
2.2: I maging Meth odology
The Confocal Las er Scann i ng Mi cros cope (C LSM ) at the C ol lege of
Sci ence, R ochester Insti tut e of Technol ogy , was us ed for imagi ng the
[image:39.612.165.488.164.345.2]30
micros cope with a reduced out -o f-focus blur functi on. The s ys tem us ed for
imagi ng has a lat eral pixel size of approximat el y 48 nm × 48 nm with a Z
-axis s ampli ng s tep of 0.17 µm. The C LSM was im aged wit h a 40x objecti ve
(num eri cal aperture = 1.1) and water as the refractive m edi um on the
obj ecti ve l ens of the C LS M. The mi cros cope ha s a hi gh effi ci enc y s pect ral
photomet r y/ spectrophotom et er det ector which us es fi ve channels
simult aneousl y that deli ver bri ght , nois e -free im ages wit h m inimal photo
dam age at hi gh speed in two different modes – Fl uorescence m ode and
Reflecti ve mode. The s ampl e was im aged in the fluores cence mode wit h an
excit ation wavel engt h of 465 nm , generat ed from an Argon Las er. The
photon emis sions from the fluorescence were coll ect ed in the range of 476
nm to 610 nm wavel engths.
The two-dim ensi onal planar C LSM im age s in t he fluores cence mode
consist ed of bri ght fluoresci ng parti cles in a dark background. The dark
background was obs erved due to t he abs ence of t he fluores ci ng parti cl es
and was the porous space among the parti cles. The bri ghtnes s of the
parti cles was adjust ed using the fluorescence int ensi t y s cal e in the imaging
soft ware. The s can mode was set t o XYZ t o obt ain mul tipl e XY im ages at
predet ermi ned Z i ncrem ents . The XYZ scan mode di gitall y s pli t the s am ple
specim en into di fferent l a yers along t he Z -direction (based on a param eter
called st ep -siz e) . It t hen obt ai ned the fluorescence im age for each l a yer and
stitche d all t he im ages t ogether int o a 3 -dimensional bl ock i mage i n the
31
Planar i maging areas consisti ng of mult ip le parti cl e cl ust ers were
identified, wit hin which indivi dual sam pling areas consist i ng of sm all
parti cle cl ust ers were magni fi ed and st acks of XY im ages were col lect ed .
Since the s am ple was drop -deposit ed, t he parti cl e densi t y was not uniform
across the s ampl e, and t he cl ust ers wit h low number of parti cles were
chosen for im aging to avoid im aging i ssues due to the at tenuati on of
fluores cence si gnals from ver y dens e part icl e agglom erat es . Thus, the
imagi ng areas were predetermined b y the researcher based on t he visi bilit y
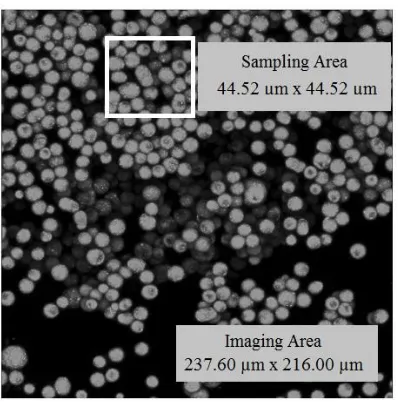
of all parti cles i n t he cl ust ers . Fi gure 2.2 shows a large sampl e image area
of t he dim ensions 237.60 µm b y 216.00 µ m , consi sting of m ult iple parti cl e
[image:41.612.222.421.394.597.2]clus ters .
32
A closer observati on of Fi gure 2.2 shows the particles i n t he
foreground appear to be clearer and bri ghter than the other particl es in t he
background. This was because t he cl earl y obs erved particles are clos er t o
the phot omult ipli er det ector of the C LS M and have no obst acles in t he
imagi ng pat h as the y were at the base of the s ampl e. S mal ler s ampling areas
were s el ected as regions of int erest for anal ys is from t he bi gger cl ust ers
obs erved (li ke t he one shown in Fi gure 2.2). This s ele cti on was ent irel y
bas ed off the visi bili t y of t he particles in the im aged clust ers . A sam pling
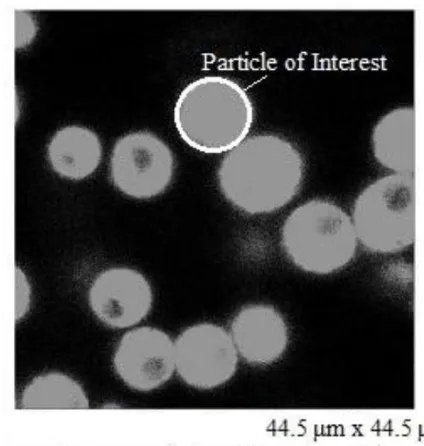
area of 44.52μm by 44.52μm was selected to image the particle cluster in
this i maging area, roughl y to sim ul ate a 600 dots per inch printi ng
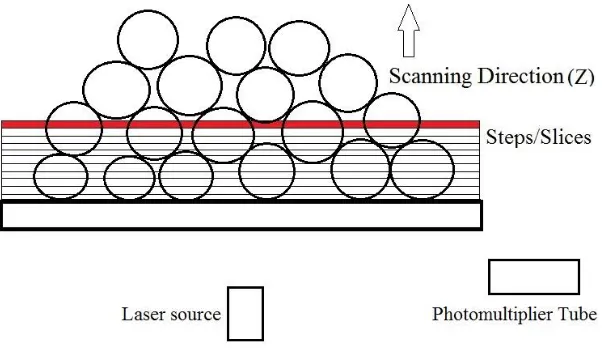
address abi lit y [ 91]. In th e XYZ scan m ode used i n t he experi ment , the
sample was divided i nto m ultipl e st eps and s canned st ep -b y-st ep from the
bas e to the top. An example of the Z -st ep s canni ng for a part i cl e st ructure
is s hown in Fi gure 2.3. The st ep t hickness was s et to 0.17 μm along t he
verti cal axis or the Z -axis of t he sam ple and the s ampl e wa s scanned
continuousl y from the base to top at a st epping rat e of 0.17 µm usi n g the
sensitive st epping m otor. This was bas ed on the obs ervat ion t hat the parti cl e
densit y wa s t he hi ghest at the base of t he sample (cover s lip) and decreased
with i ncreasing Z height. C LSM XY pl anar i mages numbering from 100 t o
300 were obtai ned for each st ack, stored in J -peg form at and convert ed to
33
Figure 2.3 – Illustration of the digital sample slicing along the Z-axis in the XYZ scan mode of the CLSM. The structure was digitally sliced into multiple steps, where each step thickness is equal to the step size set in the CLSM. The sample was imaged in the XY plane at every Z step. The scanning direction was from bottom to top, where the layer marked in red shows the current step being scanned.
Multipl e im ages obt ained at t his Z step increment were s tacked
together to cov er the ent ire sam pl e thi ckness . Z-depth range was based on
the number of la yers obs erved during the imagi ng of the parti cl e cl ust ers .
The number of l a yers was limi ted t o four t o six la yers , as the us e of powder
parti cles for s ampl e preparati on would l ead to di stortion of i mages due to
diffra ction of fluores cence emissi ons. Thi s was unli ke the previous
literature on C LSM i magi ng [62, 63, 65, 66] , where coll oidal part icl es were
dispersed i n a solvent of t he s am e refracti ve index as the parti cles to enab l e
scanni ng of multi pl e l a yers of parti cl es. Ni ne s ampli ng volum es (from
specim ens creat ed us ing toner from di fferent cart ridges ) were sel ected on
34
For qualit ative anal ysis of the parti cl e st ruct ures, t he sampl e i mages
scanned were convert ed int o a three -dim ensional frame -b y-fram e projecti on
using the soft ware s uite provided for the C LSM. This three -dim ensional
proj ection provi de d an overvi ew of t he st ructural arrangement of the
parti cle s that facilit at ed the observati on of parti cl e l a yeri ng withi n the
struct ure. This process was repeat ed for all our s ampl es for qualit ative
anal ys is purpos es as this hel ped det erm ine the number of l a ye rs pres ent i n
each particle clust er that was imaged .
2.3: I ma ge Analysi s
The part icl es from t he sm all er s ampli ng area of 44.52 µ m * 44.52 µm
in Fi gure 2.3 were considered for the im age anal ys is . The s ampling area
was magni fi ed to show the parti cl es at a parti cul ar Z-axis val ue inside the
struct ure. S ee Fi gure 2.4 fo r this represent ati on. The im ages s how the
parti cles cl earl y as bri ght, roughl y circular obj ects in a contrasti ng dark
background. A random part icl e in the area was sel ect ed to obt ain the X, Y
35
Figure 2.4 – CLSM Image from one cross-sectional plane of the sampling area where a particle is selected as the Particle of Interest.
The Z coordinat e was calcul ated b y the frame counting m ethod, whi ch
was obt ained b y plot ting the radi us of t he particl e o f int erest i ncreas ing
Z-axis in a bott om to t op di recti on . In t his anal ys is, t he parti cl e ‘st art s’ from
the fram e when it appears in the XY cross -s ect ional im age and ‘ends ’ at t he
fram e where it di sappears in t he im age at a particul ar depth. This m ethod
estim at ed the Z cent roid of t he parti cl e for the fram e where t he radi us of
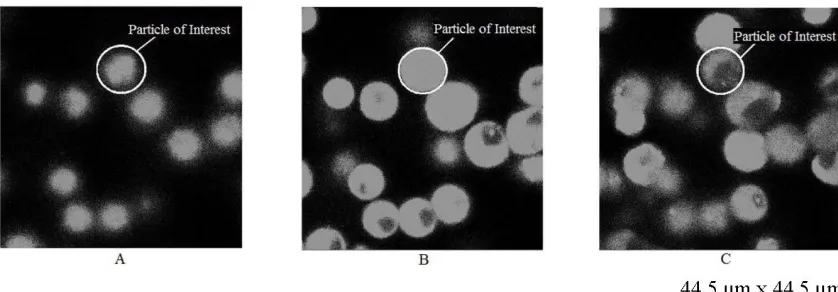
the parti cle of int erest was t he hi ghest . Fi gure 2. 5 illust rat es t his using the
cross -s ectional im ages for a particle at t hree different depths to illust rate
[image:45.612.216.428.77.300.2]36
Figure 2.5 - Methodology to obtain the Z position for the Particle of Interest. The dimensions of this volume cell are 44.5 µm by 44.5 µm by 32.2 µm with a Z-step sampling size at 0.17 µm. The Z position for the particle of interest in A is 4 µm, in B is 9.2 µm and in C is 13 µm. As shown here, the maximum-radius frame is closer to image B than those of A and C.
For all parti cl es , as t he siz e of a particle i ncreas e d i n the image st ack,
the num ber of fl uorescing pixels i ncrease d, causing t he parti cle t o appear
bi gger and bri ght er. Be yond the cent er plane of the parti cl e, the parti cl e
‘disappeared’ or blurred out of the image as the number of fluorescing
pixels decreas e d . A result of the frame counting m ethod t o obt ain t he Z
coordi nate of on e of the parti cl es is shown i n Fi gure 2.6. The parti cl e in
focus was im aged at incrementing st eps of 0.17 µm using the C LS M. Using
the i mfindci rcl es functi on, t he radius of this parti cle was calculated on
ever y fram e. The fram e radi i were plott ed as s hown in Fi gure 2.6. The
results indicat ed a s tead y increas e in the parti cle XY pl ane radius of the
parti cle with i ncreasing Z -axis m easure, unt il t he maximum poi nt was
reached; t he parti cl e XY pl ane radi us then decreas ed at a s tead y rat e. For
the parti cl e anal yz ed in Fi gure 2.6, the XY pl ane radi us was 4.40 μm, while
37
Figure 2.6 – Particle radius as a function of increasing Z position. A steady increase in the radius along with increasing Z-axis was observed until the Z centroid of the particle, after which a steady decrease in radius was seen until the particle disappears. In this figure, the point of maxima was at 10.40 μm, where the XY radius of the particle was 4.40 μm. Although the particle suffers from PSF along Z-axis, the centroid remains the same [25-27], as PSF is an optical image elongation around a fixed point.
The point of m axima was considered as the cent er Z coordinat e of the
parti cle, with the t rue ra dius of the parti cl e being the di fference bet ween
the point of m axima and t he point of mi ni ma along t he radius axis of Fi gure
2.6. The correspondi ng frame was us ed for the cal culat ion of the X & Y
coordi nates of the part icl e in the XY pl ane. Whil e the XY r adi us of the
particle is 4.40 μm, the particle is elongated on the Z -axis by over two times
the XY radi us, indicating that parti cl e is prol at e -spheroi dal in shape. This
elongation is due t o Point Spread Funct ion (PS F) along the Z -axis. The
maximum -radi us z -position fram e identi fied in Fi gure 2.6 was us ed as the
image frame for the analysis of X and Y values for the “particle of interest”. XY Plane Particle
Radius = 4.40 μm