White Rose Research Online URL for this paper:
http://eprints.whiterose.ac.uk/4977/
Monograph:
Rees, P. and Wohland, P. (2008) Estimates of Ethnic Mortality in the UK. Working Paper.
The School of Geography , The University of Leeds.
School of Geography Working Paper 08/04
eprints@whiterose.ac.uk
Reuse
Unless indicated otherwise, fulltext items are protected by copyright with all rights reserved. The copyright
exception in section 29 of the Copyright, Designs and Patents Act 1988 allows the making of a single copy
solely for the purpose of non-commercial research or private study within the limits of fair dealing. The
publisher or other rights-holder may allow further reproduction and re-use of this version - refer to the White
Rose Research Online record for this item. Where records identify the publisher as the copyright holder,
users can verify any specific terms of use on the publisher’s website.
Takedown
If you consider content in White Rose Research Online to be in breach of UK law, please notify us by
Estimates of ethnic mortality in the UK
Phil Rees and Pia Wohland
Version 1.0
September 2008
All rights reserved
School of Geography, University of Leeds,
Leeds LS2 9JT, United Kingdom
Mail address:
School of Geography
University of Leeds
Leeds, LS2 9JT
United Kingdom
Fax: +44 (0) 113 343 3308
Email:
Phil Rees
p.h.rees@leeds.ac.uk
Pia Wohland
geopnw@leeds.ac.uk
Page
Contents
iii
List of Tables
v
List of Figures
v
Abstract
vi
Keywords
vi
Acknowledgements
vi
1.
INTRODUCTION
1
2
REVIEW
4
2.1
Are ethnic-specific mortality rates used in population projections?
4
2.2
The measurement of ethnic mortality in the UK
4
2.3
The relationship between self-reported health and mortality for individuals
6
2.4
The relationship between self-reported health and mortality for geographical
populations
8
2.5
Conclusions of the review
9
3.
DATA AND METHODS: (1) MORTALITY AS A FUNCTION OF
ILLNESS
10
3.1
Introduction
10
3.2
The SIR method for estimating ethnic mortality
11
3.2.1
Step 1: extraction of illness data and computation of all group SIR for local
authorities and genders
12
3.2.2
Step 2: computation of all ethnic group SIRs for local authorities by gender
16
3.2.3
Step 3: measurements of the relationship between SMR and SIR
20
3.2.4
Step 4: estimation of SIRs for ethnic groups and local authorities
23
3.2.5
Step 5: estimation of SMRs for ethnic groups and local authorities
35
GEOGRAPHICAL WEIGHTING
5.
RESULTS
40
5.1
Comparison of methods
40
5.2
Results of SIR method
44
5.2.1
Life expectancies for ethnic groups
44
5.2.2
Explanation for the ethnic differences
46
5.2.3
The spatial patterns of life expectancies
50
6.
DISCUSSION AND CONCLUSIONS
62
6.1
Summary
62
6.2
Use of the ethnic mortality estimates
63
6.3
Updating of the ethnic mortliaty estimates
63
6.4
Forecasting ethnic mortality estimates
63
6.5
Prospects for better estimates of ethnic mortality
64
REFERENCES
66
APPENDICES
71
A.1.
Ethnic group names, labels and numbers
71
A.2
The life table model
73
1
Summary of UK work on ethnic population estimates and projections
5
2
Variables from Standard Tables 16 and 65, used to compute illness rates by age, for males, for
England, Wales, Scotland and Northern Ireland, 2001 Census
13
3
Sample computations of the Standardized Illness Ratio for four local authorities, using 2001
Census data
15
4
Age classifications used in mortality and population estimates for 2001
17
5
The parameters for the 14 regressions (SMR versus SIR)
22
6
Extracts from Standard Tables 101 and 107 showing the variables used to compute SIRs for
ethnic groups in England and Wales
24
7
Linear regression results for two SIR models for ethnic groups, females
29
8
Extracts from Standard Table 207 showing the variables used to compute SIRs for ethnic groups
in Scotland
33
9
Extracts from Standard Table 318 showing the variables used to compute SIRs for ethnic groups
in Northern Ireland
34
10
Mean life expectancy for 16 ethnic groups by gender for local authorities in England, using the
Standardized Illness Ratio and test results comparing mean life expectancy derived using SIR and
GWM methods for each ethnic group in England
42
11
The ranking of mean life expectancy for ethnic groups, men and women, 2001
45
12
Selected socio-economic indicators for aggregated ethnic groups, 2001 Census
47
13
Correlations of life expectancies for ethnic groups with selected indicators
49
14
Regression coefficients for a model predicting life expectancies from unemployment level and
degree qualification
49
A.1.1
Ethnic group names, meanings and numbers
71
A.2.1
Definitions of the life table variables
74
A.2.2
The average age at death in the first year of live, England and Wales 2001
78
A.3.1
Life expectancies for ethnic groups in Local authorities, UK, 2001
85
LIST OF FIGURES
1
The SIR method for estimating ethnic mortality
11
2
Map of SMR for 2001 or 2000-2 for UK local authorities for women
19
3
The relationship between SIR and SMR in UK local authorities by gender
21
4
Maps of the local authorities with small numbers
26
5
Linear regression results of SIR models for ethnic groups, females
28
6
The distribution of SIRs by local authorities for ethnic groups by gender, England, 2001
31
7
The geographically weighted method for estimating ethnic mortality
38
8
A graph comparing mean life expectancies at birth estimated using the Standardized Illness Ratio
and Geographical Weighted Model methods foe ethnic groups in England by gender, 2001
42
9
Box plots of male (M) and female (F) life expectancies at for 16 ethnic groups in England using
the Standardized Illness Ratio and Geographical Weighted Model methods, 2001
42
13
Maps of life expectancy at birth, for 16 ethnic groups, Wales, females, 2001
54
14
Maps of life expectancy at birth, for 5 ethnic groups, Scotland, males, 2001
55
15
Maps of life expectancy at birth, for 5 ethnic groups, Scotland, females, 2001
56
16
Maps of life expectancy at birth, for 12 ethnic groups, Northern Ireland, males, 2001
57
17
Maps of life expectancy at birth, for 12 ethnic groups, Northern Ireland, females, 2001
58
A.2.1
System diagram how the life tables are computed
75
A.2.2
Diagram illustrates age-time concept used in the life table
76
A.2.3
Age time spaces and weights used in computing
78
A.2.4
Age-time diagram for the last period cohort
80
A.2.5
Image of life tables showing survivorship probabilities (around 75)
83
ABSTRACT
This paper develops the first estimates of the mortality risks experienced by the UK’s ethnic populations
at local scale. Two estimations were developed. In the first, 2001 Census data on limiting long-term
illness is used as a predictor of mortality levels. The second estimation used the geographical distribution
of ethnic group populations across local areas with local mortality to reconstruct national mortality rates
by ethnicity, which were then used to estimate local ethnic mortality. A comparison of the two approaches
indicated the method based on illness rates produced more variation and hence was preferred to the flatter
estimates of the geographically weighted method. The local SMRs produced for each ethnic group were
linked to full life tables to produce a comprehensive set of ethnic group life tables for 432 local authority
areas in 2001.
KEYWORDS
Ethnicity, Mortality, Estimates, Standardized Illness Ratios, Standardized Mortality Ratios, Local
Authorities, England, Wales, Scotland, Northern Ireland, United Kingdom
ACKNOWLEDGMENTS
The research reported in this paper was supported by ESRC Research Award RES-163-25-0032,
What
happens when international migrants settle? Ethnic group population trends and projections for local
1. INTRODUCTION
The last two decades of the 20
thCentury and the first of the 21
stCentury have seen increasing levels of
international trade, both within customs unions and between world regions as tariffs and quotas on trade
have reduced. International capital has also become more mobile as a result of floating currencies and
reductions in the protection of national producers. The result has been world economic growth at healthy
levels, and very rapid growth in some developing world economies such as China, India and the countries
of South East Asia. The 2007-9 slow down because of the “credit crunch” will probably be a temporary
blip. Accompanying these changes have been large flows of international migrants between countries (see
The Economist 2008 for an overview), though barriers to labour movement remain much higher than for
goods or capital.
At the same time, in most developed countries the population is ageing because of fertility decline since
the start of 20
thCentury interrupted by a baby boom in the late 1940s, 1950s and 1960s, and because of
continuing improvement in life expectancies, especially at older ages. This has, at times of economic
growth, created a substantial demand for labour in some European countries, which has been filled in part
by international migration. The main demographic consequence of sustained flows of international
migrants into a country and its regions is the growth of the populations of immigrants and their
descendants and, if the settled or native population has low rates of growth, the subsequent changes in
ethnic composition of the population. This, in turn, leads to changes in national identity and culture.
Coleman (2006a, 2006b) has labelled this sequence of events the 'Third Demographic Transition'.
Countries need to have a view of their future, under different scenarios. One aspect of that future will be
the size, age structure and ethnic composition of the national population, given various assumptions.
These demographic features are likely to change substantially for the United Kingdom over the next 50
years. What demographers normally do to explore the future is to carry out projections of the population.
So far, these projections have taken into account the age and sex structure of the population and its spatial
distribution at country, region and local levels (Office for National Statistics and Government Actuary’s
Department 2006, Office for National Statistics 2004a), but ethnic composition has not been included in
projections.
Why might we want to project the population of the UK’s ethnic groups? The first reason is that if
plenty of evidence of such heterogeneity (Office for National Statistics 2004b). The second reason is so
that we can plan for the future more intelligently, to reach social goals (greater equality of opportunity
across ethnic groups), economic goals (to assess the future labour supply in terms of size and skills and
determine what policy is needed to improve skills of the resident population) and community goals (the
provision of the right schooling, the right mix of goods and services). You might object that the future is
likely to be uncertain, so that projections will always turn out to be wrong. But the range of uncertainty
can be estimated either by running many projections under different scenarios (variant projections) or by
sampling from error distributions of summary indicators of the main component drivers, fertility,
mortality and migration.
There are, however, a number of challenges involved in carrying out ethnic population projections. How
should ethnic groups be defined? How should they interact demographically? How do we estimate the
key ingredients, fertility, mortality, internal and international migration by ethnic group in the face of
inadequate data? What kind of projection model should be employed? What assumptions should we adopt
for future fertility, mortality or migration differences? How do we validate our projections?
This paper focuses on the mortality component of population change and specifically on the estimation of
ethnic mortality and its complement, ethnic survival. As explained in the review, although there are
examples of population projections that build in different mortality/survival profiles for different racial or
ethnic groups (e.g. the US Bureau of the Census 2004 projections, the Statistics New Zealand 2005
projections), none of the UK projections or roll-forward, year by year estimates of ethnic groups so far
carried out (UK regions: Rees and Parsons 2006; GLA, Boroughs: Bains and Klodawski 2006, 2007;
England, Local Authorities: Large and Ghosh 2006a, 2006b; UK: Coleman and Scherbov 2005; Leicester:
Danielis 2007) use ethnic-specific mortality. There is some work that uses mortality rates based on
country of birth (Harding and Balarajan 2002) but as discussed in section 2 such rates no longer reflect
the mortality of multi-generation ethnic groups.
The paper aims to describe two methods for estimating ethnic group mortality for the local areas of the
United Kingdom, to report the results and to discuss and evaluate the work.
The first method uses the relationship between self-reported illness in the 2001 Census and year 2001
mortality to convert local all-group mortality rates into ethnic specific rates. The second method uses the
all group mortality rates and re-weights them using the 2001 Census ethnic group populations to form
group mortality. Both sets of estimates are used to generate life tables for each ethnic group in each local
authority in the UK. From the life tables we derive survivorship probabilities by age and gender for use as
input to a projection model for local populations. These results constitute the first comprehensive estimate
of the way mortality risks vary in the UK between ethnic groups and across local areas.
The organization of the paper is as follows. Section 2 provides background by reviewing two sets of
work. Previous work in projecting ethnic group populations in the UK and previous work elsewhere,
identifying where ethnic group differences in mortality risk are used. Section 3 discusses the data and
methods used in the first approach to ethnic mortality estimation, which sees mortality as a consequence
of limiting long-term illness. Section 4 describes the data and methods used in a second approach to
ethnic mortality estimation, which re-weights local area mortality by ethnic composition of the local
population to produce national estimates of ethnic group mortality, which are re-cycled to estimate local
area mortality for each ethnicity. Section 5 compares the results of the two methods and then provides a
description of the preferred method, the first approach based on limiting long-term illness. Section 6
2. REVIEW
2.1 Are ethnic-specific mortality rates used in population projections?
Many national statistical agencies carry out population projections for the racial/ethnic groups that
compose their national populations. The United States Census Bureau routinely computes projections
by race and Hispanic origin (US Bureau of the Census 2004) and publishes life expectancies by race
(NCHS 2007). For example, White men have life expectancies in 2003 of 75.3, while for Black men
life expectancies are only 68.9. The corresponding figures for women are 80.4 for Whites and 75.9 for
Blacks. Statistics New Zealand (2008) have carried out projections for four ethnic groups: European
or Other including New Zealand (life expectancies for men 79.4 and women 83.2), Maori (70.4, 75.2),
Asian (84.0, 87.2) and Pacific (72.8, 77.2). Coleman (2006b) reviews the practice of European
countries in carrying out projections for migrant origin populations. Most use a nationality or
native/foreign based definitions of the groups and use ethnic specific mortality data. So, best
international practice incorporates ethnic-specific mortality in ethnic group projections.
2.2 The measurement of ethnic mortality in the UK
In the UK there has been continuing interest in both estimating and projecting the population by
ethnicity for more than three decades. Table 1 lists studies to 2007, building on an earlier review by
Storkey (2002a, 2002b). Careful examination of the methodologies used in these studies reveals that
none of them use ethnic-specific mortality rates.
Why should this be? The fundamental reason is that, to date, ethnic status has not been recorded in the
UK’s death registers. Country of birth is recorded on death records but this captures only the
experience of the first generation of immigrants. Harding and Balajaran (2002) have reviewed the data
sources available and their shortcomings. Deaths by country of birth have been matched with
populations at risk from the 1971, 1981 and 1991 censuses (Harding and Balajaran 2002, Table 2) but
the groupings are broad (e.g. Indian sub-continent) and the estimates are confined to first generation
immigrants. Bias was also introduced as the “Born in India” group also includes White British people
born in India during the Imperial era (pre-1947). There is also potential error because the country of
birth is reported by a relative of the deceased person.
There is evidence that mortality experienced by second and subsequent generations is worse than that
of the first generation. Harding and Balajaran (2002, Table 10) apply hazard analysis to all cause
mortality of first and second generation ethnic groups aged under 65 at the 1991 Census and followed
Table 1: Summary of UK work on ethnic population estimates and projections
Source (Author, Year)
Coverage
Spatial unit(s)
Ethnic groups (source)
Time horizon
Output
Model
OPCS (1975)
Great Britain
Great Britain
NCWP (1971 Census)
1966-1974
Estimates
CCM
OPCS (1977a)
Great Britain
Great Britain
NCWP (1971 Census)
1976-1986
Projections
CCM
OPCS (1977b)
Great Britain
Great Britain
NCWP (1971 Census)
1971-1986
Projections
CCM
OPCS (1979)
Great Britain
Great Britain
NCWP (1971 Census)
1976-1991-2001
Projections
CCM
OPCS (1986a, 1986b)
England and Wales
England and Wales
5 groups (1981 Census)
1981, 1983, 1984
Estimates
LFS
Schumann (1999)
Great Britain
Great Britain
11 groups (LFS)
1992-1997
Estimates
LFS
Bradford (1999)
Rochdale
Rochdale
Groups (1991 Census)
1999-2021
Projections
POPGROUP
Bradford (2000)
Bradford
Bradford
Groups (1991 Census)
1999-2021
Projections
POPGROUP
London Research Centre (1999)
Greater London
London Boroughs
10 groups (1991 Census)
1991-
Projections
MRM-GL
Storkey (2002a)
Greater London
London Boroughs
10 groups (1991 Census)
1991-
Projections
MRM-GL
Hollis and Bains (2002)
Greater London
London Boroughs
10 groups (1991 Census)
1991-
Projections
MRM-GL
Coleman and Scherbov (2005), Coleman (2006b)
United Kingdom
United Kingdom
4 groups (2001 Census)
2001-2100
Projections
CCM
Simpson and Gavalas (2005a), Simpson and Gavalas (2005c)
Oldham
Oldham
6 groups (2001 Census)
2001-2021
Projections
POPGROUP
Simpson and Gavalas (2005b), Simpson and Gavalas (2005c)
Rochdale
Rochdale
6 groups (2001 Census)
2001-2021
Projections
POPGROUP
Simpson and Gavalas (2005d), Simpson and Gavalas (2005e)
Stoke
Stoke
5 groups (2001 Census)
2001-2021
Projections
POPGROUP
Bains and Klodawski (2006)
Greater London
London Boroughs
10 groups (2001 Census)
2001-2026
Projections
MRM-GL
Large and Ghosh (2006a), Large and Ghosh (2006b)
England
Local authorities
16 groups (2001 Census)
2002-2005
Estimates
CCM
Rees and Parsons (2006), Rees (2006), Rees (2008)
United Kingdom
GORs, Wa, Sc and NI
5 groups (2001 Census)
2001, 2010, 2020
Projections
SRM-R&F
Stillwell, Rees and Boden (2006)
Yorkshire & The Humber
Local authorities
5 groups (2001 Census)
2005-2030
Projections
SRM-R&F
Simpson (2007a), Simpson (2007b) , Simpson (2007c)
Birmingham
Birmingham
8 groups (2001 Census)
2001-2026
Projections
POPGROUP
Bains and Klodawski (2007)
Greater London
London Boroughs
10 groups (2001 Census)
2006-2026
Projections
MRM-GLA
Danielis (2007)
Leicester
Leicester
8 groups (2001 Census)
2001-2026
Projections
POPGROUP
Notes: GOR = Government Office Region, Wa = Wales, Sc = Scotland, NI = Northern Ireland,
from 0.64 to 0.84 for the first generation of Indians, Pakistanis, Bangladeshis, Black Caribbeans and
Black Africans but are between 1.28 and 1.85 for all but one second generation groups.
A more promising data source in England and Wales is the Longitudinal Study (LS), a 1% sample of
linked records from the past four censuses (1971-2001). Ethnicity was measured in a direct question in
the 1991 Census and again in 2001. People in LS are linked to the deaths register so that deaths to each
ethnic group member can be identified, as long as sample members have not left the UK. So effectively
you need to wait for the next census so that survivors can be identified along with non-survivors.
Attempts, for example, to estimate mortality risk as the ratio of deaths since 2001 to sample members
present in 2001 will be biased, as some of these may have emigrated. Harding and Balajaran (2002) report
a considerable loss to follow-up of LS members, up to 30%, at older ages. Migration on retirement back
to country of origin seems a common practice for migrants from the Caribbean, in order to take advantage
of the lower cost of living and warmer climes. Even if you are using a full inter-census data set, this
degree of return migration may bias the measurement of mortality risk. Most usually, the return migrants
will be healthier than non-migrants, so this will raise the mortality rates of those left in the sample.
2.3 The relationship between self-reported health and mortality for individuals
So, what can be done to fill this gap in UK demographic statistics? We need a data source that can deliver
reliable information for all of the ethnic groups at local level. That source is the set of tables on health for
local areas generated from the 2001 Census, which asked questions on “limiting long-term illness” (as in
1991) and on “general health”. The details of the data used are described in section 3 of the paper.
The question is then whether illness or health data collected from a census can be used to estimate the
mortality risks of a local population. There have been a large number of studies carried out using
American, Danish, Dutch, Finnish and Swedish data which indicate that self-reported health is a
remarkably good predictor of subsequent mortality. These studies employ data from large surveys of the
population which ask a variety of questions on health and link them to national registers of deaths for the
individuals in the survey.
For example, Burström and Friedlund (2001, p.836) state that, based on a study of 170 thousand
respondents to the Swedish Survey of Living Conditions that
They compared the mortality risks of persons reporting fair and poor health with those reporting good
health. For socioeconomic groups based on occupation the rate ratios (the ratios of mortality rates of those
with fair or good health to those with good health, controlling for age) varied between 1.3 and 2.2 (men)
and between 1.1 and 1.8 (women) for those with fair health. The corresponding rate ratios for those with
poor health were 2.5 to 3.7 (men) and 2.9 to 3.5 (women).
McGee
et al.
(1999) used the National Health Interview Survey 1986-1994, linking records to the US
Deaths Index to estimate rate ratios (good health outcomes to poor or fair health outcomes) for five
racial/ethnic groups, controlling for age, number of bed days in hospital, number of visits to a physician
and number of years of education. For men, rate ratios were 2.5 for Whites and 2.0 for Blacks and for
women they were 2.3 for Whites and 1.9 for Blacks, these two groups having the highest and lowest rate
ratios. The variation between racial/ethnic groups, controlling for health history and socio-demographic
attributes, is remarkably small. Commentators have suggested differences in the way racial/ethnic groups
interpret questions on health, but McGee
et al.
(1999, p.45) affirm that
“Whatever self-reported health was measuring, it was nevertheless a strong predictor of mortality
among racial/ethnic groups we studied”.
Heistaro
et al.
(2001) carried out a similar analysis in eastern Finland and confirmed that, adjusting for
medical history, for factors associated with heart disease and strokes and for education, poor self-rated
health was a robust predictor of mortality. In a Danish study Helwig-Larson
et al.
(2003) controlled for
socioeconomic status, illness experience and life style variables and found a weaker self-reported
health-mortality relationship for persons aged 56 or over.
Franks
et al.
(2003) examined the self-reported health-mortality relationship from a different perspective.
They built models to predict mortality outcomes in the 1997 US National Medical Expenditure Survey
and found socioeconomic effects much reduced when self-reported health variables were introduced into
the models, though they found differences between ages, ethnic groups and sexes remained. Compared
with Whites, Blacks had higher hazard ratios and Latinos and others had lower. In their discussion the
authors point to differences by migrant status with racial/ethnic groups. For example, Singh and Siahpush
(2001) find that
Several studies suggest there are complications or subtleties in the self-reported health-mortality nexus.
Franks
et al.
(2003) point to differences in the relationship between self-reported health and mortality for
men and women. Women experience longer lives and lower mortality risks, adjusting for age, than men in
most countries. Yet their self-reported illness rates, controlling for age, may be similar to those of men in
the UK (Weller 2006) or higher in South East Asia (Lutz
et al.
2007). Singh-Manoux
et al.
(2007) found
that self-reported health is less able to predict mortality risk for middle aged individuals, while Dowd and
Zajacova (2007) found much greater relative risks for those in poor health in the top socioeconomic
quartile than in the lower socioeconomic quartile.
To sum up this evidence from microdata studies, we can make the following points for populations in the
set of countries studied.
Self-reported health status is a strong predictor of subsequent mortality.
The relationship for men is different from that for women.
Socioeconomic factors are important in explaining mortality variation across groups but
self-reported health status still has a significant influence after controlling for them.
There is variation between racial/ethnic groups in the self-reported health-mortality link but it is
not huge.
There is an important influence of immigrant generation with the first generation having better
self-reported health and mortality than subsequent generations.
2.4 The relationship between self-reported health and mortality for geographical populations
Measures of health and mortality are routinely reported for large, medium and small geographical areas
within countries (e.g. Office for National Statistics 2008a for maps of life expectancies across the UK and
Office for National Statistics 2008b for maps of age-standardized good health rates for England and
Wales). Many careful ecological regression analyses have been carried out, focusing on the influence of
socioeconomic deprivation and environment on morbidity and mortality (e.g. Rees 1995; Senior 1998;
Brown and Rees 2006). Senior (1998) found that the population in Wales reported high levels of limiting
long term illness after controlling for age, sex, socioeconomic deprivation and coal mining status.
The geographical distributions of morbidity and mortality were compared by Rees (1993-94) by plotting
the crude limiting long-term illness rate (1991 Census) against standardized mortality ratio for counties in
Great Britain. A moderate linear relationship was found but with residuals for counties in Wales, which
had higher illness rates than predicted by the SMRs, and Scotland, which had lower illness rates than
authorities, age-standardized illness ratios and life expectancies. The same relationships as reported by
Rees (1993) and critiqued by Senior (1998) persisted in this new analysis.
2.5 Conclusions of the review
The literature reviewed in this section of the paper leads to the following conclusions.
International best practice in carrying out projections for racial/ethnic populations uses
racial/ethnic specific mortality rates. The differences in mortality between racial/ethnic groups in,
for example, the US or New Zealand are considerable and suggest they can no longer be ignored
in UK work.
No direct measures of racial/ethnic mortality are available in the UK which are not seriously
biased or based on national samples which cannot be used to produce local measures.
There is a substantial literature which establishes that self-reported health is a good predictor of
subsequent mortality for individuals. Controlling for age and socioeconomic status, the
relationship between self-reported and mortality is not greatly different across racial/ethnic
groups, though it is different between men and women.
Geographical studies have found moderate relationships between illness and mortality measures,
although again care is needed to control for socioeconomic deprivation and dummies for home
country (in the UK) must be used.
These conclusions give us the confidence to explore whether we can use self-reported limiting long-term
illness from the 2001 Census measured at local authority scale for ethnic groups to predict mortality
3. DATA AND METHODS (1): MORTALITY AS A FUNCTION OF ILLNESS
3.1. Introduction
The aim of this analysis described in this paper is to develop benchmark estimates for 2001 of
mortality by ethnic group in the UK for local areas. These estimates will be used to generate the
inputs needed for an ethnic population projection model for the UK.
The projection model (Rees
et al.
2008) uses survivorship probabilities for period cohorts to
project survivors and non-survivors of the start-of interval populations Survivorship probabilities
are estimated through use of life tables. The methods used to compute life tables are standard,
but we outline the relevant equations, the key assumptions and the numerical methods used in
Appendix A.2 because some minor extensions are introduced. We also check out computations
using two different programming software methods (Java and spreadsheets).
Two methods are used to estimate mortality rates for ethnic groups, which are then used in life
tables to compute survivorship probabilities for ethnic groups. The first method uses an empirical
relationship between illness and mortality to derive ethnic group mortality rates from ethnic
group illness indicators in the 2001 Census. We call this the SIR (
S
tandardized
I
llness
R
atio)
method. The second method uses the different geographical distributions of ethnic groups as
measured in the 2001 Census to produce a weighted average set of mortality rates for the UK for
each ethic group. These UK rates are then used again with the local mortality rates to produce
3.2
The SIR method for estimating ethnic mortality
The sequence of computations in the SIR method is set out in Figure1.
MORTALITY RATES
STANDARDISED MORTALITY
RATIOS
POPULATION DATA
REGRESSION ANALYSIS
DEATHS DATA
2001 Vital statistics
Countries & Local
Authorities
2001 Mid year
Estimates
Countries & Local
Authorities
SMR = f(SIR)
•
All LAs in UK
•
LAs in E,W,S,N
•
‘Ethnic’ vs ‘Non-Ethnic’
•
North vs South
2001 , UK Standard
Countries & Local
Authorities
See Appendix A.2 for
equations
2001, UK Standard
Countries & Local
Authorities
see text for equations
STANDARDISED MORTALITY
RATIOS BY ETHNICITY
2001, UK Standard
Countries & Local
Authorities
see text for equations
LIFE TABLES & SURVIVORSHIP PROBABILITIES BY
ETHNICITY
2001 (Calendar Year)
Countries & Local Authorities
see Appendix A.2 for equations
RESIDENTS DATA
2001 Census Tables
S16,S65
Countries & Local
Authorities
LIMITING LONG TERM ILLNESS DATA
2001 Census Tables
S16,S65
Countries & Local
Authorities
STANDARDISED ILLNESS
RATIOS BY ETHNICITY
2001, UK Standard
Countries & Local
Authorities
see text for equations
STANDARDISED ILLNESS RATIOS
2001 , UK Standard
Countries & Local
Authorities
see text for equations
RESIDENTS DATA BY ETHNICITY
2001 Census Tables ST
101, 107, 207, 318
Countries & Local
Authorities
LIMITING LONG TERM ILLNESS BY ETHNICITY
2001 Census Tables ST
101, 107, 207, 318
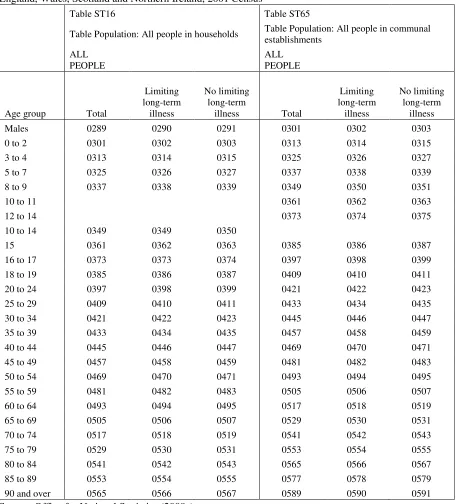
[image:18.595.80.489.160.696.2]3.2.1 Step 1: extraction of illness data and computation of all group SIR for local
authorities and genders
In the 2001 Census the following question was asked:
This information was coded into a
l
imiting
l
ong-
t
erm
i
llness variable or LLTI by age, sex, and
general health were produced for each country and local authority in the UK: Table S16 used
“All people in households” as it base populations while table S65 used “All people residents in
communal establishments”. Census data for Standard Tables S16 and S65, specified in Table 2,
were extracted via the CASWEB interface produced by CDU (2008) for local authorities in
England, Wales, Scotland and Northern Ireland.
The Standard Illness Ratio for the UK is computed as follows. First, we compute the age specific
illness rate for the UK, given by:
=
( ) +
( ) ÷
( ) +
( ) +
( ) +
( )
(1)
Where
P
=
residents recorded in the 2001 Census (Tables ST016, ST065)
c
=
country(England, Wales, Scotland, Northern Ireland)
I
=
with limiting long term illness
N
=
without limiting long term illness
g
=
Gender
H
=
residents in households
Table 2
: Variables from Standard Tables 16 and 65, used to compute illness rates by age, males, for
England, Wales, Scotland and Northern Ireland, 2001 Census
Table ST16
Table ST65
Table Population: All people in households
Table Population: All people in communal
establishments
ALL
PEOPLE
ALL
PEOPLE
Age group
Total
Limiting
long-term
illness
No limiting
long-term
illness
Total
Limiting
long-term
illness
No limiting
long-term
illness
Males
0289
0290
0291
0301
0302
0303
0 to 2
0301
0302
0303
0313
0314
0315
3 to 4
0313
0314
0315
0325
0326
0327
5 to 7
0325
0326
0327
0337
0338
0339
8 to 9
0337
0338
0339
0349
0350
0351
10 to 11
0361
0362
0363
12 to 14
0373
0374
0375
10 to 14
0349
0349
0350
15
0361
0362
0363
0385
0386
0387
16 to 17
0373
0373
0374
0397
0398
0399
18 to 19
0385
0386
0387
0409
0410
0411
20 to 24
0397
0398
0399
0421
0422
0423
25 to 29
0409
0410
0411
0433
0434
0435
30 to 34
0421
0422
0423
0445
0446
0447
35 to 39
0433
0434
0435
0457
0458
0459
40 to 44
0445
0446
0447
0469
0470
0471
45 to 49
0457
0458
0459
0481
0482
0483
50 to 54
0469
0470
0471
0493
0494
0495
55 to 59
0481
0482
0483
0505
0506
0507
60 to 64
0493
0494
0495
0517
0518
0519
65 to 69
0505
0506
0507
0529
0530
0531
70 to 74
0517
0518
0519
0541
0542
0543
75 to 79
0529
0530
0531
0553
0554
0555
80 to 84
0541
0542
0543
0565
0566
0567
85 to 89
0553
0554
0555
0577
0578
0579
90 and over
0565
0566
0567
0589
0590
0591
These rates are than applied to the number of residents in each age group to compute the
expectation for the number of people reporting limiting long term illness. The ratio of the
observed number reporting illness to the expected number then gives the Standardized Illness
Ratio.
( )
= 100 ×
( )+
( ) ÷
( )+
( )
(2)
The subscript
*
indicates summation over age x in the two numerator variables. Equation (2) is
the illness equivalent to the Indirect Standardized Mortality Ratio. Table 3 sets out sample
computations for four selected local authorities in each of the UK’s constituent countries. An
SIR of 100 indicates that a local population experiences limiting long-term illness equivalent to
the UK national average. SIRs above 100 indicate more people report LLT illness than the UK
norm. Leeds is justly slight above the UK average; Cardiff has a moderately higher SIR than the
UK; Belfast’s population reports nearly 40% more LLT illness than the UK norm. Edinburgh’s
population reports less LLT illness.
We will use equation (2) again to compute SIRs for ethnic groups, where numbers of each group
allow. Some demographers argue that it is better to use the Direct Standardized Mortality/Illness
Ratios but, in practice, the two methods give very similar rates. The Indirect SIR can be
computed for smaller populations where the local age-specific rates, needed for the Direct SIR,
Table 3:
Sample computations of the Standardized Illness Ratio for four local authorities, using 2001
Census data
United Kingdom: All People
England
Wales
Scotland
N. Ireland
Residents in Households
Residents in Communal
Establishments
Leeds
Cardiff
Edinburgh
Belfast
Age group
Limiting
long-term
illness
No limiting
long-term
illness
Limiting
long-term
illness
No
limiting
long-term
illness
Illness
Rate
Residents
Residents
Residents
Residents
Females
5511098
24131471
313380
201450
0.193
369153
159369
233787
147471
0 to 2
22191
973139
129
843
0.022
11858
5510
6494
4695
3 to 4
23271
680454
57
243
0.033
8145
3863
4321
3454
5 to 7
40576
1030341
58
410
0.038
13030
5669
6568
5349
8 to 9
29802
721027
60
752
0.040
8997
3999
4580
3864
10 to 14
79625
1800726
773
11304
0.042
23450
9943
11432
10110
15
16707
346076
295
4178
0.046
4481
1819
2362
2144
16 to 17
33642
675712
1037
12218
0.048
8332
3707
4591
4052
18 to 19
34443
602316
2842
62173
0.053
11589
5838
6955
5416
20 to 24
100732
1610590
4622
61659
0.059
29579
15156
21428
12211
25 to 29
134273
1817644
3060
14087
0.070
25775
11547
19565
10568
30 to 34
190919
2091922
3658
5631
0.085
28207
12132
19169
10466
35 to 39
241075
2098506
4274
2862
0.105
27629
11925
18243
10542
40 to 44
269936
1817810
4069
1882
0.131
24824
10337
16425
9828
45 to 49
311482
1566016
4003
1500
0.168
20936
9088
13542
7684
50 to 54
433304
1596109
4647
1352
0.215
23173
9148
14599
7371
55 to 59
469459
1210676
4579
1226
0.281
18346
7231
11089
7098
60 to 64
476151
986931
5169
991
0.328
17215
6362
10539
6444
65 to 69
504913
840843
7627
1022
0.378
15802
6324
10291
6562
70 to 74
557659
703702
15341
1446
0.448
15268
6064
9978
6563
75 to 79
598737
510807
33226
2351
0.552
13253
6036
8873
5623
80 to 84
479647
286497
54533
3506
0.648
9701
4045
6285
3858
85 to 89
315110
121378
75368
4610
0.756
6131
2396
4127
2351
90 +
147444
42249
83953
5204
0.830
3432
1230
2331
1218
Totals
5511098
24131471
313380
201450
0.193
369153
159369
233787
147471
Total LLTI
69353
30742
42288
37908
3.2.2 Step 2: Computation of all ethnic group SMRs for local authorities by gender
Standardized Mortality Ratios (SMRs) are computed for the populations (all ethnic groups) of
local authorities in UK using the indirect method:
( )
= 100 ×
( )
( )
(3)
where
( )
= deaths of residents in local authorities I and of gender g in calendar year 2001
( )
= local authority i in country c
g
= gender
= mortality rate for age x and gender g in the standard population u, the United Kingdom
( )
= mid-year 2001 estimate population in local authority i(c), age x and gender g
The mortality rates are computed as
( )
=
( )
( )
(4)
where
( )
is the mortality rate for local population in country c by age x and gender g. These
are the inputs also to a life table, the computation of which is explained in Appendix A.2.
Local authority deaths and populations by age and gender for all local authorities in the UK were
supplied by national statistics using the age classification set out in Table 4. Some estimates
using simple but reasonable assumptions were needed to achieve data classified uniformly by
Table 4
: Age classifications used in mortality and population estimates for 2001
Country
National 2001
deaths
E, W, S, N
Country
National
mye
2001population
estimates
E, W, S, N
Local 2001
calendar
deaths
U
Local MYE
population
Local
census
population
U
E,W,S
N
0
0
0-4
0
0
0
1
1
5-9
1
1
1
…
…
…
…
…
…
…
…
…
…
…
…
99
99
80-84
89
84
99
100+
100+
85+
90+
85+
100+
Source: ONS, GROS &NISRA
Notes: 1. E = England, W = Wales, S = Scotland, = Northern Ireland, U = United Kingdom
2. Census Population come from Table ST001 3. MYE = mid-year estimate
Local population mid-year estimates for 2001 were only available to age 90+ in England, Wales
and Scotland and to age 85+ in Northern Ireland. However, single year of age tables were
available for the 2001 Census (Standard table ST001). We assumed that the distribution of the
age 90+ population at midyear 2001 (3
rd
June) was the same as at census (29
th
April) in England,
Wales and Scotland:
( )
=
( )
×
( )
( )
= 90, … 100+,
= ,
,
(5)
And similarly for the 85+ population in Northern Ireland:
( )
=
( )
×
( )
( )
= 85, … 100+,
=
(6)
where:
( )
Deaths by single years of age were estimated by adjusting estimates based on national mortality
rates and local populations by single years of age to published deaths by five year age groups:
( )
=
( )
×
( )
÷
( )
(7)
Where x= five year age group. Mortality rates for local populations are estimated as
( )
=
×
( )
÷
( )
(8)
The SMRs for local populations are estimated using UK mortality rates
( )
.
( )
= 100 ×
( )
÷
( )
(9)
The resulting SMRs for females are shown in Figure 2. The spatial patterns are familiar, having
been reported in a number of National Statistics publications. SMRs are lower in southern
England than northern England, Wales and Scotland. SMRs are lower in urban areas than in
surrounding rural areas (though London has more favourable mortality than other large cities).
SMRs are higher in coalfield areas such as South Wales, South Yorkshire, Nottinghamshire,
Northumberland, Durham, Lanarkshire and Ayrshire. SMRs are higher in some remoter rural
Figure 2
: Map of SMR for 2001 or 2000-2 for UK LAs for women
Wales
120 to 135 (0)
110 to 120 (6)
100 to 110 (31) 90 to 100 (20)
80 to 90 (2)
70 to 80 (0)
Female SMR UK
England
120 to 135 (5)
110 to 120 (40)
100 to 110 (93)
90 to 100 (151)
80 to 90 (88)
70 to 80 (13)
Northern Ireland
120 to 135 (0)
110 to 120 (8)
100 to 110 (6)
90 to 100 (11)
80 to 90 (2)
70 to 80 (0)
Scotland
120 to 135 (11) 110 to 120 (35) 100 to 110 (76) 90 to 100 (26)
80 to 90 (0)
3.2.3 Step 3: measurement of the relationship between SMR and SIR
We now examine the relationship between SIRs and SMRs for local authorities in the UK. In the
review section of the paper, we found that self reported illness was a good predictor of
subsequent mortality risk and that there was a moderately strong correlation between illness
indicators (crude illness rate, SIR) and the SMR measured for UK countries or local authorities.
The regression line predicting SMR from SIR did, however, differ between English, Welsh and
Scottish areas.
Figure 3 graphs SMR against SIR for three different partitions of the local authority data set for
both sexes. Table 5 provides the coefficients for the regression lines depicted in the graphs. How
good a predictor of a local authority’s SMR is its SIR? The goodness of fit (r
2
) varies from a low
of 0.16 for females in Northern Ireland to a high of 0.78 for females in Wales; on average it is
around 0.5 but higher for males than females. So about half the variation in SMRs across local
authorities is associated with variation in self-reported limiting long-term illness. Slope
coefficients are all below one, indicating that there is regression towards the mean: areas with
higher than average SIRs also experience higher than average SMRs but these are closer to the
Figure 3
: The relationships between SIR and SMR in UK local authorities by gender: (a) for all
local authorities in the UK and by countries, females, (b) for all local authorities in the UK and by
countries, males, (c) for local authorities in the UK with above and below average shares of ethnic
minority groups, females, (d) for local authorities in the UK with above and below average shares
of ethnic minority groups, males (e) for local authorities in Northern and southern England,
females, (f) for local authorities in Northern and southern England males.
Females SIRs 180 160 140 120 100 80 60 F e m a le s S M R s 180 160 140 120 100 80 60
Fit line for Total N S W E N S W E Males SIRs 180 160 140 120 100 80 60 M a le s S M R s 180 160 140 120 100 80 60
Fit line for Total Northern Irland Scotland Wales England Northern Irland Scotland Wales England Female SIR 175.00 150.00 125.00 100.00 75.00 50.00 F e m a le S M R 150.00 125.00 100.00 75.00 50.00
Fit line for Total Ethnic minorty <= 8.2% Ethnic minorty > 8.2% Fit line for Total Ethnic minorty <= 8.2% Ethnic minorty > 8.2%
ETH_Min
R Sq Linear = 0.484
Male SIR 175.00 150.00 125.00 100.00 75.00 50.00 M a le S M R 150.00 125.00 100.00 75.00 50.00
Fit line for Total Fit line for Total Ethnic minority <= 8.2% Ethinc minorty > 8.2% Ethnic minority <= 8.2% Ethinc minorty > 8.2%
ETH_Min
R Sq Linear = 0.583
Female SIR 175 150 125 100 75 F e ma le S M R 140 120 100 80 60 South North Fit line for Total South North Male SIR 175 150 125 100 75 50 M a le S M R 140 120 100 80 60 South North Fit line for Total South North
(
a
)
(
b
)
(
c
)
(
d
)
Table 5:
The parameters for the 16 linear regressions of SMR as a function of SIR.
Females
Males
Nation
n
r
2Intercept
(a)
Slope
(b)
r
2