TITLE - Forces between surfaces in
liquids/ Hugo K.Christenson
AUTHOR - Christenson, Hugo K
PUB - 1983
CALL# - QD541.C56
BARC - +1247328
VOL-NO. OF PAGES - 183
HUGO K. CHRISTENSON
A thesis submitted for the degree of
Doctor of Philosophy
at the Australian National Univ
ersity
PREFACE
This dissertation is an account of research carried out at the
Department of Applied Mathematics, Research School of Physical
Sciences, Australian National University, between July 1980 and June
1983.
Except where otherwise stated, the work is my own.
The results
of Section 3.2 (cyclohexane) were obtained in collaboration with
R.G. Horn and J.N. Israelachvili, and those of Section 5.3 (propylene
carbonate) with R.G. Horn.
None of the work reported here has been submitted to any other
institution of learning for any degree.
Hugo Christenson
PUBLICATIONS
1.
H.K. Christenson and S.E. Friberg
"Spectroscopic Investigation of the Mutual Interactions between
Nonionic Surfactant, Hydrocarbon, and Water"
J. Colloid Interface Sci. 75, 276-285 (1980).
2.
D.W. Larsen, S.E. Friberg and H.K. Christenson
"Mobility of Solvent Molecules in a Nonaqueous Lyotropic Liquid
Crystal"
J. Amer. Chern. Soc. 102, 6565-6566 (1980).
3.
H.K. Christenson, S.E. Friberg and D.W. Larsen
"NMR Investigations of Aggregation of Nonionic Surfactants in a
Hydrocarbon Medium"
J. Phys. Chem.~' 3633-3638 (1980).
4.
H.K. Christenson, R.G. Horn and J.N. Israelachvili
"Measurement of Forces Due to Structure in Hydrocarbon Liquids"
J. Colloid Interface Sci. 88, 79-88 (1982).
5.
J.N. Israelachvili, L.R. Fisher, R.G. Horn and H.K. Christenson
"Measurement of Adhesion and Short-Range Forces between
Molecularly Smooth Surfaces in Undersaturated Vapours and in
Organic Liquids"
In "Microscopic Aspects of Adhesion and Lubrication" (J.M. Georges,
ed.), pp.55-69, Elsevier, Amsterdam, 1982.
6.
H.K. Christenson
"Experimental Measurements of Salvation Forces in Nonpolar Liquids"
J. Chem. Phys.
J_J}_,6906-6913 (1983).
7.
H.K. Christenson and R.G. Horn
"Direct Measurement of the Force between Solid Surfaces in a Pol
a
r
Liquid"
ACKNOWLEDGEMENTS
Firstly, I would like to thank my parents for providing me with a
chemistry set on my tenth birthday, of which this thesis is but a
natural consequence.
Secondly, I am much indebted to Professor S.E.
Friberg of the University of Missouri-Rolla, for introducing me to
colloid and surface science and subsequently arranging my
transportation to Australia.
Thirdly, I am grateful to Professor B.W.
Ninham for kindly receiving me.
Fourthly, and most importantly, I owe much gratitude to the
members of Applied Mathematics who have helped me during these last
three years.
My supervisors, J.N. Israelachvili and R.G. Horn, have
provided me with much needed guidance and advice throughout this
period, and many discussions with D.Y.C. Chan, on the theoretical
aspects of my work, and with R.M. Pashley, mainly on lanthanum, have
also greatly assisted me.
B.W. Ninham deserves further
acknowledgement for putting up with such a miserable Swede, and also
for his encouragement of this work, much of which is based on his
suggestions.
I have greatly benefitted from discussions, although
rarely on matters scientific, with fellow students, past and present,
particularly S.L. Carnie, G.R. Walker, B. Beresford-Smith and
P. Claesson.
Norma Chin deserves praise for her efficient typing of this
thesis.
ABSTRACT
Forces between molecularly smooth mica surfaces immersed in a
variety of liquids have been measured.
In Chapter 3, the results of
such measurements with the non-polar liquids cyclohexane, benzene,
tetrachloromethane, octamethylcyclotetrasiloxane, n-octane and
2,2,4-,
trirnethylpentane are presented.
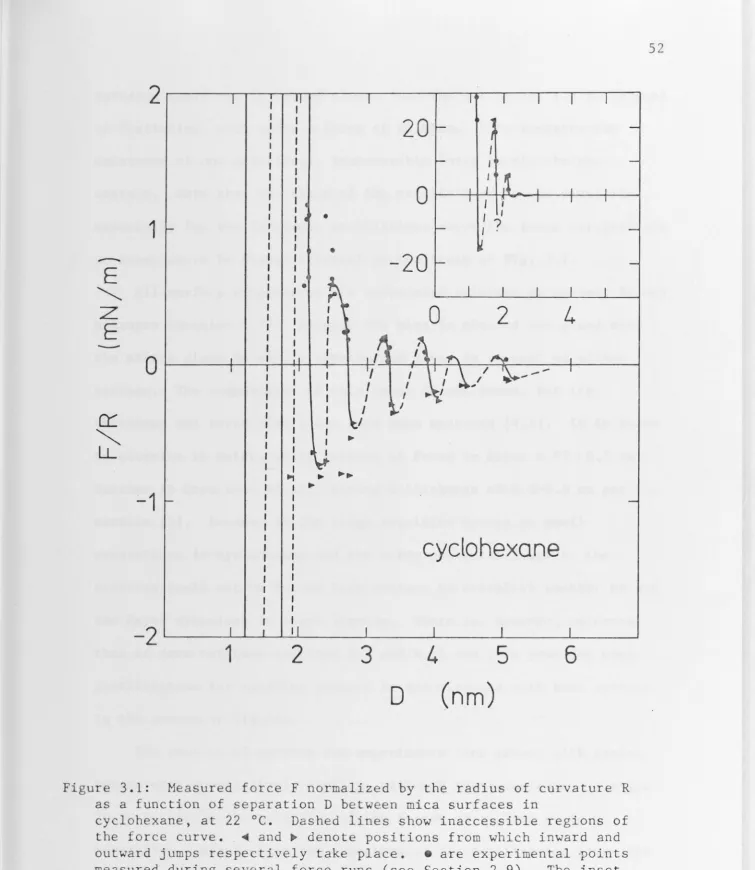
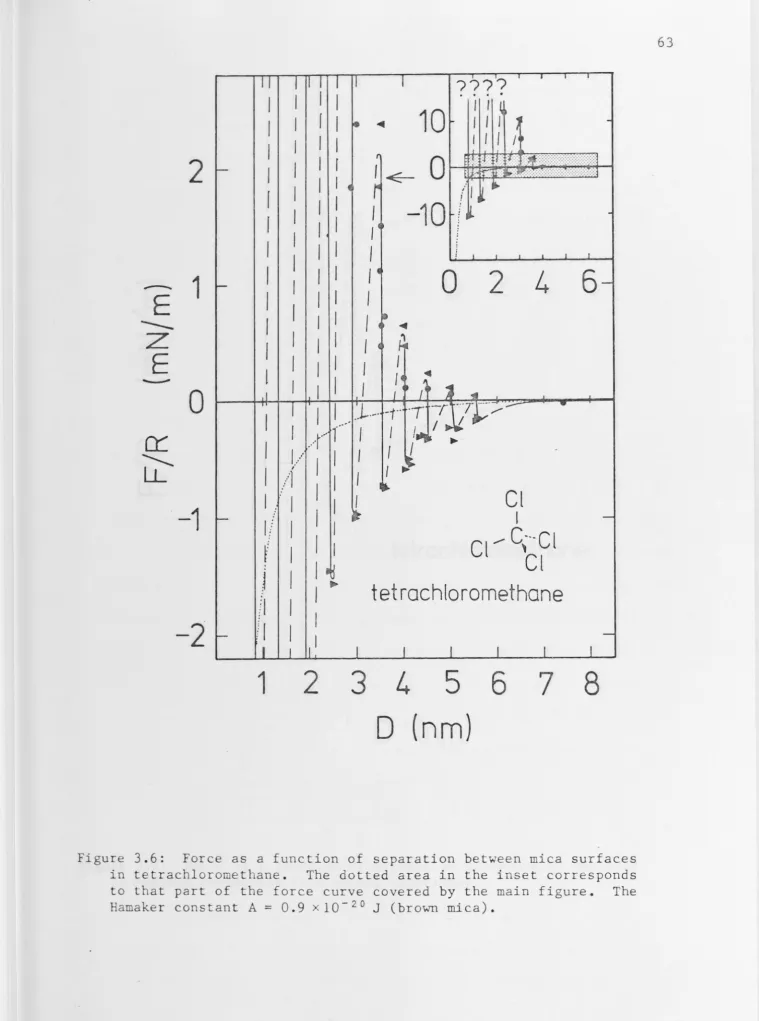
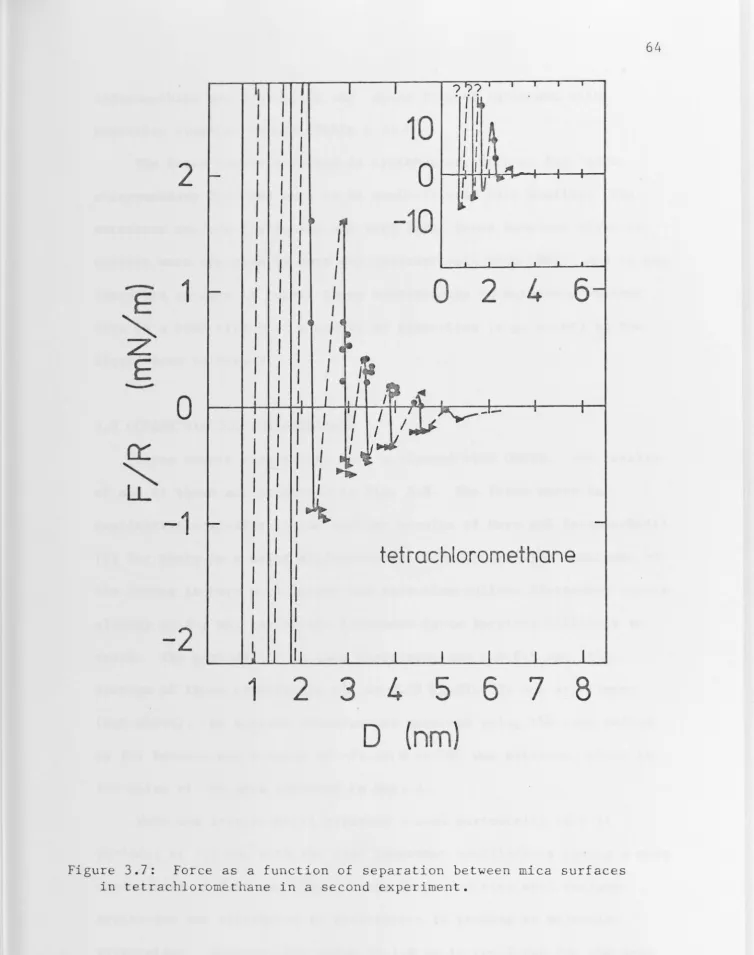
In the first four liquids, whose
molecules are compact and fairly rigid, the force at small separations
is a decaying oscillatory function of surface separation, with a
periodicity roughly equal to the mean molecular diameter and a
measurable range of about ten periods.
Beyond this separation the
force merges into an attractive force consistent with the predictions
of continuum Lifshitz theory.
Inn-octane and 2,2,4-trimethylpentane,
whose molecules are flexible, there are only a few (1-4) oscillations
and at larger separations the force is attractive.
In Chapter 4, the effect of small amounts
·
of dissolved water on
the forces in these liquids is investigated.
The presence of trace
amounts of water leads to a reduction in the range and magnitude of
the oscillatory salvation forces, but the adhesion at contact is
greatly increased.
At concentrations close to saturation,
condensation of bulk water around the mica surfaces in contact takes
place and this is analogous to capillary condensation from
under-saturated vapour.
Chapter 5 contains results of measurements in polar liquids, with
and without added electrolyte.
Propylene carbonate, acetone and
methanol show oscillatory salvation forces at small surface
separations, similar to those encountered in non-polar liquids.
There
are long-range repulsive forces, well described by the sum of a
CONTENTS
PREFACE
PUBLICATIONS
ACKNOWLEDGEMENTS
ABSTRACT
CHAPTER
1.
BACKGROUND
1.1 Introduction
1.2 Van der Waals Forces
1.3 Electrical Double-Layer Forces
1.4 Forces Due to Solvent Structure
1.5
Outline
of Thesis
References
CHAPTER 2.
EXPERIMENTAL METHODS
2.1 Introduction
2.2 Description of Apparatus
2.3 Optional Attachments
2.4 Preparation of Mica
2.5 Mounting of the Mica Sheets
2.6 Experimental Procedure
2.7
Interferometric Measurements
2.8 Derivation of Some Formulae
for
Use
at
Large Separations
2.9 Force Measuring Techniques
2.10 Purification of Liquids
2.11 Complementary
Measurements
CHAPTER 3.
FORCES BETWEEN MICA
SURFACES
IN
NON-POLAR
LIQUIDS
3.1 Introduction
3.2 Cyclohexane
3.3 Benzene
3.4 Tetrachloromethane
3.5 Octamethylcyclotetrasiloxane
3.6 n-Octane
3.7
2,2,4-Trimethylpentane
3.8 Discussion
3.9 Comparisons with Theory
3.10 Conclusions
References
CHAPTER 4.
EFFECTS OF WATER ON
THE FORCES
IN NON-POLAR LIQUIDS
4.1 Introduction
4.2 Capillary Condensation of One Liquid from
Another
4.3 Forces in OMCTS as a Function of Water Activity
4.4 Forces in Other Non-Polar Liquids in the
Presence of Water
4.5 Forces in Other Binary
Mixtures
4.6 Discussion
4.7
Conclusions
References
CHAPTER 5.
FORCES BETWEEN
MICA
SURFAC
ES
IN POLAR LIQUIDS
5.1 Introduction
5.2 C
a
lculations
5.3 Propylene
Carbonate
5.4 Acetone
5.5
Methanol
5.6 Discussion
5.7
Summary
CHAPTER 6.
SUMMARY AND IMPLICATIONS FOR
COLLOIDAL STABILITY
6.1 Summary of Results
6.2
Implications for Colloidal Stability
References
APPENDIX:
CALCULATION OF VAN DER WAALS FORCES
FROM
LIFSHITZ
THEORY
A.l The Non-Retarded Approximation
A. 2 Retarded van der Waals Forces
A. 3 Representation of the Function s(i~)
A. 4 Calcula
.
tions
A.5
Discussion
References
153
155
161
1.1 INTRODUCTION
The stability of colloidal dispersions is determined by the
forces acting between the surfaces of the particles, and such surface forces are also of· great importance in areas such as contact
mechanics, the study of friction and lubrication, cell biology and soil science as well as being of fundamental interest in chemistry and physics. The impetus for much of the theoretical work on surface
forces has come from colloid and surface science, where an accurate
knowledge of these forces is required to explain a number of diverse phenomena, including the flocculation of dispersions, the wetting and spreading behaviour of liquid films, the spontaneous swelling of clays
and the adhesion between solid bodies. While a great deal of
theoretical as well as indirect experimental work on surface forces has been done over the last eighty years, it is only comparatively recently that accurate measurements of these forces have been
performed.
rationalize observations on the dependence of flocculation and stability of dilute aqueous dispersions on the electrolyte
concentration, and although i t is only in the last few years that i t has been satisfactorily verified by direct force measurements in
aqueous solutions [6], i t has been known for some time to give accurate stability predictions for a variety of disperse systemsc There are, however, a number of systems for which DLVO theory fails. Examples are the spontaneous swelling of montmorillonite in
electrolyte solutions (7] and the coagulation behaviour of latices in high salt (8]. This is not surprising - DLVO theory is a continuum theory in that both the van der Waals and the double-layer
contribution to the force treat the liquid as a structureless medium, characterized by bulk properties like the dielectric constant or
refractive index. While i t is accurate in the long-range regime and thus able to correctly predict many features of colloid stability, i t is fairly obvious that such a theory must ultimately break down as the surface separation approaches molecular dimensions.
It is convenient to divide the total force Ft between surfaces in liquids into three contributions
( 1 .1)
where F VdW is the van der Waals force, F EDL is the force due to the overlap of electrical double layers and FSTR is a term to account for
"structural" or solvent-induced contributions to the force. The first two terms are thus the forces considered in DLVO theory, and the third contribution gives an indication of deviations from this theory. At surface separations large compared to molecular dimensions F is
[10-12], but whether or not the three contributions to the force are
truly additive, especially in the short-range regime, is an open
question. In the above, forces due to adsorbed polymer layers (steric
forces) have been neglected and will not be considered in this thesis. In the following sections van der Waals forces (1.2), electrical double-layer forces
(1.3)
and forces due to solvent structure(1.4)
will be briefly considered, after which an outline of the present work
will be given
(1.5).
1.2 VAN DER WAALS FORCES
Between any two surfaces in a medium or vacuum a long-range force, the van der Waals or dispersion force, operates. For two similar surfaces this force is always attractive and i t arises from correlations between electronic fluctuations of the constituent atoms of the different media. In colloid science, two approaches for
dealing quantitatively with these forces have been used, the microscopic approach of Hamaker
(13]
and de Boer(14]
and themacroscopic one of Lifshitz and co-workers
(15].
In the former one sums the interactions between individual atoms, given by the London attractive force[16],
over the macroscopic domain of the interactingsurfaces and the method is thus based on an assumption of pairwise additivity of atomic interactions - a very tenuous assumption when dealing with condensed media. For the energy E(D) of interaction per unit area between two semi-infinite half-spaces across a vacuum one obtains the relation
E(D)
=
-A 1 1 /12TID2with the corresponding attractive force F(D) given by
( 1. 3)
where Dis the surface separation and A
11 is the Hamaker constant, which depends on the polarizabilities of the individual atoms or molecules and the density. Similar formulae can be derived for
interacting surfaces in a variety of configurations, including multi-layered systems [17].
The fundamental objection to the microscopic approach is that it neglects many-body forces, but i t is also customary to neglect
contributions from permanent dipoles and assume that the atomic polarizabilities are determined by the dielectric behaviour in the ultraviolet, which leads to further problems for some systems. Also, no account of retardation effects is taken and this will lead to
significant error when the Hamaker constant is used to obtain forces
or energies at large surface separations.
To include the effect of an intervening medium one must assume some geometric mean relationship for the Hamaker constants, again based on pairwise additivity, of the form
(1.4)
where A212 is the Hamaker constant for two surfaces of medium 2
interacting across medium 1 and A11 ,A22 are the Hamaker constants for media 1 and 2 respectively interacting across vacuum.
polarization that are affected by the interfaces between the phases (media). Due to retardation effects, the Hamaker constant becomes a
Hamaker function, dependent on the distance, and the energy of
interaction is not a simple l/D2 relation. For a brief discussion of the Lifshitz formulae and their practical use, see the Appendix at the end of this thesis. Expressions for the energy of interaction between surfaces in various configurations have been derived [18,19], and
alternative, si~pler derivations of the non-retarded approximation to the Lifshitz theory have been presented [20].
The sole limitation of this continuum (macroscopic) approach is that the dimensions of the bodies must be large compared to
interatomic distances [15]. The theory will therefore inevitably fail
in the short-distance regime, at least for the case of condensed media, and even in vacuum or rarefied media (gases at low pressure)
the position of the interfaces becomes an uncertain parameter at small surface separations. In order to use Lifshitz theory to, for example, predict contact adhesions one must introduce some rather arbitrary "cut-off" distance, in other words define the distance of closest approach as some finite value.
A number of experimental measurements have confirmed the validity of Lifshitz theory for several different systems. Sabisky and
Anderson [21] found that the thickness of helium films on alkaline earth fluorides was in good agreement with theoretical predictions, and Brooks et al. [22] obtained values for the thickness of swollen bilayers consistent with Lifshitz theory. Direct measurements of the force between mica surfaces in air by Tabor and Winterton [23],
somewhat larger and retardation effects were smaller than expected.
Possible reasons for this discrepancy have been discussed by
White
et
al. [26].
For solid-liquid-solid systems there has to
date
been only one
test of Lifshitz theory in a non-aqueous liquid, that of Klein [27],
who found reasonable agreement with non-retarded theory for the forces
between mica surfaces in cyclohexane containing water (see Section
3.2).
The values obtained by Israelachvili and Adams [6] for the van
der Waals forces in strong electrolytes at surface separations above 5
nm (where the double-layer force is negligible) are also in reasonable
agreement with theory, although the experimental measurements were not
compared with the complete (retarded) Lifshitz expression.
Rabinovich
et al. [28] have likewise measured forces in strong electrolyte
solutions in good agreement with theory, but the inevitable effect of
surface roughness of the glass filaments used in these experiments was
not considered.
All these results, however, were obtained at
comparatively large surface separations, beyond 10-15 molecular
diameters of the liquid.
At small surface separations in the non-polar liquid
octamethyl-cyclotetrasiloxane [29] Lifshitz theory is unable to account for the
measured force, and in order to explain the results one
must
leave the
domain of continuum theory and turn to results from liquid-state
physics, where solvent structure is explicitly considered (see Section
1.4).
1.3
ELECTRICAL
DOUBLE-LAYER
FORCES
At the interface between two
phases a
charge
may develop
there is a difference in the affinity of the two phases for ions. For the case of a solid in a liquid this results in a diffuse double
layer, where one layer of charge is located in a plane at or close to the interface in the solid, and the second layer of opposite charge is
distributed throughout the liquid, but with the greatest concentration of charge close to the solid surface. The theory of the electrical
double layer was developed independently by Gouy [30] and Chapman [ 31] •
In the Gouy-Chapman model of the electrical double layer the ions are regarded as point charges, the surface charge is assumed to be
uniformly smeared out with a surface potential of
Wo
and thepermittivity of the liquid is taken as a constant. The electrostatics of the system is described by Poisson's equation (in SI units)
div(grad W)
=
-p/s , (1.5)where pis the charge density in the liquid, s the static permittivity of the liquid and
W
the potential. In order to solve equation (1.5) for the potential, one needs to know the distribution of charge (ions) in the liquid. For the one-dimensional case (i.e. away from a planeUl ~ fo be. or around a spherical surface) the distribution G-a.a be :writtett ~ a
<:L" &.·t-r·,·lo U.. ft'OVL simple Boltzmann Q~Yatii.sn
n.
=
n. o exp(-z.eW/kT),l l J.. ( 1. 6)
where n. is the local concentration of an ion of charge z. (with sign)
J.. l
and n
°
is the bulk concentration (at an "infinite" distance from the isurface, where
W
must equal zero). Pis thus simply equal toL
n.z.ei
l ld2
l/J
=
dx
2- ;
~
n.
0
z.e exp(-z.e
l/J
/kT)
c.. • l l l
l
(1.7)
This is the non-linear Poisson-Boltzmann equation for a single, planar
double layer and its solution is given implicitly by
tanh(zelJ;/4kT)
=
tanh(zel/J
0/4kT) exp(-Kx),
(1.8)
where
K
=
( 1. 9)and z is the modulus of the valency of the counterions.
K-
1is the
Debye length, and as can be seen,
_
its value decreases with increasing
ionic concentration and valency, and increases with incr~asing value
of the dielectric constant.
Equation (1.8) is strictly speaking correct only for a
symmetrical electrolyte, but, at high potentials, most of the excess
charge in the double layer results from the accumulation of
counterions (and not the expulsion of co-ions) and it is possible to
treat an unsymmetric electrolyte as symmetrical with the valency equal
to that of the counterions
[2].
The reason for this is readily seen
from equation (1.6).
To see the effect on the potential of the Debye length, it is
more instructive to examine an approximate solution, obtained by
linearizing equation (1.7).
Expanding the exponential in
a power
series and retaining only the first
two
terms yields an equation
which
has the solution
l/J
=
ljJO
exp ( -Kx) .
(1.10)
This
is the
Debye-Hiickel
approximation
and
it
embodies
the
important
features of the complete solution (1.8).
As
can
be seen,
the
potential decays exponentially away from the surface, with a decay length equal to K- 1 • Because K-l decreases with increasing
electrolyte concentration, the potential falls more rapidly away from the surface at higher electrolyte concentrations - referred to as
"compression of the double layer".
The surface charge 0 must balance the charge in the adjacent
solution and this electroneutrality condition gives
0
=
J
oo pdx=
SJ
00[~J
dx=
dx2 J0 0
s [~)
dx x=O
(1.11)
Using equation (1.6) integrated once, this gives (for a symmetrical electrolyte where n. 0
=
n °)l
(1.12)
and, since K- 1 is proportional to the square root of the permittivity,
i t follows that for the same surface charge, the potential will be higher the lower the dielectric permittivity.
When two charged surfaces approach each other, the resulting overlap of the double layers will lead to a repulsive force between
the surfaces. This force may be thought of as an osmotic pressure effect due to the enhanced concentration of counterions between the surfaces. To obtain the force, one must solve the Poisson-Boltzmann equation with modified boundary conditions.
For flat plates, with the substitutions X
=
KX and Y=
ze~/kT the non-linear Poisson-Boltzmann equation for a symmetrical electrolyte becomes [32]= sinh Y .
Integrating once with the boundary conditions dY/dX
=
(1.13)
0 and Y
=
Y inthe midplane (equidistant from the surfaces with identical surface potentials) this gives
!-,;
dY
dX
2
=
-(2coshY - 2coshY ) sgn (Y ) •(1.14)
m m
A further integration leads to elliptic integrals and a numerical solution must be attempted. The final solution depends on the
boundary conditions invoked; viz. constant surface charge, constant surface potenti~l or the physically more realistic case of charge
regulation
[33,34].
In this latter case, neither charge nor potential remain constant during the interaction of the surfaces but theirvalues are determined by applying; for example, the law of mass action to the exchange of ions (charges) between the surface and the liquid.
The solutions to equation
(1.13)
yield the potential at any point between the interacting surfaces if the surface potential of anisolated double layer is known. From this one can calculate the energy of interaction or the force by equating the pressure at the midplane to the osmotic pressure p due to the accumulation of ions in this region given by
or
p
=
6nkTp
=
kT [ (n + - n + 0) + (n _ - n _ 0) ]=
kT[n+ +n_ -2n°]=
2n°kT(coshY -1)m
(1.16)
(1.17)
for a symmetrical electrolyte. The interaction free energy per unit
the force from that separation to infinity, where the energy of
interaction is zero [32].
Once again, the form of the repulsive force is masked by the
complexity of the equations and i t is therefore worthwhile to consider an approximate solution, valid for large surface separations(>> K- 1)
and (constant) high surface potentials (ze~ /kT >> 1)
0
E(D) (1.18)
where
y
0
=
tanh(ze~0/4kT) and Dis the surface separation. Thisrelation shows that the repulsion decreases exponentially with distance, with a decay length equal to K- 1, the Debye length, and that, since K is proportional to the square root of n°, the
exponential wins out over the factor n°K-1,leading to a decrease in force with increasing electrolyte concentration (at large surface
separations and for high surface potentials).
When applying double-layer theory to colloidal dispersions, i t is more appropriate to consider the Poisson-Boltzmann equation for two
spherical particles. An exact numerical solution to this equation has recently been published
l35];
here i t is sufficient to examine one approximate solution, valid for large values of KR (obtained by integrating equation (1.18))(1.19)
where R is the particle radius. This assumes that the surface potential remains constant during approach - letting the surface charge remain constant instead leads to an increased repulsion for
small surface separations. From equation (1.19) i t is readily
will lead to a decreased repulsion at all distances, provided
~odoes
not increase, and hence to the destabilization of a dispersion.
On the experimental side, early observations by Derjaguin and
Kussakov [36] on the thickness of films between solid surfaces and
hydrogen bubbles seem to constitute the first observation of
double-layer forces.
Qualitative observations were made by Tabor and Roberts
[37] in experiments
with
glass surfaces and polyisoprene hemispheres,
but direct force vs. distance measurements did not conclusively
confirm the accuracy of the double-layer theory (Gouy-Chapman model)
until the work by Israelachvili and Adams [6] on the forces between
mica surfaces in aqueous electrolyte solutions.
Subsequent
measurements (see Section 5.5) have confirmed the theory
-
for a range
of concentrations and ion valencies, and despite a number of
"refinements" to the theory in the form of finite ion size,
discreteness of charge, inner layers, etc. [38] no experimental
deviations from the basic Gouy-Chapman model have been detected.
This
is partly due to the fact that many of the corrections seem to cancel
each other, partly to the fact that at small distances, when such
corrections may be important, other effects due to solvent structure
become dominant.
The conclusions thus far are that the Gouy-Chapman
model of the double layer works extremely well and is in all cases
accurate within experimental error at long range (D
>
5 nm) but
at
short range, deviations,
when
observed are largely due to solvent
specific effects.
Such "structural" forces will be discussed in the
next
section.
1.4 FORCES DUE TO SOLVENT
STRUCTURE
from the solid state, the density profile around a molecule is oscillatory at short distances. The density profile is described mathematically by the distribution functions f(r). The single
particle distribution function f 1
(r)
is just the probability offinding a particle (molecule) in a volume element of the fluid, and i t is equal to the bulk density of the fluid - in other words, the
density of a fluid is independent of position. The two-particle distribution function f 2
(r
1
,r
2) measures the probability of findingone particle at
r
1 and a second at
r
2 , and i t is usually considered inthe form of the radial distribution function g2
(r
1
,r
2) , defined by[39]
(1.20)
This function gives the probability of finding a particle at a given distance from a reference particle at a fixed position. For spherical
particles, g2 depends only on the distance between the particles r, and as r tends to infinity, g2 must tend to unity (any position is equally probable). At short range, the maxima in the radial
distribution function indicate the positions of nearest-neighbour molecules, next nearest-neighbours, etc., and at intermediate
positions the small probability of encountering molecules is indicated by the minima.
The radial distribution function may be deduced experimentally from X-ray diffraction of liquids, and i t can be calculated
If one defines a quantity W by the equation
W
= -
kTZn
g2 (1.21)then W can be shown to be the potential whose negative gradient gives the mean force acting between any two molecules in the liquid, and i t is called the potential of mean force. If the radial distribution function is spatially oscillatory, then the potential of mean force
will also exhibit oscillations.
In an analogous manner, the presence of a solute molecule will
perturb the liquid structure around i t and the density profile of the solvent will exhibit spatially decaying oscillations. Letting the
radius of the particle (solute) increase, one has the case of a colloidal particle in solution, and, ultimately, as r~oo, a liquid against a flat wall.
The density distribution in a liquid against a solid wall also
shows oscillations decaying with distance away from the wall,
reflecting the "layering" of molecules close to a wall. Such density profiles have been studied theoretically using computer simulation
techniques (Monte Carlo and molecular dynamics) or integral equation methods. Computer simulations are essentially based on statistical
averaging of the properties of fluid atoms or molecules and as such provide comparison with both theoretical calculations and experiment. Given an intermolecular potential, usually a hard-sphere or Lennard-Jones type potential, one can calculate thermodynamic properties of the model system. Due to the time-consuming calculations, the size of the model system must be limited to a few hundred or so molecules, and
one wall enters the box again through the opposite wall. The Monte Carlo method is a multidimensional integration procedure in which
equations for thermodynamic properties are solved for a large number
vJ;
+k
+lv-
ro ~~ , -~ ~to
~ E ;_ ()...~olk"""""""'~
~~~-~~·cof configurations, generated at random. For each configuration, the energy is calculated and if i t is lower than for the preceding
configuration, i t is accepted. Configurations of higher energy are
not immediately rejected but subjected to further scrutiny. Average properties are ~alculated for a large number (105 -106) configurations
and the initial configurations are discarded to avoid any influence of the starting point.
In the molecular dynamics method Newton's equations of motion are
solved for all the particles in the system for a large number of configurations. The desired properties can be obtained by
time-averaging the contributions from acceptable configurations, or, with the molecular dynamics method, time-dependent properties can be
calculated. This latter advantage with the molecular dynamics method is partly offset by the fact that i t requires longer computing time.
Both of the above methods are exact, for the given model potential, provided enough configurations are used [39].
The density profile between two solid surfaces has recently been studied using the above methods. Because of the presence of two
constraining walls, the ordering effects are enhanced at small surface separations and one obtains oscillatory density profiles for
separations of up to 12 molecular diameters. One finds th~t the
amplitude of the oscillations increases with increasing fluid density and increasing wall-liquid molecule attraction.
It is intuitively reasonable that such an oscillatory density
calculations by Mitchell et al. [41] have predicted that the force
between solid surfaces in a hard-sphere fluid should be an oscillatory function of separation, and this has been confirmed by Snook and van Megen [42,43], who studied the interaction between solid surfaces in Lennard-Jones liquids using the Monte Carlo method. Their results may be summarized as follows: The force between two solids in a simple
(Lennard-Jones) liquid is oscillatory with surface separation,
alternating between attraction and repulsion and the magnitude of the
forces decays rapidly with surface separation. The oscillations
follow roughly the oscillations in the density profile and the
magnitude of this salvation force is large compared to the continuum
van der Waals force. The periodicity of the oscillations is close to
the molecular diameter, or Lennard-Jones 0.
Similar results were obtained earlier by Lane and Spurling [44]
and theoretical calculations by Grimson et al. [45] have also yielded
oscillatory salvation forces, for hard-sphere fluids. Even for non-spherical, dumbbell-shaped molecules, calculations indicate the
existence of such forces [46], although of reduced range and
magnitude. Recent simulations show that for model water too, the
density profile between two solid walls is oscillatory with distance
[47,48].
These results confirm that continuum van der Waals theory is a totally inadequate model for the force between solid surfaces in
liquids at small surface separations. Richmond [49] has shown how the
continuum van der Waals force is expected to dominate in the limit of large surface separations, where contributions to the force due to surface-induced liquid structure are negligible.
and no oscillatory density profile is found [50], presumably due to
the greater "fluidity" of the interface.
The first experimental confirmation of an oscillatory salvation
force were the measurements by Horn and Israelachvili [29], mentioned
at the end of Section 1.2.
Further, albeit less clear, evidence for
the breakdown of continuum theory has come from the measurements on
aqueous electrolyte solutions by Israelachvili and Pashley [6,51],
further discussed in Sections 5.1 and 5.6, and recent experiments on
the force between hydrophobic surfaces in
water
[52].
In this latter
case an additional attractive force was found and it is interesting to
note that a depletion of Lennard-Jones molecules close to a
non-interacting wall, at least for low fluid densities, had been
predicted by simulation studies [53].
Such a depletion would lead to
an attractive force between two surfaces.
1.5 OUTLINE OF THESIS
Previous, accurate measurements of the force between surfaces
have mainly been restricted to aqueous systems.
Due to the complexity
of water as a liquid, comparison with theories, based on much
simplified models, becomes very difficult and it is certainly
impossible to use the results with water to predict forces in other,
simpler, liquids.
An
alternative, and perhaps easier, approach, advocated by Ninham
[54,55] is to start
by
attempting to explain the forces found in
simple, non-polar liquids and
gradually
introduce
additional features
like
a
dipole
moment and
hydrogen-bonding.
In this
way,
it
is
hoped
to
achieve
both
a
complete
picture
of
the forces
in different liquids,
understanding of the very involved situation in water and aqueous
solutions.
Horn and Israelachvili have already taken the first step in this
direction, and the work presented in this thesis is a continuation and
extension of their investigations to cover a range of liquids, both
non-polar (Chapter 3) and polar (Chapter 5) as well as binary mixtures
(Chapter 4
-
the effect of water on the forces in non-polar liquids).
While most of the features of the forces found in these groups of
liquids are discussed separately at the end of each chapter, Chapter 6
contains a summary and a brief and rather speculative discussion on
the implications of these results for the stability of dispersions in
non-aqueous media - a rather poorly understood area of colloid
REFERENCES
1.
B.V. Derjaguin and L.D. Landau, Acta Phys.-Chim. USSR 14, 633
(1941).
2.
E.J.W. Verwey and J.Th.G. Overbeek, "Theory of the Stability of
Lyophobic Colloids", Elsevier, Amsterdam, 1948.
3.
H. Kallman and
M.
Willstatter, Naturwiss. 20, 952 (1932).
4. H.C. Hamaker, Rec. Trav. Chim. 55, 1015 (1936).
5.
I. Langmuir, J. Chem. Phys. 6, 873 (1938).
6.
J.N. Israelachvili and G.E. Adams, J. Chem. Soc., Faraday Trans. I
74, 975 (1978).
7. K. Norrish, Disc. Faraday Soc. 18, 20 (1954).
8.
T.W. Healy, A.
Homola, R.O. James and R.J. Hunter, Disc. Faraday
Soc. 65, 156 (1978).
9.
B.W.
Ninham,
Adv. Colloid Interface Sci. 16, 3 (1982).
10.
W. Drost-Hansen, in "Colloid and Interface Science", vol. I,
M. Kerker, R.L. Rowell, A.C. Zettlemoyer (eds.), Academic Press,
New York, 1977.
11. G. Peschel and K.H. Adlfinger, Z. angew. Physik. 31, 137 (1971).
12.
B.V. Derjaguin, N.N. Fedyakin and M.V. Talaev, in "Research in
Surface Forces", vol. 3, B.V. Derjaguin (ed.), Plenum, New York,
1971.
13.
H.C. Hamaker, Physica
i,
1058 (1937).
14.
J.H. de Boer, Trans. Faraday Soc. 32, 10 (1936).
15.
I.E. Dzyaloshinskii,
E.M.
Lifshitz and L.P. Pitaevskii, Adv. Phys.
10, 165 (1961).
16.
F. London, Z. Phys. 63, 245 (1930).
17.
J.
Mahanty
and B.W.
Ninham,
"Dispersion Forces", Academic
Press,
London, 197 6.
18.
D.J. Mitchell,
B.W. Ninham and
P.
Richmond,
Biophys. J. 13,
370
(1973).
20.
N.G. van Kampen, B.R.A. Nijboer and K. Schram, Phys. Letters 26A,
307 (1968).
21.
E.S. Sabisky and C.H. Anderson, Phys. Rev.
A!_, 790 (1973).
22.
D.E. Brooks, Y.K. Levine,
J.
Requena and D.A. Haydon, Proc. Roy.
Soc. A 347, 179 (1975).
23.
D. Tabor and R.H.S. Winterton, Proc. Roy. Soc. A 312, 435 (1969).
24.
J.N. Israelachvili and D. Tabor, Proc. Roy. Soc. A 331, 19 (1972).
25.
C.J. Coakley and D. Tabor, J. Phys. D 11, L77 (1978).
26.
L.R. White, J.N. Israelachvili and B.W. Ninham, J. Chem. Soc.,
Faraday Trans. I
72,
2526
(1976).
27.
J. Klein, Adv. Colloid Interface Sci.
16, 101 (1982).
28.
Ya.I. Rabinovich, B.V. Derjaguin and N.V.
Churaev,
Adv. Colloid
Interface
Sci.
16,
63
(1982).
29.
R.G. Horn
and J.N. Israelachvili, J. Chem.
Phys. 75, 1400
(1981).
30. M. Gouy,
J. Physique
.2_,
457 (1910).
31.
D.L. Chapman, Phil. Mag. 25, 475 (1913).
32.
D.Y.C. Chan, R.M.
Pashley,
L.R. White,
J. Colloid
Interface Sci.
77,
283 (1980).
33.
B.W. Ninham
and V.A. Parsegian, J.
Theor. Biol. 31, 405
(1971).
34.
D. Chan,
J.W.
Perram, L.R. White and T.W. Healy, J. Chem. Soc.,
Faraday Trans. I
71,
1046 (1975).
35.
B.K.C. Chan and D.Y.C. Chan, J. Colloid Interface Sci. 92, 281
(1983).
36.
B.V. Derjaguin and M. Kussakov, Bull. Acad. Sci. USSR
NS,
1119
(1937).
37. A.D. Roberts and D. Tabor, Proc. Roy. Soc. A 325, 323 (1971).
38.
D. Eagland, in "Water, A Comprehensive Treatise", vol. 5,
F. Franks (ed.), Plenum, New York, 1975.
39.
R.O.
Watts
and I.J.
McGee,
"Liquid State Chemical Physics",
wiley-Interscience, New York, 1976.
40.
T.L. Hill, "An Introduction
to
Statistical Thermodynamics",
Addison-Wesley,
Reading, Mass.,
1962.
42.
I.K. Snook and
W.
van
Megen,
J. Chem. Phys. 72, 2907 (1980).
43.
W.J. van
Megen
and I.K. Snook, J. Chem. Phys. 74, 1409 (1981).
44.
J.E. Lane and T.H. Spurling, Chem. Phys. Letters 67, 107 (1979).
45.
M.J. Grimson, G. Rickayzen and P. Richmond, Mol. Phys. 39, 61
(1980).
46.
M.J. Grimson and P. Richmond, J. Chem. Soc., Faraday Trans. II 76,
1478 (1980).
47.
B. Jonsson, Chem. Phys. Letters 82, 520 (1981).
48.
N.I. Christ
_
ou, J.S. Whitehouse, D. Nicholson and N.G. Parsonage,
Faraday Symp. Chem. Soc. 16, 139 (1981).
49.
P. Richmond, in "Microscopic Aspects of Adhesion and Lubrication",
J.M. Georges (ed.), Elsevier, Amsterdam, 1982.
50.
G. Rickayzen and P. Richmond,
·
in "Thin Liquid Films", I .B. Ivanov
(ed.), to be published.
51.
R.M. Pashley, J. Colloid Interface Sci. 80, 153 (1981).
52.
J.N. Israelachvili and R.M. Pashley, Nature 300, 341 (1982).
53.
F.F. Abraham, J. Chem. Phys. 68, 3713 (1978).
54.
B.W. Ninham, J. Phys. Chem. 84, 1423 (1980).
2.1 INTRODUCTION
CHAPTER 2
EXPERIMENTAL METHODS
The force measurements presented here were performed using the
apparatus developed by Israelachvili
[l],
based on earlier models byTabor and Winterton [2] and Israelachvili and Tabor [3]. This
instrument measures the force between two mica surfaces in a
crossed-cylinder configuration at surface separations ranging from several
microns down to contact. The surface separation is determined by
multiple-beam interferometry to within 0.1-0.2 nm and the force is
measured by monitoring the deflection of a leaf spring, on which one
of the surfaces is mounted. The method also permits the measurement
of the refractive index of the medium between the two mica surfaces
and yields information on surface deformations.
In this chapter, the apparatus together with the necessary
auxiliary equipment will be described. The experimental procedure
will be outlined and the techniques used to measure forces will be
discussed. The formulae used to convert the raw data into force and
distance values will be presented and finally the purification methods
used for the liquids will be described. Special attention will be
focussed on two points, namely the selection of glues used to mount
the mica sheets on supporting silica discs (Section 2.5), and the
derivation of some new formulae that permit accurate distance
2.2 DESCRIPTION OF APPARATUS
The force-measuring apparatus consists of a stainless steel chamber, of approximate volume 350 cm3, with a removable front plate
(see Fig. 2.1). The front plate has a number of inlets used for filling, draining and injection of liquids as well as passing gases through the chamber.
The mica surfaces are mounted on silica discs (A), with
cylindrically polished surfaces facing each other with the cylinder axes perpendicular to one another. The lower disc is mounted at the end of a leaf spring (B) which is rigidly clamped to one end of a double cantilever spring. This double cantilever spring (C), and thereby the lower mica surface, can be moved by the action of two
externally controlled micrometer shafts. The upper micrometer (D) is driven by a stepping motor and any motion is translated directly into a displacement of the lower mica surface relative to that of the
upper. This provides a coarse control of surface separation in
increments of about half a micron, with a total range of a centimetre. The lower micrometer shaft (E), driven by a synchronous motor, acts on the other end of the double cantilever spring through a
helical spring (F). The motion is thus reduced by the ratio of the spring constants [i.e. k (cantilever)/k (helical), usually about 1000], and the surface separation can thus be controlled to about
1 nm. The synchronous motor is connected to a potentiometer, which allows the calibration of surface displacement (see Sectioµ 2.9).
The upper silica disc is mounted at the end of a cylindrical piezoelectric crystal (G) and this provides the final control of
surface separation. By varying the potential across the piezoelectric
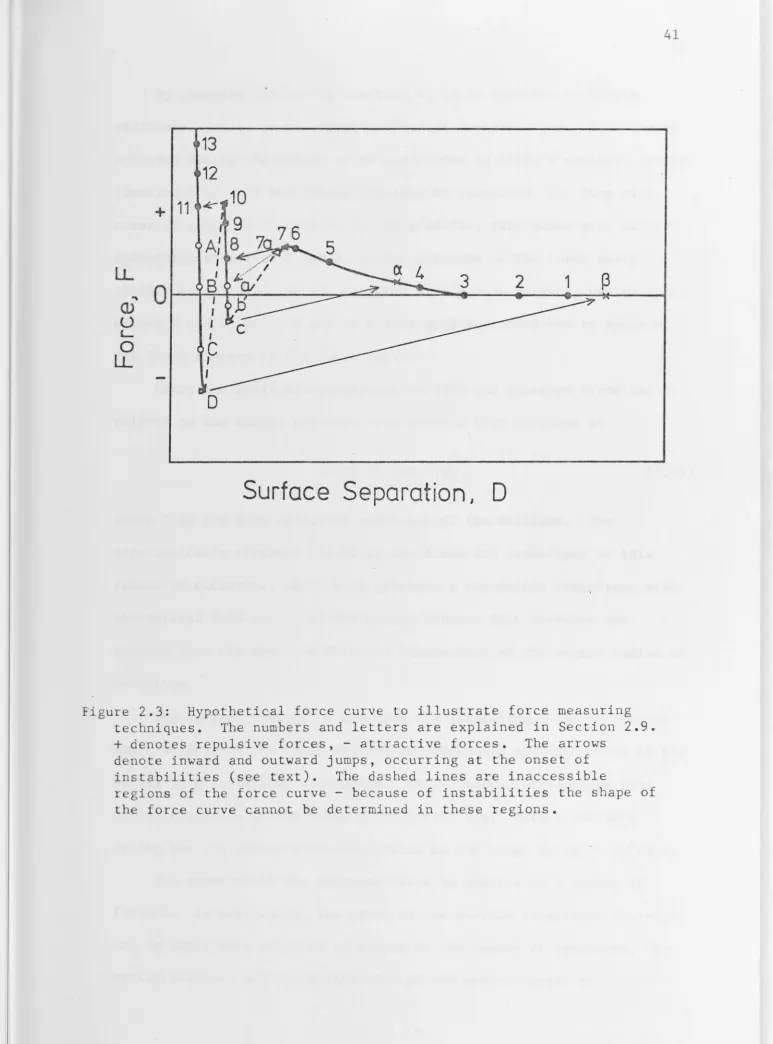
Figure 2.1: Cross-sectional view of the force-measuring apparatus. Approximate scale 1:1. A - silica discs mounted in
crossed-cylinder configuration; B - leaf spring (force-measuring spring); C - double cantilever spring; D - upper micrometer shaft, driven by stepping motor; E - lower micrometer shaft, driven by·
[image:33.801.6.779.20.1090.2]0.1 nm. Further detail on the apparatus can be found in Ref. 1.
The separation of the mica surfaces is measured by monitoring the
shifts of a series of interference fringes in a spectrometer. The
mica sheets are silvered on the back side and interference takes place
when white light is allowed to pass through the two sheets. The light
beam, from an ordinary tungsten lamp, enters the chamber through a
silica window in the bottom (H) and exits through a similar window at
the bottom of the piezoelectric crystal (I). It is focussed by a
microscope objective and directed via two prisms onto the slit of a
grating spectrometer (see Fig. 2.2). The interference fringes can be
observed visually through an eyepiece or photographed.
2.3 OPTIONAL ATTACHMENTS
The apparatus can be fitted with a number of optional attachments
for special purposes. The following is a brief list of those used in
these experiments.
i) A pair of heaters, fitted to a modified front plate. Together
with a thermistor, these allow the control and measurement of
the temperature in the measuring chamber and were used for one
experiment at elevated temperatures (Section 3.2).
ii) A spring of variable stiffness in place of the usual leaf spring
of fixed spring constant. Two types were used, a single and a
double cantilever spring which can be clamped at various
positions, permitting the spring constant to be varied by up to
three orders of magnitude. The double cantilever spring does
not t i l t when displaced, ensuring that the applied load is
normal to the surfaces. A variable spring was used for some
iii) A rigid support in place of the leaf spring. This has an
effective spring constant of 104 - 105 N/m and can be used when actual force measurements are not required (see Chapter 4). iv) A non-tilting spring in place of the leaf spring. As for the
double cantilever variable spring, the applied force acts normal to the surfaces and there is no lateral movement during vertical displacement of this spring, but the spring constant is fixed. This spring was used for some experiments described in Chapter 4. The non-tilting spring and the variable springs were
designed by Israelachvili.
2.4 PREPARATION OF MICA
Naturally occurring muscovite mica is unique in that i t can be cleaved into large, molecularly smooth sheets. The mica used in these experiments was obtained from Bihar, India.
The mica is cleaved by inserting a sharp pin or needle into the edge of a thick sheet and peeling off from the edge. With a bit of luck and a great deal of perseverance i t is possible to obtain large
(""' 10 cm2) areas of uniform thickness. To be useful, the mica should be 1-3 µm thick and this can be recognized by the clarity of the
interference colours observed in reflected (white) light. The
uniformity of the colour establishes the absence of cleavage steps in the mica. A suitable area is cut into smaller pieces(""' 1 cm2) with a white-hot platinum wire. The mica sheets are immediately placed on a freshly cleaved, thicker sheet of mica (the backing sheet) and are
27
The exposed side of the mica sheets is then silvered by vacuum
evaporation at,...., 2
xio-s
torr.
Anapproximately 45 nm thick layer of
silver is deposited.
The optimum amount of silver was determined by
observing the interference fringes of a number of mica sheets folded
over on themselves, with the silvered side out.
By weighing out
varying amounts of silver the weight of silver needed to give bright
and sharp fringes is readily established.
The mica is stored in a dessicator with silica gel as a drying
agent to prevent capillary condensation around the edges of the
sheets, which are rough from the cutting procedure and do not adhere
well to the backing sheet.
This fact, however, allows them to be
picked up again for the mounting procedure.
2.5 MOUNTING OF THE MICA SHEETS
The mica sheets are mounted on the supporting silica discs at the
start of an experiment (see Section 2.6) using a thermosetting glue.
The mica is held to the supporting silica discs by the strong,
adhesive forces resulting from good contact at the glue-silver and the
glue-silica interfaces respectively. When the glue melts and
then
sets, it faithfully contours any roughness on the silica
and
silver
surfaces and the mica sheets are held in place by van der
Waals
forces.
Because of the thickness of the glue layer, greater than that
of the mica, the mica sheets follow the (macroscopic) curvature of the
silica discs.
In principle a
great
number of compounds could
be
used
as glues.
A number of factors, however, limits the choice
drastically
and
indeed
one major
problem
was
to
find a glue suitable for work in
polar
characteristics are required for a compound to perform well as a glue: i) i t must be transparent;
ii) i t must be hard yet have a low melting point as excessive heat damages the silver layer on the mica sheets;
iii) it should have a low coefficient of expansion or contraction on setting, but in particular i t must not craze or form large
crystals on solidifying as this causes macroscopic surface roughness of the mica, which will follow the contour of the individual crystals;
iv) i t should be pure and inert, i.e. not dissolve or swell in the liquid to be studied. This rules out the use of any solvent-based glues;
v) i t should preferably wet the silica disc and silver layer.
The previously used glue, sym-diphenylcarbazide [4], exhibits the above properties but i t cannot be used in many organic liquids because i t dissolves. It is insoluble in aliphatic hydrocarbons but dissolves readily in, for example, benzene.
The epoxy resin 1004 (source: Shell Chemical Co.) has proved to be suitable for work in aqueous solutions but i t dissolves in many polar liquids and swells in aromatic hydrocarbons.
Attempts were made to use commercial glues such as an optical adhesive from Norland Products Incorporated, New Brunswick, N.J. This is a polymer which crosslinks and sets on exposure to ultraviolet
light. Despite initially promising results i t was found that
contamination of the liquid invariably results after a short time. Presumably some substance is dissolved from the glue and adsorbs to the mica surfaces in solution.
may be used to advantage even in some very polar liquids. The most suitable was glucose, which has a low melting point (150 °C) yet is fairly hard when solid. It does not form crystals on solidifying but sets into a transparent, glass-like solid. It can be used with any hydrocarbon, including benzene, as well as liquids like acetone and propylene carbonate. Unless the liquids are dried carefully, i t eventually picks up water, and becomes soft and tacky. It is hence not suitable for experiments with water in organic liquids (see Chapter 4).
Sym-diphenylcarbazide was the glue used for all non-polar liquids (see Chapter 3) except benzene. Glucose was used for benzene as well as acetone and propylene carbonate. The epoxy resin 1004 was used for methanol, even though i t swells slightly and becomes soft with time.
2.6 EXPERIMENTAL PROCEDURE
Before each experiment, the apparatus is dismantled and all parts that are exposed to the liquid, including the chamber itself, are
cleaned in analytical grade ethanol. The parts are left in ethanol overnight and then scrubbed gently with a soft brush. Each part is
then washed with a jet of filtered ethanol from a pressure rinser and blown dry with nitrogen, always handling i t with tweezers only. The apparatus is assembled, the entire procedure being carried out in a clean-air cabinet. Filtered, dry nitrogen is then passed through the apparatus for at least one hour to expel any residual ethanol.
protected mica surface. The mica sheets are pulled down onto the silica discs by the glue, these are then lifted off the hot-plate,
mounted in the apparatus, and the chamber is immediately closed.
Filtered nitrogen is then passed through the apparatus again, to expel water vapour and any other airborne contaminants.
The next step is to find a suitable contact position. By
observing Newton's rings in monochromatic light (from a sodium lamp)
one can check that the contact area is circular and that there is good adhesion, indicating clean surfaces and the absence of particles, mica flakes, etc. The upper surface can be moved or turned, by loosening the piezoelectric crystal mount, until a suitable contact position is found. By moving the upper surface parallel and then perpendicular to the cylinder axis of the lower silica disc, an entirely new contact area can be examined. The mount is then clamped rigidly in this position. The apparatus is then connected to the rest of the
experimental set-up and the interference fringes are observed, first at large surface separations. The surfaces are brought into contact and the contact wavelengths of the fringes measured. The contact adhesion is measured and the surfaces separated a large distance (~ 1 mm) after which the apparatus is filled with whatever liquid is to be used, or in some cases a small droplet is injected between the surfaces through the syringe inlet on the front plate.
2.7 INTERFEROMETRIC MEASUREMENTS
The mica sheets with the outer surfaces silvered, together with the intervening medium, form a symmetrical three-layer interferometer
in a spectrometer and appear as a series of "fringes of equal chromatic order" (FECO) [4,5].
The general equation for a symmetrical three-layer interferometer is
(21TUD] tan
A
=
( 1 -
r
2 ) sin ( 4 TIµ Y/
A
)
m
2 r - ( 1
+
r 2 ) cos ( 4 TIµ Y/A) '
rn
( 2 .1)
where
Y
is the thickness of the mica, r=
(µ - µ)/(µ +µ),where µm rn rn
is the refractive index of the mica andµ is the refractive index of the medium. ).._ is the wavelength of the fringe and Dis the surface
separation. Phase changes on reflection at ·the silvered interfaces and dispersive effects may be taken into account by including these terms in
Y
[4].
When the mica surfaces are in contact, D
=
0,
equation(2.1)
becomes
or
4 TIµ Y / A
=
n TI ;rn
n
t..
=
4µ Y/nn rn
n=l,2, ...
n=l,2, ...
(2.2)
(2.3)
This determines the contact wavelengths of the fringes as a function of fringe order n. As can be seen, the thinner the mica the greater the wavelength separation between the fringes.
If the mica surfaces are now separated a distance D, the fringes will shift towards longer wavelengths. Using an empirical relation
for the effects of dispersion and phase changes one can from
(2.1)
(
2nµD]
tan
A
=
(1+µ
2)cos[n(l-A
0J\
)J(l-A
0J\
01)] ±
(µ
2 -1)
'C
2
•
4)n
n
n
n-1
n
n
n
n-where the+ sign is for odd order fringes and the - sign for even
order fringes [l]. Hereµ=µ/µ, A
Oand A
Oare the contact
m
n
n-1
wavelengths of the nth and (n-l)th fringe respectively and A is the
n
wavelength of the nth fringe for a surface separation of D (see Fig.
2.2a,b).
The fringe order is calculated using the formula
n
=
1c OJF (\
0 - \o) ·
n-1 n
n-1
n '(2.5)
F ,....,
1.024 +1/n
n
valid for wavelengths close to the mercury green line at 546 nm [l].
The fringe order decreases towards increasing wavelength.
Equation (2.4) shows that the shifts of odd and even order
fringes have a different distance dependence.
This becomes clearer
when
'the
two approximate formulae, valid for D <<A, are compared
n
D
=
nF (\ - \
0)J2µ ;
n
n
n
m
n odd(2.6)
D
=
nF (\ - \
0)µ J2µ
2 •n n n m '