COMPARATIVE EVALUATION OF THE MICROGAP AT
THE IMPLANT-ABUTMENT INTERFACE WITH
PREMACHINED AND CUSTOMIZED LASER-SINTERED
COBALT-CHROMIUM ABUTMENTS
- AN IN VITRO STUDY
Dissertation Submitted to
THE TAMILNADU Dr. M.G.R. MEDICAL UNIVERSITY
In partial fulfillment for the Degree of
MASTER OF DENTAL SURGERY
BRANCH I
PROSTHODONTICS AND CROWN & BRIDGE
ACKNOWLEDGEMENT
Completion of this dissertation was possible with the support and encouragement
of several people .It is not a fair task to acknowledge all the people who made this
thesis possible with a few words. However I will try to do my best to extend my
appreciation to everyone who helped me scientifically and emotionally throughout
this study and made it an unforgettable experience for me.
I am extremely grateful to my Guide, Professor
Dr.N.S.Azhagarasan,M.D.S., Principal., Head of the Department, Department of Prosthodontics and Crown & Bridge, Ragas Dental College and Hospital,
Chennai, for his diligent encouragement, inspiration and constant motivation. His
encouraging suggestions in innovating the methodology with recent advancements
need a special mention. I am extremely grateful that he has guided me and has provided heartfelt support throughout my postgraduate programme which has
always driven the best out of me. I would like to thank him for building confidence
in me throughout my work. This work would not have been possible without his
exceptional guidance and with his personal attention. His patience and
perseverance had benefitted me in every facet of my study. The timely help and
encouragement rendered by him had been enormously helpful throughout the
period of my postgraduate study.I successfully overcame many difficulties. His
unflinching courage and conviction will always inspire me. It is to him that I
dedicate this work.
I also thank him for permitting me to make use of the amenities in the
I would like to express my real sense of respect, gratitude and thanks to my
Professor, Dr. K. Chitra Shankar M.D.S., for her guidance, constant support, backup and valuable criticism extended to me during the period of my study.
I sincerely express my gratitude from the core of my heart to Reader, Dr. Hariharan Ramasubramanian, M.D.S., for his valuable suggestions and his timely help which was enormously helpful throughout the period of my
postgraduate study.
I take this opportunity to say my heartfelt thanks to Reader, Dr. Vallabh Mahadevan, M.D.S., for the timely help, guidance and support without which my research would not have been possible.
I am also extremely indebted to my Professor, Dr Dr.S.Jayakrishnakumar M.D.S., for his inspiration, motivation, encouragement and personal attention which provided a good and smooth basis for the progress of the study.
I would also like to thank Professor, Dr. M. Saravanakumar, M.D.S., Reader, Dr Hariharan R, M.D.S., Dr. Vidhya, M.D.S, Lecturers, Dr.Manoj Kumar, M.D.S., Dr.Kamakshi, M.D.S., Dr.Mahadevan, M.D.S., Dr.Shameem, M.D.S., for their valuable suggestions and help given throughout my study.
I am obliged to Dr. Shivashankar M.D.S, Confident Dental lab, Bengaluru and his assistants, who have been a amazing help with my lab works.
gratitude to Dr .MJ. Thirunavukkarasu , for his valuable support in the statistical work.
Nobody has been more important to me in the pursuit of this project than
the members of my family. Words cannot express the feelings I have for my father
Mr.P Gunasekar, and mother Mrs. A. Shanthi, for their constant unconditional support both emotionally and financially. Special thanks to my brother Dr. G. Aravind,MD for his generous love and constant source of encouragement. I owe my thanks to my grandfather Mr. K. Ponnusamy 94 yrs for his unconditional love & support towards me.
A special acknowledgement goes to my colleague and friend Dr. Sethu raman R, who has been supportive in every possible way.
It would not be justifiable on my part if I do not acknowledge the help of
my seniors Dr. Revathi, Dr. Bhanuchander, Dr. Arul who was always there to guide and help me. I thank my colleagues Dr.Priyadarshini, Dr. A. Gayathree, Dr. Abinaya, Dr. Janani, Dr Aishwarya, Dr. Jensy, Dr. Maniamudhu, Dr. Samin, and other seniors and juniors for their criticism and continuous support throughout my postgraduate course.
I extend my thanks to my friends Dr. Veena , Dr. Poornima, Dr. Sachin, Dr. Keerthi, Dr. Aparnna, Dr. Karthik, Mr. Arun for their continuous support and love.
Last but not the least, I thank God for the blessings, courage and grace
CONTENTS
S.NO.
TITLE
PAGE NO.
1. INTRODUCTION
1
2. REVIEW OF LITERATURE
8
3. MATERIALS AND METHODS
23
4. RESULTS
38
5. DISCUSSION
57
6. CONCLUSION
68
7. SUMMARY
72
LIST OF TABLES
Table
No.
Title
Page No
1
Basic and mean microgap at the implant-abutment interface of Ti implants and Ti premachined abutments at point IA (Right side: a; Left side: a’) at the platform level (Group I)39
2
Basic and mean microgap at the implant-abutment interface of Ti implants and Ti premachined abutments at point IB (Right side: b; Left side: b’) at the platform level (Group I).40
3
Basic and mean microgap at the implant-abutment interface of Ti implants and Ti premachined abutments at point IC (Right side: c; Left side: c’) at the platform level (Group I).41
4
Basic and mean microgap at the implant-abutment interface of Ti implants and Ti premachined abutments at point ID (Right side: d; Left side: d’) at the internal connection level (Group I).5
Basic and mean microgap at the implant-abutment interface of Ti implants and Ti premachined abutments at point IE (Right side: e; Left side: e') at the internalconnection level (Group I).
43
6
Basic and mean microgap at the implant-abutment interface of Ti implants and Ti premachined abutments at point IF (Right side: f; Left side: f ’) at the internal connection level (Group I).44
7
Basic and mean microgap at the implant-abutment interface of Ti implants and customized laser-sintered Co-Cr abutments at point IIA (Right side: a; Left side: a') at the platform level (Group II).45
8
Basic and mean microgap at the implant-abutment interface of Ti implants and customized laser-sintered Co-Cr abutments at point IIB (Right side: b; Left side: b') at the platform level (Group II).46
9
Basic and mean microgap at the implant-abutment interface of Ti implants and customized laser-sintered Co-Crabutments at point IIC (Right side: c; Left side: c') at the platform level (Group II).
10
Basic and mean microgap at the implant-abutment interface of Ti implants and customized laser-sintered Co-Crabutments at point IID (Right side: d; Left side: d') at the internal connection level (Group II).
48
11
Basic and mean microgap at the implant-abutment interface of Ti implants and customized laser-sintered Co-Crabutments at point IIE (Right side: e; Left side: e') at the internal connection level (Group II).
49
12
Basic and mean microgap at the implant-abutment interface of Ti implants and customized laser-sintered Co-Crabutments at point IIF (Right side: f; Left side: f’) at the internal connection level (Group II).
50
13
Comparative evaluation of mean microgap at the implant-abutment interface at point A at the platform level for Group I & Group II (IA vs IIA).51
14
Comparative evaluation of mean microgap at the implant-abutment interface at point B at the platform level for Group I & Group II (IB vs IIB).15
Comparative evaluation of mean microgap at the implant-abutment interface at point C at the platform level for Group I & Group II (IC vs IIC).53
16
Comparative evaluation of mean microgap at the implant-abutment interface at point D at the internal connection level for Group I & Group II (ID vs IID).54
17
Comparative evaluation of mean microgap at the implant-abutment interface at point E at the internal connection level for Group I & Group II (IE vs IIE).55
18
Comparative evaluation of mean microgap at the implant-abutment interface at point F at the internal connection level for Group I & Group II (IF vs IIF).ANNEXURE I
METHODOLOGY- OVERVIEW
ANNEXURE
II
FIGURES
Fig. No. TITLE
Fig. 1 : Titanium dental implant, standard platform, internal hexagon 3.75mm diameter, 10 mm length
Fig. 2 : Premachined titanium abutment, standard platform, internal hexagon
Fig. 3 : Cobalt -chromium powder
Fig. 4 : Titanium dioxide spray for CAD/CAM scanning
Fig. 5 : Spirit level indicators
Fig. 6a : Putty consistency Polyvinylsiloxane impression material
Fig. 6b : Light body consistency Polyvinylsiloxane impression material
Fig. 6c : Dispensing gun
Fig. 6d : Auto mixing spiral
Fig. 7 : Clear autopolymerising acrylic resin
Fig. 8 : Aluminium oxide powder -110μm
Fig. 9 : Emery papers
Fig. 11 : Ethyl alcohol (100%)
Fig. 12 : Teflon holding device
Fig. 13 : Hex drive
Fig. 14 : Calibrated torque wrench
Fig. 15a : Metal cutting disc
Fig. 15b : Disc mandrel
Fig. 15c : Tungsten carbide burs
Fig. 16
: Rubber point polishing
Fig. 17 : Selective Laser Melting machine
Fig. 18 : Model Scanner
Fig. 19 : Dental surveyor
Fig. 20 : Sand blasting unit
Fig. 21 : Water jet powered sectioning machine
Fig. 22 : High speed lathe
Fig. 23 : Steam cleaner
Fig. 24 : Digital Ultrasonic cleaner
Fig. 25 : Dryer
Fig. 26 : Scanning Electron Microscope
Fig. 27a
: Custom-made stainless steel block
Fig. 27b : Line diagram of custom-made stainless steel block
Fig. 28b : Line diagram of custom-made stainless steel perforated metal receptacle
Fig. 29a : Filling of custom-made receptacle with polyvinyl siloxane
Fig. 29b : Making impression of stainless steel block with soft putty
Fig. 29c : Set impression with stainless steel block
Fig. 29d : Standardized silicone putty index
Fig. 30 : Scan body
Fig. 31 : Spraying of Ti02 spray on the scan body Fig. 32 : Attachment of scan body to implant
Fig. 33 : Scanning of the scan body
Fig. 34 : Scanned image in the “exocad” software
Fig. 35 : Matching of abutment to implant connection
Fig. 36 : Virtual design of implant abutment
Fig. 37 : Virtual design of the abutment in STL format
Fig. 38 : Building chamber in SLM
Fig. 39 : 40µm sprue created in the platform of building chamber
Fig. 40 : Laser sintering of abutments
Fig. 41 : Laser-sintered abutment before sprue detachment
Fig. 42 : Laser-sintered abutment after sprue detachment
Fig. 43 : Rubber point polishing in connection area
Fig. 45a : Single one stage connection with drive (Group I)
Fig. 45b : Single one stage connection with drive (Group II)
Fig. 46a : Connection of premachined abutments to the implants (Group I)
Fig. 46b : Connection of customized laser-sintered abutments to the implants (Group II)
Fig. 47 : Silicone putty index made parallel to the floor using spirit level indicators
Fig. 48 : Attaching the connected implant abutment assembly to the mandrel of surveying arm
Fig. 49 : Positioning of implant- abutment assembly in a silicone index
Fig. 50a : Pouring of clear acrylic resin into silicone putty index
Fig. 50b : Implant embedded in acrylic resin
Fig. 51a : Secured implant abutment assembly (Group I)
Fig. 51b : Secured implant abutment assembly (Group II)
Fig. 52 : Securing the resin block in the Teflon holding device
Fig. 53a : Torquing of abutment screw(Group I)
Fig. 53b : Torquing of abutment screw(Group II)
Fig. 54a : Retorquing of abutment screw after 24 hours (Group I)
Fig. 54b : Retorquing of abutment screw after 24 hours(Group II)
Fig. 55 : Sand blasting of the abutments
Fig. 56 : Complete embedding of implant-abutment assembly
Fig. 57a : Labelled test samples (Group I)
Fig. 58 : Marked reference line on resin block
Fig. 59 : Resin block secured on sectioning platform of water jet sectioning equipment
Fig. 60 : Water jet powered sectioning of test sample
Fig. 61a : Sectioned samples of Group I
Fig. 61b : Sectioned samples of Group II
Fig. 62 : Trimming of excess clear acrylic resin using high speed lathe
Fig. 63a : Cleaning and smoothening of sectioned test sample using silicon carbide emery paper (Group I)
Fig. 63b : Cleaning and smoothening of sectioned test sample using silicon carbide emery paper (Group II)
Fig. 64 : Steam cleaning of sectioned test sample
Fig. 65 : Ultrasonic cleaning of sectioned test samples
Fig. 66 : Sectioned test samples soaked in ethyl alcohol
Fig. 67 : Drying of test sample using hair dryer
Fig. 68a : Cleaned sectioned test samples (Group I)
Fig. 68b : Cleaned sectioned test samples (Group II)
Fig. 69 : Gold sputtering of test samples
Fig. 70a : SEM photomicrograph at lower magnification 7x (Group I)
Fig. 70b : SEM photomicrograph at lower magnification 7x (Group II)
Fig. 71a : SEM photomicrograph showing implant-abutment interface at 27x magnification (Group I)
Fig. 72 : Schematic CAD diagram showing implant-abutment interface with marked reference points.
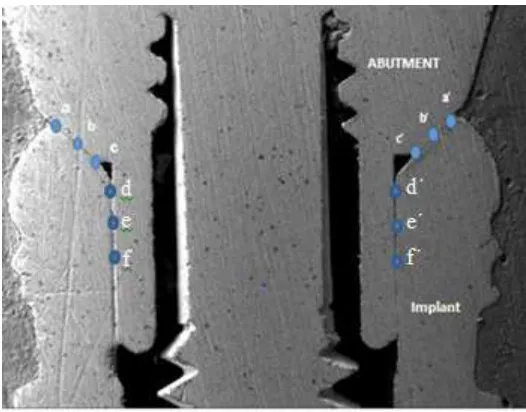
Fig. 73a : SEM photomicrograph with marked reference points (Group I)
Fig. 73b : SEM photomicrograph with marked reference points (Group II)
ANNEXURE III
List of SEM photomicrographs
Fig. 74 : Measurement of microgap at point a at 1000x (Group I)
Fig. 75 : Measurement of microgap at point b at 1000x (Group I)
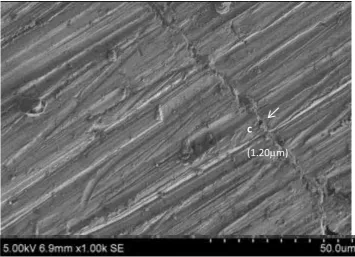
Fig. 76 : Measurement of microgap at point c at 1000x (Group I)
Fig. 77 : Measurement of microgap at point d at 500x (Group I)
Fig. 78 : Measurement of microgap at point e at 500x (Group I)
Fig. 79 : Measurement of microgap at point f at 500x (Group I)
Fig. 80 : Measurement of microgap at point a’ at 1000x (Group I)
Fig. 81 : Measurement of microgap at point b’ at 1000x (Group I)
Fig. 82 : Measurement of microgap at point c’ at 1000x (Group I)
Fig. 83 : Measurement of microgap at point d’ at 500x (Group I)
Fig. 84 : Measurement of microgap at point e’ at 500x (Group I)
Fig. 85 : Measurement of microgap at point f’ at 500x (Group I)
Fig. 86 : Measurement of microgap at point a at 1000x (Group II)
Fig. 87 : Measurement of microgap at point b at 1000x (Group II)
Fig. 88 : Measurement of microgap at point c at 1000x (Group II)
Fig. 89 : Measurement of microgap at point d at 500x (Group II)
Fig. 90 : Measurement of microgap at point e at 500x (Group II)
Fig. 91 : Measurement of microgap at point f at 500x (Group II)
Fig. 92 : Measurement of microgap at point a’ at 1000x (Group II)
Fig. 93 : Measurement of microgap at point b’ at 1000x (Group II)
Fig. 94 : Measurement of microgap at point c’ at 1000x (Group II)
Fig. 95 : Measurement of microgap at point d’ at 500x (Group II)
Fig. 96 : Measurement of microgap at point e’ at 500x (Group II)
ANNEXURE IV
GRAPHS
Graph No
Title
1
Basic and mean microgap at the implant-abutment interface of Ti implants and Ti premachined abutments at point IA at the platform level for Group I.2
Basic and mean microgap at the implant-abutment interface of Ti implants and Ti premachined abutments at point IB at the platform level for Group I.3
Basic and mean microgap at the implant-abutment interface of Ti implants and Ti premachined abutments at point IC at the platform level for Group I.4
Basic and mean microgap at the implant-abutment interface of Ti implants and Ti premachined abutments at point ID at the internal connection level for Group I.6
Basic and mean microgap at the implant-abutment interface of Ti implants and Ti premachined abutments at point IF at the internal connection level for Group I.7
Basic and mean microgap at the implant-abutment interface of Ti implants and customized laser-sintered Co-Cr abutments at the point IIA at the platform level for Group II.8
Basic and mean microgap at the implant-abutment interface of Ti implants and customized laser-sintered Co-Cr abutments at point IIB at the platform level for Group II.9
Basic and mean microgap at the implant-abutment interface of Ti implants and customized laser-sintered Co-Cr abutments at point IIC at the platform level for Group II.10
Basic and mean microgap at the implant-abutment interface of Ti implants and customized laser-sintered Co-Cr abutments at point IID at the internal connection level for Group II.11
Basic and mean microgap at the implant-abutment interface of Ti implants and customized laser-sintered Co-Cr abutments at point IIE at the internal connection level for Group II.point IIF at the internal connection level for Group II.
13
Comparative evaluation of mean microgap at the implant-abutment interface at point A at platform level for Group I & Group II (IA vs IIA).14
Comparative evaluation of mean microgap at the implant-abutment interface at point B at platform level for Group I & Group II (IB vs IIB).15
Comparative evaluation of mean microgap at the implant-abutment interface at point C at platform level for Group I & Group II (IC vs IIC).16
Comparative evaluation of mean microgap at the implant-abutment interface at point D at internal connection level for Group I & Group II (ID vs IID).17
Comparative evaluation of mean microgap at the implant-abutment interface at point E at internal connection level for Group I & Group II (IE vs IIE).ANNEXURE V
1
INTRODUCTION
Dental implants are being used increasingly important in the field of oral rehabilitation of partial or completely edentulous patients in both the anterior and posterior regions of the mouth with success rate > 90%.21,22,25,26,31,38,44,50,52,66 Their performance over conventional prosthetic reconstructions is based on the high percentage of implants with a non-eventful tissue integration phase and the broad range of prosthetic options without the need to prepare adjacent teeth resulting in prostheses with improved function and esthetics.43,66
Dental implant system consist of two components, that is, the endosseous implant(s) that is placed during the first surgical phase and the transmucosal abutment(s), which are later secured onto the implant(s) to support single or multi-unit prosthetic restorations.10,11,12,28,39,44,56 Despite our improved knowledge of the mechanisms of osseointegration, some failures still occur with implant restorations, which can be either mechanical or biological.5,8,22,26,29,30 Most of these failures can be attributed to the screw-joint mechanism between the fixture and abutment.20,29,31,36,52
2
should be according to the manufacturer’s recommended value and with the mechanical torque device to achieve and maintain the preload of the screw type connections. Although controlled torque application and altered screw designs have significantly improved performance, they have not eliminated the joint problem entirely.
Marginal integrity at the implant-abutment interface is important to reduce stress transfer to the bone, screw joint and to prevent movements at the deep implant- abutment interface.7,8,18,48 The efficiency of the implant abutment joint depends on several factors such as, component design, connection geometry between implant – abutment, mechanical adjustment between fixture and its set surface on abutments, mechanical and physical component properties and torque application.25,55,56 The success of this joint is directly related to attaining and maintaining a proper pre-load over time.3,8,31
3
oral forces deeper within the implant and protects the retention screws from excess loading and provides a strong and stable interface.42,45,51,55,56
Prosthesis supported by multiple implants has better load distribution and hence lower stress concentration at the implant- abutment interface compared to the single tooth prosthesis. Bending moments becomes more significant in single tooth prosthesis as the load distribution effect is absent.12,32,51,62 Prosthetic complications are more related to single tooth replacements, which include, abutment screw fracture, abutment screw loosening, and implant fracture. 8,43,51 In regular prosthetic protocols pre-machined components are used to reduce the risk of mechanical complications.61 Various studies have reported lower micro-gap and misfit values for pre-machined abutments than with cast-on abutments.15,16,37,38 In routine clinical practice, the restoring prosthodontist uses one particular system of implant and its original components including abutments and screws as supplied by that manufacturer.27,59 These components are thus from the original equipment manufacturer.9
4
enhance the microgap at the implant-abutment interface.23 The control of roughness on the mating surfaces at the implant-customized abutment interface could reduce afore mentioned complications by controlling the microgap.23 Hence the focus of research is directed towards these objectives. There are number of studies available on milled and cast abutments 18,37,52 but new manufacturing technique, for example, laser sintering2,23 are becoming available. On the other hand, laser sintering enables direct fabrication of prototypes for development of prostheses.2 A number of studies have evaluated the implant-abutment interface microgap for various implant systems and connection designs using premachined abutments.16,17,24,25,64 Published research evaluating the misfit between implant-abutment interface using customized laser-sintered implant-abutments are sparse.2,23 Currently studies investigating the interface microgap between implant and customized laser-sintered abutments are relatively few in the literature.
5
In light of the above, the aim of the present in vitro study was to comparatively evaluate the microgap at the implant – abutment interface with premachined and customized laser-sintered Cr-Co abutments using scanning electron microscopy (SEM). The null hypothesis of the present study was that there would be no significant difference in microgap at the implant-abutment interface with either premachined or customized abutments.
The objectives of the present study included the following:
1. To measure the microgap at the implant-abutment interface of Ti implants and Ti premachined abutments at point A at the platform level using scanning electron microscope (Group I).
2. To measure the microgap at the implant-abutment interface of Ti implants and Ti premachined abutments at point B at the platform level using scanning electron microscope (Group I).
3. To measure the microgap at the implant-abutment interface of Ti implants and Ti premachined abutments at point C at the platform level using scanning electron microscope (Group I).
4. To measure the microgap at the implant-abutment interface of Ti implants and Ti premachined abutments at point D at the internal connection level using scanning electron microscope (Group I).
5. To measure the microgap at the implant-abutment interface of Ti implants and Ti premachined abutments at point E at the internal connection level using scanning electron microscope (Group I).
6
7. To measure the microgap at the implant-abutment interface of Ti implants and customized laser-sintered Co-Cr abutments at point A at the platform level using scanning electron microscope (Group II).
8. To measure the microgap at the implant-abutment interface of Ti implants and customized laser-sintered Co-Cr abutments at point B at the platform level using scanning electron microscope (Group II).
9. To measure the microgap at the implant-abutment interface of Ti implants and customized laser-sintered Co-Cr abutments at point C at the platform level using scanning electron microscope (Group II).
10. To measure the microgap at the implant-abutment interface of Ti implants and customized laser-sintered Co-Cr abutments at point D at internal connection level using scanning electron microscope (Group II).
11. To measure the microgap at the implant-abutment interface of Ti implants and customized laser-sintered Co-Cr abutments at point E at internal connection level using scanning electron microscope (Group II).
12. To measure the microgap at the implant-abutment interface of Ti implants and customized laser-sintered Co-Cr abutments at point F at internal connection level using scanning electron microscope (Group II).
13. To compare the microgap at the implant-abutment interface between Ti implants and Ti premachined abutments with that of Ti implants and customized laser-sintered Co-Cr abutments at point A at the platform level using scanning electron microscope (Group I vs. Group II).
14. To compare the microgap at the implant-abutment interface between Ti implants and Ti premachined abutments with that of Ti implants and customized laser-sintered Co-Cr abutments at point B at the platform level using scanning electron microscope (Group I vs. Group II).
7
laser-sintered Co-Cr abutments at the most internal point C at the platform level using scanning electron microscope (Group I vs. Group II).
16. To compare the microgap at the implant-abutment interface between Ti implants and Ti premachined abutments with that of Ti implants and customized laser-sintered Co-Cr abutments at point D at internal connection level using scanning electron microscope (Group I vs. Group II).
17. To compare the microgap at the implant-abutment interface between Ti implants and Ti premachined abutments with that of Ti implants and customized laser-sintered Co-Cr abutments at point E at internal connection level using scanning electron microscope (Group I vs. Group II).
8
REVIEW OF LITERATURE
Vidigal et al (1995)64analyzed implant- abutment connection interface of five different types of titanium implants: Branemark system, Screw-vent, IMZ, TF and SR-Press by using Scanning electron microscope. A gap of 50µm was exhibited by the SR-Press and TF Implant, a gap of up to 150µm, signified an important role in accumulation ofbacterial plaque in the oral cavity. Thereby, concluded that a good fit of implant-abutment interface will not only avoid bacterial growth however, helps the patient for a better oral hygiene.
Dellow et al (1997)19investigated scanning electron microscope analysis of the interfacial fit of interchanged components of four dental implant systems: Southern Implant system, Branemark, Swede-vent, and Steri-OSS. The analysis reported vertical and horizontal discrepancies at the outer circumference of implant – abutment interface. From the study analysis, it was established implant system abutments are compatible and the accuracy of each component connects with or exceeds the standards set by the original Swedish (Branemark) system. Small microgap measurements were comprehended between implant – abutment interface indicating good machining tolerant when various systems are interchanged.
9
vertically from 0º, 5º, and 10º to 15º.It was confirmed that as the implant / abutment gaps decreased, the maximum x ray tube angulations should be between 5 and 10 degree.
Guimaraes et al (2001)31 assessed the implant- abutment marginal fittings in terms of tightening torque, bacterial micro leakage, abutment design, conical degree and occlusion. Tightening torque is an important factor to improve mechanical and biological properties of the implant and abutment interface. Scanning electron microscopy revealed a marginal gap of 5mm and 45mm, hence proving an efficient method.
Broggini et al (2003)14assessed the changes in abutment timing (submerged vs. non-submerged two-piece implants) connection or the presence of a microgap (two-piece, non-submerged implants vs. one-piece non-submerged implants) affect the composition of inflammatory cells adjacent to the implants. Increase in the inflammatory cell content may due to the adhesion and proliferation of bacteria on the biofilm found at the implant-abutment gap during soft tissue manipulation for prosthetic component installation.
10
fixture by a screw. These implant – abutment assemblies were embedded in liquid unsaturated polyester and cross sectioned using grinder polishing unit. Finally, specimens were analyzed for fit between implant/ abutment/ Screw interfaces. The study concluded that implant/Abutment/Screw connection interfaces of internal connection systems made in Korea were in good condition and materials, mechanical properties, quality of milling differed depending on the manufacturing companies.
Coelho et al (2007)17 determined the Cross-Sectional analysis of the implant abutment interface and assessed the implant- abutment gap of two piece screw connected external hexagon implant system as a function of radius. Under an optical microscope, the series of micrographs were linked through computer software and the implant-abutment gap measurements were made along the gap region. This adaptation as a function of a radius is of vital importance and precisely predicting the mechanical influence of implant-abutment gap distances in any implant system resulting in an improved connection design.
Kano et al (2007)36determined the classification system to measure the implant-abutment microgap based on the horizontal and vertical microgap of the implant-abutment interface in four groups of abutments using external hexagon implants. Machined titanium abutments, premachined palladium abutments cast-on with palladium alloy, plastic burnout abutments cast with nickel chromium alloy, and plastic burnout abutments cast with cobalt chromium alloy were utilized as abutments. Under the optical microscope observation, the results showed a horizontal misfit greater than vertical misfit in all groups including the machined group.
11
external hex implant-abutment interface with internal anti rotation configuration. Marginal fit and the size of the microgap at the implant- abutment interface were measured by scanning laser microscope and Scanning electron microscope. There were mean vertical discrepancy ranging from 22.6 to 62.2µm, while horizontal discrepancy ranged from -27.1 to 16.0µm. Microgap values of all I-A interfaces assessed in this study ranged from 2.3 to 5.6µm. SEM images of implant-abutment interface suggested no relationship between the geometrical factors and the type of anti-rotation configuration.
Yuzugullu et al (2007)65determined the implant-abutment interface of alumina and zirconia abutments after dynamic loading. Aluminum oxide, zirconium oxide, and titanium abutments were manufactured from Procera system and were connected to regular platform implants secured in a 30 º inclined plane. Then subjected to mechanical testing with the load between 20 and 200 N at 1 Hz for about 47.250 cycles. The measurements of micro gaps at the implant-abutment interface from the labial, palatal, mesial and distal surfaces of each specimen were undertaken by SEM prior to and after the experiments. The study resulted that after the dynamic loading ceramic abutments can withstand functional forces like conventional titanium abutments.
12
obtained in the study revealed that even when using components and implants of the same manufacturer, gaps of 0 to 15.267µm can be found at the implant-abutment interface. According to the measurements obtained, the smallest gaps were found respectively in: a) Type i abutments of Neodent system; b) Type ii abutments of Sterngoldimplamed system; c) Type iii abutments of Conexao system.
Baixe et al (2010)4 reviewed the microgap between Zirconia abutments and titanium implants of Four systems (Procera Zirconia, Cercon Balance anterior, Zirdesign, and Straumann Cares Ceramic). Microgaps between I-A assemblies of cut sections were analyzed by Scanning electron microscope. The microgap region consisting of first 100µm from the outer surface observed at low magnification and measurements were made on images at the highest magnification. They concluded that the mean gap was larger for flat-to-flat connection systems compared to internal connection system with conical interface.
13
Cunha et al (2010)18 compared the fit accuracy between procera custom abutments and three implant systems. Twenty four zirconia procera abutments were produced using CAD/CAM and compared with 3 implant systems such as Nobel Biocare, Sistema de implantes, Conexao sistema de protesa. Measurements of microgap were measured using scanning electron microscope. They concluded that the association of procera abutment with other implant systems different from its manufacturer demonstrated significant alteration of vertical misfit at implant-abutment interface.
Moraes et al (2010)47 determined the fit accuracy between procera custom abutments and three implant systems: Noble biocare group, SIN Experimental group, Conexao Experimental group. The Interface between implant and abutment viewed under SEM analysis at 6 measuring sites on each sample. A significant alteration of vertical misfit at implant-abutment interface was evaluated between the procera Zirconia abutment and other implant systems different from its manufacturer.
14
presented better vertical misfits than premachined cast on abutments for external hex implant connections for both before and after loading analysis. Cyclic loading did not influence the vertical misfits of premachined abutments with internal and external hex connections. However, it increased the vertical misfit of premachined cast-on external hex abutments and premachined octagonal internal connection abutments.
Dittmer et al (2011)20 did a comparative invitro study of six implant- abutment connection designs and examined regarding load bearing capacities and failure modes. Five implants of Astra Tech, Bego, Camlog, Friadent, Nobel Biocare and Straumann were embedded in stainless steel tubes using polyurethane, for 30 specimens. Specimens were loaded under 30º with respect to implant axis in a universal testing machine using test setup according to ISO 14801. Failure was indicated by load drop of 100 N in force. The study concluded with implant – abutment connection design has a significant influence on load bearing capacity and failure mode of implants; however all implant – abutment connection designs can withstand clinically relevant forces.
Meleo et al (2012)45 explored the fixture-abutment connection surface and microgap measurements of 3 implant connection systems like Ankylos connection, Staumann connection, Bicon connectionby employing the 3D Micro-tomographic technique. The results depicted a non-devastating approach without exposing the small radio opaque object to any particular chemical treatment at a few micron high resolutions. Overall concluding the geometrical link of the fixture-abutment connection encroaches on the mechanical properties of an implant system.
15
connections between non-original abutments connected to one of the original implants. The study wrapped up with the conclusion that the non-original abutments differ in design of the connecting surfaces and material demonstrates higher rotational misfits. Therefore, these differences may result in unexpected failure modes.
Rismanchian et al (2012)52evaluated the microgap size and microbial leakage in the connection area of four different abutments to ITI implants. Bacterial leakage were assessed by inoculating bacterial suspension and assessed at different times. The size of microgap of four randomized locations was then measured by scanning electron microscope. They concluded that solid and synocta abutments can significantly decrease the microgap size. However, cast on abutments do not show a significant difference in terms of microgap compared with castable abutments. Micro leakage in the connection area is comparable for these four abutments.
16
suggests that, for the parameters evaluated in this study, the alternative brand abutment is compatible with all three systems.
Baldassarri et al (2012)6evaluated the marginal accuracy using scanning electron microscopy, of three implant-ceramic abutment configurations and one implant titanium abutment configuration. Nobel Biocare replace, Biomet3i, Biomet3i Nanotite Tapered certain implants were the implant systems studied. Using CAD-CAM technology, three different custom-made zirconia abutments and custom-made Ti abutments (control) were fabricated. Implants and abutment connection is made and subjected to scanning electron microscopic analysis. It was concluded that, compared to all implant- zirconia abutment configuration, the implant-titanium abutment connection showed significantly better fit. Gap distance measured only at the outer circumference of the Implant Abutment Junctions (IAJ) is the only limitation of this study.
17
values observed in all cases fell within limits of clinical acceptability. No significant results seen. Mechanical torque application improved outcomes. There is compatibility and clinical possibility between implants and abutments of different brand and so of their combination.
Hamilton et al (2013)32compared the fit of titanium CAD-CAM abutments using scanning electron microscope with prefabricated abutments on five different implant types (Branemark system, Noble Replace, AstratechOsseoSpeed, Straumann Bone Level, and Straumann Standard Plus). The samples were embedded in epoxy resin, sectioned longitudinally, and polishing of the samples is done. Measurement and values of Microgaps between the implants and abutments at the connecting flanges and internal features were calculated. It was concluded that, compared to the prefabricated abutments, CAD-CAM abutment system appeared to have a comparable fit.
Neves et al (2014)48compared the misfits after casting and soldering procedures in external hexagonal implants and their UCLA abutments at implant-abutment interface. Three unit fixed partial implant supported bridge is used for the analysis. The SEM analysis is made. They concluded that, after casting procedure, pre machined abutments containing Ni-Cr-Ti alloy exhibit better mechanical properties. The horizontal misfit’s values for most of the abutments before and after the soldering procedures were within acceptable limits. Application of soldering didn’t result in significantmisfits, casting procedure resulted in increase of vertical misfits.
18
images in large angulations than X-ray. But the thicker (> 2mm) layer of soft tissue affects the sensitivity of gap detection by OCT. Nevertheless, OCT is a most useful tool to evaluate implant-abutment interface non-destructively as there is no X-ray exposure.
BeriBeri et al (2014)11 evaluated in vitro leakage at implant- abutment interface using Rhodamine B of osseospeed implants connected to original and compatible abutments. Higher solubility in water and reaction with photo-generated oxyradicals makes Rhodamine B an interesting marker. Titanium design, Natea, Dual, Implant were the compatible abutments used. With the help of spectophotometric analysis, the inner volume of each implant-abutment connections was calculated and leakage was detected for each group at different time intervals. It was concluded that, when compared to the use of abutment and implant from same manufacturer, the use of compatible abutment components with original Astra Tech implants showed significant leakage.
19
roughness of 29µm, sintered abutments showed a blurred but functional connection with roughness of 115µm, and cast abutments showed with loss of axial symmetry and roughness of 98µm. It concluded with the milled components were smoother than the cast or sintered components and correlation seen between surface roughness and microgap width.
Gill et al (2014)28 evaluated with the help of cyclic loading, the micro gap size and fatigue behavior of external and internal connections. It was concluded that the internal connections had a smaller micro gap compared to the external ones. The fatigue behavior with the superior results was presented by the external hexagon interface compared to the internal hexagon interfaces. Higher fatigue life of external hexagon interface is due to the size of the resistant action and higher area than the internal, which produces better loaddistribution
Suttin Z et al (2014)60studied the seal performance of aftermarket abutments,which was connected to BIOMET 3i T3 with DCD. The aftermarket abutment and screws for the study came from 3 manufacturers (KOMP, Medentika and IPD). Under dynamic loading conditions, the performance of assemblies was assessed. No statistically significant differences in seal strength. A significant difference between each of the after-market components and BIOMET 3i OEM components was found. The average load required to breach the seal was 63%, 60% and 52% lower respectively for the KOMP, Medentika and IPD abutments than the systems assembled with the BIOMET 3iabutments.
20
implant leakage, the impact of dynamic loading on the implant-abutment interface. Implants such as Astratech, Biomet3i, NobelBiocare were evaluated for leakage. Both static and dynamic conditions between three groups leakage was assessed. It was concluded that compared to dynamic conditions, implants leaking under static conditions had increased potential for bacterial leakage. Best performance was given by Implants with a flat-to-flat interface and internal hexagonal mating surfaces showed with regard to leakage under both static and dynamic conditions.Promising technique for assessing the overall implant system leakageresistance is GEPT.
Bajoghli et al (2016)5 evaluated the bacterial leakage and microgap along implant-abutment connection in different implant systems. 28 implants in three groups were used 10 zimmer with conical configuration of 8 degrees, 10 dentium with conical connection of 11 degrees, 8 test samples with conical connection in sixteen degrees were used. Microleakage of E.coli was assessed and microgap was measured using scanning electron microscope in four different points. It was concluded that Microleakage exsited in all three groups. Although there was difference in microgaps between three groups, but Microleakage was not statistically significant.
21
increases as torque augmented. Increase in the fit (contact) of the implant-abutment interface is due to the higher insertion torque values in a conical internal connection.
Sacrano et al (2016)53 evaluated the implant-abutment contact surfaces and microgap measurements of different implant connections under 3D x-ray microtomography. A total of 40 internal connection implants were used in this study, 10 were screw retained internal hexagon design, 10 were morse cone taper internal connection and 10 were screw tri-lobed connection. In both the morse cone internal connections, there was no separation of implant-abutment in the conical area, and there was an absolute congruity without any microgaps between abutment and implant. They concluded that different types of implant-abutment joints are responsible for the differences in bacterial penetration.
22
better fit than the nonoriginals.
23
MATERIALS AND METHODS
The present in vitro study was conducted to comparatively evaluate the microgap at the implant-abutment interface with premachined and customized laser-sintered Co-Cr abutments using scanning electron microscope (SEM). The following materials, instruments, equipment and methodology were employed:
Materials used for the study:
Titanium dental implant, standard platform, internal hexagon,3.75mm diameter,10mm length (ADIN Dental Implants., Israel) (Fig. 1)
Pre-machined titanium abutment, standard platform, internal hexagon (ADIN Dental Implants., Israel) (Fig. 2)
Cobalt-chromium powder (Kobalt chrome pulvar wirobond c+) (Fig.3)
Titanium dioxide spray (Easy scan) (Fig. 4)
Spirit level indicators (Jinhua Hengda tools., China ) (Fig. 5)
Polyvinylsiloxane impression material (Aquasil, Dentsply, Germany) (Fig. 6a, 6b, 6c, 6d )
Clear autopolymerising acrylic resin (RR Cold Cure., DPI, India) (Fig. 7)
Aluminium oxide powder, 110μm (Korox, Alpha bond, Australia) (Fig. 8)
24
Distilled water (Merck & Co., Mumbai INDIA ) (Fig. 10)
Ethyl alcohol 100% ( Merck & Co., Mumbai INDIA ) (Fig. 11)
Instruments used for the study:
Teflon holding device (CIPET, Guindy, Chennai) (Fig. 12)
Hex driver (ADIN Dental Implants., Israel) (Fig. 13)
Calibrated Torque wrench (ADIN Dental Implants., Israel) (Fig. 14)
Metal cutting disc and mandrel (Dentorium., New York, U.S.A) (Fig. 15a, 15b)
Tungsten carbide metal trimming burs (Edenta., Switzerland) (Fig. 15c)
Rubber polishing point (Fig. 16)
Equipments used for the study:
Selective Laser Melting machine (SLM) ( SLM 125HL Solutions GMbH, Germany) ( (Fig. 17)
Model scanner (Maestro 3D Easy Dental scan, Pontedera (pisa), Italy) (Fig. 18)
Dental surveyor (Saeshin Precision Ind. Co., Korea) (Fig. 19)
Sand blasting unit (Delta labs, Chennai, India) (Fig. 20)
Water jet powered sectioning machine (Germany) (Fig. 21)
High speed lathe (Demco, California, U.S.A) (Fig. 22)
25
Digital Ultrasonic cleaner (Beijing Ultrasonic Co., China) (Fig. 24)
Dryer (Panasonic corporation made in Thailand) (Fig. 25)
Scanning electron microscope – (EVO MA 15, CARL ZEISS pvt.ltd.UK) (Fig. 26)
Description of water-jet powered sectioning machine (Fig. 21)
26
LINE DIAGRAM OF WATERJET MACHINE
Description of scanning electron microscope (Fig. 26)
Scanning Electron Microscope (SEM) (EVO MA 15) is an analytical electron microscope of choice for users offering the leading imaging and analysis solution in materials Analysis. With a motorised 5 axis stage with large X,Y and Z travels, variable pressure capability as standard and easy to use SmartSEM software, it offers a perfect imaging solution in different fields.
27
charge on the surface, reducing the image quality. One way to improve image quality is to sputter coat the sample with a conductive material like gold to give the electrons a path to leave the sample. The image on the monitor gets captured using SmartSEM software and was then transferred to the computer.
28
METHODOLOGY
The methodology adopted in the present study is described under the following sections:
I. Fabrication of custom-made stainless steel block and receptacle
II. Obtaining silicone putty index using stainless steel block and receptacle
III. Fabrication of customized laser-sintered Co-Cr abutments IV. Connecting implant abutments to implants and grouping
V. Embedding of implant-abutment assembly in the acrylic resin VI. Sectioning of test samples using water jet sectioning machine VII. Preparation of sectioned test samples for SEM analysis
VIII. Obtaining SEM images of test samples at the implant-abutment interface
IX. Measurement of microgap at the implant-abutment interface on SEM images
29
I. Fabrication of custom-made stainless steel block and receptacle:
(Fig. 27, 28)
A stainless steel cuboid block of dimensions 27mm x 27mm x18mm (Fig. 27a & 27b) and a stainless steel, perforated metal receptacle of dimensions, 40mmx 50mm x 40mm, (Fig. 28a & 28b) were fabricated. These were used for creating a uniform mold space in the putty index of standardised dimensions.
II. Obtaining silicone putty index using stainless steel block and
receptacle: (Fig. 29a-d)
30
31
loaded into the canister where a layer of Co-Cr powder was uniformly spread with a powder levelling roller, across the platform. The laser beam scans, heats and fuses the sequential and simultaneous layering of Co-Cr powder during sintering. Laser sintering (Fig. 40) takes place for 31/2 hrs until the abutment was completed to set dimensions. Once the laser sintering was complete, the software was set for “homing” to increase the oxygen content to 16%. Then the lid was opened and the platform bed with the abutments were retrieved (Fig. 41). Further, the abutment sprues were cut (Fig. 42) and the connection area of the abutment was finished with rubber point polishing (Fig. 43). Thus ten customized abutments were fabricated such that it has similar geometry, connection design and dimensions with that of premachined abutments (Fig. 44)
IV. Connecting implant abutments to implants and Grouping: (Fig. 45- 46).
Twenty titanium implants of 3.75 mm diameter, 10mm length (ADIN Dental Implants, Israel) with standard platform, internal hexagon connection design (Fig. 1) were used in this study.
In the present study, twenty abutments were used. Of these, ten abutments were premachined (ADIN Dental Implants, Israel) and ten abutments were customized using the laser-sintering technique.
32
the abutment screw with the hex driver (ADIN Dental Implants, Israel) (Fig. 45a & 45b).
Based on the type of abutment used, the implant-abutment assemblies were grouped into Group I and Group II. Group I comprised of premachined abutments connected to their respective implants (n=10) (Fig. 46a) and Group II comprised of customized laser-sintered Co-Cr abutments connected to their respective implants (n=10) (Fig. 46b).
V. Embedding of implant-abutment assembly in the acrylic resin:
(Fig. 47 - 57).
In the present study, the implant-abutment assembly was embedded in the putty index into the acrylic resin in the following manner:
33
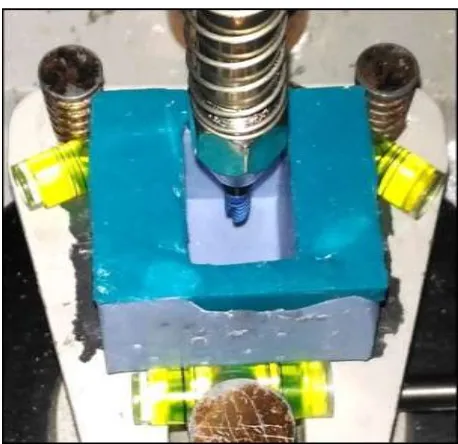
The putty index was filled with auto polymerizing clear acrylic resin (Cold Cure, DPI, India) (Fig. 8) up to the crest module of the implant and then allowed to polymerize (Fig. 50a & 50b). This was left undisturbed during setting; the resin block was removed from the index and was numbered (Fig. 51a & 51b). The resin block was secured in the custom-made Teflon holding device (Fig. 13) with the help of a screw (Fig. 52). The hex driver (Adin Dental Implants., Israel) (Fig. 14) was connected to the torque wrench (Adin Dental Implants., Israel) (Fig. 15) and the abutment screw was torqued to 35Ncm as recommended by the manufacturer (Fig. 53a & 53b). The Teflon holding device resists the rotation of the resin block during torquing of the abutment screw. The abutment screw was retorqued after twenty four hours to prevent screw loosening and to ensure proper adaptation between the implant-abutment interfaces (Fig. 54a & 54b).
Stage II:
In the second stage, the abutment over the implant was completely embedded into the auto polymerising resin.
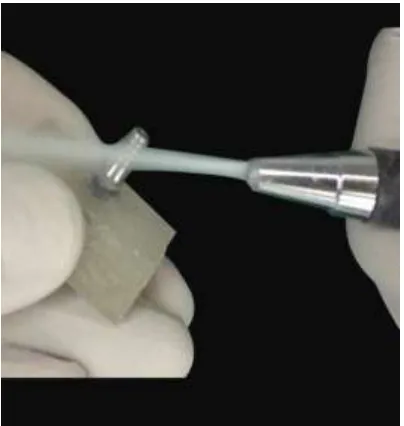
To facilitate retention of the abutment within the resin matrix, the abutment was initially sand blasted using alumina particles of 110µm grit size (Fig. 9) to produce a uniformly roughened surface (Fig. 55).
34
space of silicon putty index and allowed it to cure completely overnight (Fig. 56).
The resin block with the implant-abutment assembly was removed from the Teflon holding device and was reseated into the putty index. Clear auto polymerising acrylic resin was filled into the index to embed the implant-abutment assembly to cover the implant-abutment screw access. The resin block was allowed to cure completely overnight. In a similar manner, all the twenty implant-abutment assembly (Group I and Group II) were embedded in the acrylic resin.
The embedded implant-abutment assembly test samples were numbered individually and labelled for group I as GI to GI 10 (Fig. 57a) and for group II as GII to GII 10 (Fig. 57b).
VI. Sectioning of test samples using water jet sectioning machine:
(Fig. 58- 61)
35
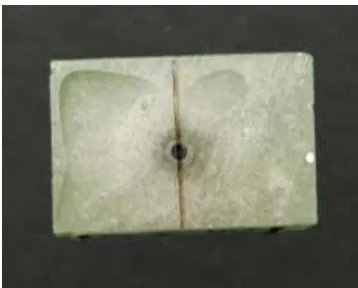
area to be sectioned. Water mixed with abrasive agents was focused on the marked area of sectioning using the nozzle. The test sample was sectioned under 3500 bar pressure by using water and abrasive (Fig. 60). The sectioning was done vertically along the long axis of implant-abutment assembly using the reference line marked. Similarly, all the twenty test samples were sectioned (Fig. 61a, 61b)
36
then stored in an air-tight container until SEM analysis to avoid further contamination.
VIII. Obtaining SEM images of test samples at the implant-abutment
interface: (Fig. 69-71)
The test samples were gold sputtered (K650 sputter coater, Quorum Technologies), prior to SEM procedures to make the samples more electro-conductive, since SEM uses electrons and creates higher magnification and resolution images (Fig. 69)
The implant-abutment interface of each test sample was analysed under Scanning electron microscope (EVO MA 15, CARL ZEISS pvt.Ltd.UK) (Fig. 27) at 10 kV acceleration voltages. Images were obtained at different magnifications such that, the implant-abutment interface area of each test sample could be visualised either under a lower magnification (Fig.70a, 70b) or a specific area could be visualised under suitable higher magnifications in separate images (Fig. 71a, 71b) to aid in accurate measurement of the interface microgap.
IX. Measurement of microgap at the implant-abutment interface on SEM
images: (Fig. 72-73)
37
sample were obtained. In this software, the SEM images were installed into the software file. The known distance, pixel, unit of the specific SEM images was transferred to the measuring scale of the software. The microgaps were measured with the linear measuring scale of the software. For each sample, microgap measurement at the implant-abutment interface at the platform and internal connection levels were measured in twelve different points (Fig. 73a & 73b).
X. Data tabulation and statistical analysis
The basic microgap values at the platform level and internal connection level were measured and tabulated using Microsoft Excel 10 (Microsoft, USA) and the mean and standard deviation were calculated. For each test sample, the mean microgap was calculated for a particular point (at platform level and internal connection level) by averaging the microgap measurements obtained on the right and left sides for that point. From each sample mean, the overall mean microgap at that particular point was calculated.
ANNEXURE I
METHODOLOGY OVERVIEW
Fabrication of custom made stainless steel block and receptacle
Obtaining silicone putty index using stainless steel block & receptacle
Connected standard Ti premachined abutments to implants (n=10) (Group I)
Connected customized laser-sintered abutments to implants (n=10) (Group II)
Connecting implant abutments to implants and grouping
Embedding implant-abutment assembly in the acrylic resin
Sectioning of test samples using water jet sectioning machine Preparation of sectioned test samples for SEM analysis
Measurement of microgap at the implant-abutment interface on SEM images
Data tabulation and statistical analysis Fabrication of customized laser sintered Co-Cr abutments
ANNEXURE II
MATERIALS
Fig.1: Titanium dental implant, standard platform, internal hexagon
3.75mm diameter, 10 mm length
Fig.2: Premachined titanium abutment, standard platform, internal
Fig.3: Cobalt -chromium powder
Fig.5: Spirit level indicators
Fig. 6a: Putty consistency Polyvinylsiloxane impression material
6b: Light body consistency Polyvinylsiloxane impression material
6c: Dispensing gun
6d: Auto mixing spiral
a
d
Fig.7: Clear autopolymerising acrylic resin
Fig.9: Emery papers
Fig.10: Distilled water
INSTRUMENTS
Fig.12: Teflon holding device
Fig.14: Calibrated torque wrench
Fig.15a: Metal cutting disc
15b: Disc mandrel
15c: Tungsten carbide burs
Fig.16: Rubber Point Polishing
a
b
EQUIPMENTS
Fig 17: Selective laser melting machine
Fig.19: Dental surveyor
Fig.21: Water jet powered sectioning machine
Fig.23: Steam cleaner
Fig.24: Digital Ultrasonic cleaner
METHODOLOGY
I. Fabrication of custom-made stainless steel block & receptacle
Fig.27a: Custom-made stainless-steel block.
27b: Line diagram of custom-made stainless-steel block
Fig.28a: Custom-made stainless steel perforated metal receptacle
28b: Line diagram of custom-made stainless steel perforated
metal receptacle
b
II. Obtaining silicone putty index using stainless steel block &
receptacle
Fig 29a: Filling of custom-made receptacle with polyvinyl siloxane
29b: Making impression of stainless steel block with soft putty
29c: Set impression with stainless steel block
29d: Standardized silicone putty index
a b
c
III. Fabrication of customized laser- sintered Co-Cr abutments
Fig. 30: Scan body
Fig. 32: Attachment of scan body to implant
Fig 34: Scanned image in the “exocad” software
Fig 35: Matching of abutment to implant Connection
Fig 37: Virtual design of the abutment in STL format
Fig 39: 40 sprue created in the platform of building chamber
Fig 41: Laser-sintered abutment before sprue detachment
Fig, 43: Rubber point polishing in connection area
IV.
Connecting implant-abutments to implants & grouping
Fig.45a: Single one stage connection with drive (Group I)
Fig.45b: Single one stage connection with drive (Group II)
Fig.46a: Connection of premachined abutments to the implants (Group I)
Fig.46b: Connection of customized laser-sintered abutments to the
implants (Group II)
V. Embedding of implant-abutment assembly in the acrylic resin
Fig.47: Silicone putty index made parallel to the floor using spirit level
indicators
Fig.48: Attaching the connected implant abutment assembly to the
[image:88.596.209.387.395.598.2]Fig.49: Positioning of implant-abutment assembly in silicone index
[image:89.596.177.418.418.641.2]b
Fig.50b: Implant embedded in acrylic resin
[image:90.596.188.408.104.322.2]
Fig.51a: Secured implant abutment assembly (Group I)
51b: Secured implant abutment assembly (Group II)
Fig.52: Securing the resin block in the Teflon holding device
Fig.53a: Torquing of abutment screw (Group I)
Fig.53b: Torquing of abutment screw (Group II)
Fig.54a: Retorquing of abutment screw after 24 hours (Group I)
Fig.55: Sand blasting of the abutments
[image:92.596.201.394.443.625.2]Fig.57a: Labelled test samples (Group I)
Fig.57b: Labelled test samples (Group II)
a
VI. Sectioning of test samples
Fig.58: Marked reference line on resin block
Fig.59: Resin block secured on sectioning platform of water jet sectioning
[image:94.596.139.458.388.603.2]Fig.60: Water jet powered sectioning of test sample
Fig.61a: Sectioned samples of Group I
VII. Preparation of sectioned test samples for SEM analysis
Fig.62: Trimming of excess clear acrylic resin using high speed lathe
Fig.63a: Cleaning and smoothening of sectioned test sample using
silicon carbide emery paper (Group I)
63b: Cleaning and smoothening of sectioned test sample using
Fig.64: Steam cleaning of sectioned test sample
Fig.66: Sectioned test samples soaked in ethyl alcohol
Fig.68a: Cleaned sectioned test samples (Group I)
VIII. Obtaining SEM images of test samples at the implant-abutment
interface
Fig.70a: SEM photomicrograph at lower magnification 7x (Group I)