Faculty of Engineering and Surveying
Natural Disaster Risk Management in
South Asia
A dissertation submitted by
Mr Nashua Thomas Hancock
In fulfilment of the requirements for
ENG4112 Engineering Research Project 2014
Towards the degree of
Bachelor of Engineering (Civil)
Submitted: 29th October 2014
ii
Abstract
Global economic growth and unprecedented population expansion coupled with climate change and unsustainable development will continue to cause an increase in the frequency, intensity and severity of natural disaster events into the future. Only through a clear understanding and appreciation of disaster risks can decision makers adequately prioritise the implementation of resilience building measures into development programs.
The aim of this dissertation is to critically analyse the natural disaster risk management strategies, emergency preparedness and response readiness of South Asian countries. To this end the available literature and statistical data was first analysed before a comparative study was undertaken of how the frameworks and mechanisms of the South Asia Region compare to global standards. Three South Asian countries, Bangladesh, India and Pakistan were studied in detail in an attempt to measure the region against these world standards. As part of this analysis a study of the roles that the various actors play in disaster risk management, specifically the restoration of engineering services after a disaster event was undertaken. Further detailed case studies were conducted to analyse how these frameworks and mechanisms were actually implemented during disaster events.
iii University of Southern Queensland
Faculty of Health, Engineering and Sciences ENG4111/ENG4112 Research Project
Limitations of Use
The Council of the University of Southern Queensland, its Faculty of Health, Engineering & Sciences, and the staff of the University of Southern Queensland, do not accept any responsibility for the truth, accuracy or completeness of material contained within or associated with this dissertation.
Persons using all or any part of this material do so at their own risk, and not at the risk of the Council of the University of Southern Queensland, its Faculty of Health, Engineering & Sciences or the staff of the University of Southern Queensland.
iv University of Southern Queensland
Faculty of Health, Engineering and Sciences ENG4111/ENG4112 Research Project
Certification of Dissertation
I certify that the ideas, designs and experimental work, results, analyses and conclusions set out in this dissertation are entirely my own effort, except where otherwise indicated and acknowledged.
I further certify that the work is original and has not been previously submitted for assessment in any other course or institution, except where specifically stated.
Nashua Thomas Hancock
v
Acknowledgments
I would like to show my thanks and appreciation to the following people:
My supervisor, Dr David Thorpe, for his guidance and support through the duration of this project
My family, particularly my parents, for their guidance and input
Finally I would like to thank my wife Pooja for being the continual driving force for me finishing my engineering study
vi
Table of Contents
Abstract ... ii
Acknowledgments ... v
Table of Figures ... x
Table of Tables ... xii
Table of Equations ... xii
Glossary of Terms ... xiii
1 Introduction ... 1
1.1 Background ... 1
1.2 Aim ... 2
1.3 Objectives ... 2
1.4 Justification ... 3
1.5 Limitations ... 4
1.6 Methodology ... 4
1.7 Outline ... 6
2 Literature Review & Statistical Analysis ... 7
2.1 Type, frequency and Severity ... 7
2.1.1.1 Natural Disaster Statistical Data ... 8
2.1.1.2 Natural Disaster Risk Definition... 9
2.1.2 Global Data ... 10
2.1.2.1 Summary of global statistics ... 13
2.1.2.2 Some global facts from the UNISDR (2012b)... 15
2.1.2.3 Climate Change... 15
2.1.3 Southern Asia Region Data ... 15
2.1.3.1 Some facts about the Southern Asia Region ... 16
2.1.3.2 Summary of statistics ... 20
2.2 Global Strategies for Risk Management ... 21
2.2.1.1 United Nations ... 22
2.2.1.2 Post 2015 Disaster Risk Reduction (HFA-2) ... 25
2.2.1.3 AS/NZS ISO 31000:2009 Risk Management – Principles and guidelines . ... 26
vii
2.2.1.5 World Federation of Engineering Organisations ... 27
2.2.1.6 Asian Disaster Preparedness Centre ... 28
2.2.1.7 South Asian Association for Regional Cooperation ... 29
2.2.2 Flood Risk Management ... 30
2.2.2.1 International Centre for Water Hazard and Risk Management ... 30
2.2.3 Storm Risk Management ... 32
2.2.3.1 Meteorological Based Storm Risk Management ... 32
2.2.3.2 International Group for Wind Related Disaster Risk Reduction ... 33
2.2.3.3 Resilience of buildings and infrastructure ... 34
2.2.4 Earthquake Risk Management ... 35
2.2.4.1 Prediction of Earthquake Events and Early Warning ... 35
2.2.4.2 Predicting Earthquake Losses, Casualties and Injuries ... 36
2.2.4.3 Overall Risk Reduction ... 37
2.3 Chapter Summary and Conclusion ... 38
3 Selected Southern Asia Region Country Study ... 40
3.1 Selection of 3 Southern Asia Region Countries ... 40
3.1.1 Earthquakes ... 40
3.1.2 Floods ... 41
3.1.3 Storms ... 42
3.1.4 South Asia Region Country Selection... 42
3.1.5 Selected Country Impact Summary ... 43
3.2 Natural Disaster Events in Selected Countries ... 44
3.2.1 Bangladesh Country Overview, Vulnerability and Exposure ... 44
3.2.1.1 Bangladesh Data Analysis ... 46
3.2.2 India Country Overview, Vulnerability and Exposure ... 49
3.2.2.1 India Data Analysis ... 51
3.2.3 Pakistan Country Overview, Vulnerability and Exposure ... 55
3.2.3.1 Pakistan Data Analysis ... 57
3.3 Natural Disaster Risk Management Strategies ... 61
3.3.1 Bangladesh ... 61
3.3.1.1 Earthquake ... 64
3.3.1.2 Flood ... 66
3.3.1.3 Storm ... 69
3.3.2 General Structure of Disaster Risk Management Strategies Used in South Asia ... 71
3.4 Gap Analysis ... 75
3.4.1 Bangladesh ... 75
3.4.1.1 Hyogo Framework for Action... 75
viii
3.4.1.3 Floods... 79
3.4.1.4 Storms ... 80
3.4.2 Common Gaps Found in South Asia ... 82
3.5 Chapter Summary and Conclusion ... 84
4 Stakeholder Role Study – Restoration of Engineering Services Post Disaster Event ... 85
4.1 Engineering Services ... 85
4.1.1 Defining Engineering Services ... 85
4.1.2 Natural Disasters and Engineering Services ... 86
4.1.2.1 Intensive vs. Extensive Events... 86
4.1.2.2 The Importance of Engineering Services... 87
4.2 Roles and Responsibilities Specific to Engineering Services – Post Disaster Event ... 89
4.2.1 Governments ... 89
4.2.2 Non-Government Organisations (NGO’s) ... 92
4.2.3 Private Enterprise ... 94
4.2.4 Reconstruction of Engineering Services Post Disaster Event – Gaps Found 95 4.3 Chapter Summary and Conclusion ... 96
5 Case Studies ... 97
5.1 Case Study 1: 2003 Bam Earthquake, Iran ... 98
5.1.1 Country Overview ... 98
5.1.2 Bam Earthquake Impact Overview ... 98
5.1.3 Key Findings ... 100
5.2 Case Study 2: 2004 Indian Ocean Tsunami, Maldives... 101
5.2.1 Country Overview ... 101
5.2.2 2004 Tsunami Impact on the Maldives ... 102
5.2.3 Response Efforts ... 103
5.2.4 Key Findings and Challenges... 104
5.3 Case Study 3: Kathmandu Earthquake Risk, Nepal ... 104
5.3.1 Country Overview ... 104
5.3.2 Kathmandu Earthquake Risk Overview ... 105
5.3.3 Key Gaps Identified ... 105
6 Conclusion ... 107
6.1 Completion of Objectives ... 107
6.2 Conclusions ... 108
ix
References ... 113
7 Appendix A: Project Specification Document ... 132
8 Appendix B: Selected South Asian Country Data ... 133
8.1.1 India... 134
8.1.2 Pakistan ... 135
8.1.3 Bangladesh ... 136
9 Appendix C: Natural Disaster Risk Management in Selected Countries ... 137
9.1.1 India... 137
9.1.1.1 Earthquake ... 140
9.1.1.2 Flood ... 142
9.1.1.3 Storm ... 145
9.1.2 Pakistan ... 148
9.1.2.1 Earthquake ... 152
9.1.2.2 Flood ... 154
9.1.2.3 Storm ... 155
9.2 Gap Analysis ... 156
9.2.1 India... 156
9.2.1.1 Hyogo Framework for Action... 156
9.2.1.2 Earthquakes ... 159
9.2.1.3 Floods... 160
9.2.1.4 Storms ... 161
9.2.2 Pakistan ... 162
9.2.2.1 Hyogo Framework for Action... 162
9.2.2.2 Earthquakes ... 164
9.2.2.3 Floods... 165
9.2.2.4 Storms ... 166
x
Table of Figures
Figure 1: South Asia Political Boundary Map (Free World Maps 2014) ... 1 Figure 2: Project Methodology Overview... 5 Figure 3: Annual Global Natural Disaster Occurrences 1980-2013 (EM-DAT 2014) ... 11 Figure 4: Annual Global Deaths from Natural Disasters 1980 to 2013 (EM-DAT 2014) ... 12 Figure 5: Annual Global Natural Disaster Financial Damage 1980 to 2013 (EM-DAT 2014) ... 12 Figure 6: Global Annual Numbers of People Affected Type 1980-2013 (EM-DAT 2014) 13 Figure 7: Global Event Occurrences and Impacts 1980-2013 (EM-DAT 2014) ... 13 Figure 8: Global % Breakdown of Ground Shaking vs. Tsunami 1980-2013 (EM-DAT
2014) ... 14 Figure 9: Actual and Projected Population Growth in SAR (UN 2012 and 2013a) ... 17 Figure 10: Annual Disaster Occurrences in Southern Asia 1980-2013 (EM-DAT 2014) ... 18 Figure 11: Annual Deaths by Natural Disaster Types in Southern Asia 1980-2013
(EM-DAT 2014) ... 18 Figure 12: Annual No. Affected by Natural Disasters in SAR by Type 1980-2013
(EM-DAT 2014) ... 19 Figure 13: Natural Disaster Financial Damage in Southern Asia 2980-2013 (EM-DAT
2014) ... 19 Figure 14: SAR Event Occurrences and Impacts 1980-2013 (EM-DAT 2014) ... 20 Figure 15: SAR % Breakdown of Ground Shaking vs. Tsunami 1980-2013 (EM-DAT
2014) ... 21 Figure 16: Map of Bangladesh (Source: Nation Master 2014) ... 46 Figure 17: Bangladesh Earthquake, Flood and Storm Occurrences 2980-2013 (Source
EM-DAT 2014) ... 47 Figure 18: Bangladesh Annual Deaths from Earthquakes, Floods and Storms 1980-2013
(Source EM-DAT 2014) ... 47 Figure 19: Bangladesh Annual Number Affected by Earthquakes, Floods and Storms
1980-2013 (Source EM-DAT 2014) ... 48 Figure 20: Bangladesh Annual Financial Damage from Earthquakes, Floods and Storms
xi Figure 21: Average Annual Impact Comparison for Earthquakes, Floods and Storms in
Bangladesh from 1980-2013 (Source EM-DAT 2014) ... 49 Figure 22: Map of India (Source: Nation Master 2014) ... 51 Figure 23: India Earthquake, Flood and Storm Occurrences 2980-2013 (Source EM-DAT
2014) ... 52 Figure 24: India Annual Deaths from Earthquakes, Floods and Storms 1980-2013 (Source
EM-DAT 2014) ... 53 Figure 25: India Annual Number Affected by Earthquakes, Floods and Storms 1980-2013
(Source EM-DAT 2014) ... 53 Figure 26: India Annual Financial Damage from Earthquakes, Floods and Storms
1980-2013 (Source EM-DAT) ... 54 Figure 27: Average Annual Impact Comparison for Earthquakes, Floods and Storms in
India from 1980-2013 (Source EM-DAT 2014) ... 55 Figure 28: Map of Pakistan (Source: Nation Master 2014) ... 56 Figure 29: Pakistan Earthquake, Flood and Storm Occurrences 2980-2013 (Source
EM-DAT 2014) ... 57 Figure 30: Pakistan Annual Deaths from Earthquakes, Floods and Storms 1980-2013
(Source EM-DAT 2014) ... 58 Figure 31: Pakistan Annual Number Affected by Earthquakes, Floods and Storms
1980-2013 (Source EM-DAT 2014) ... 59 Figure 32: Pakistan Annual Financial Damage from Earthquakes, Floods and Storms
1980-2013 (Source EM-DAT) ... 59 Figure 33: Average Annual Impact Comparison for Earthquakes, Floods and Storms in
Pakistan from 1980-2013 (Source EM-DAT 2014) ... 60 Figure 34: Intensive vs. Extensive Disaster Impacts on Infrastructure from 56 Countries and
xii
Table of Tables
Table 1: Earthquake Data Summary for SAR 1980-2013 (Source EM-DAT 2014) ... 41 Table 2: Flood Data Summary for SAR 1980-2013 (Source EM-DAT 2014) ... 41 Table 3: Storm Data Summary for SAR 1980-2013 (Source EM-DAT 2014)... 42 Table 4: Selected Country Cumulative Impacts from Earthquakes, Floods and Storms 1980-2013 (Source: EM-DAT 2014, UN 1980-2013a and the World Bank 2014c) ... 44 Table 5: Wind Speed and Deaths from Bangladesh Cyclones 1960 - 2009 (Source: Haque et
al 2012) ... 81 Table 6: Iran Country and Disaster Statistics (Source EM-DAT 2014 and the World Bank
2014a) ... 98 Table 7: Damage and Loss Summary of Bam Earthquake 2003 (Sources:
Ghafouri-Ashatiani 2004, Sanada et al 2004, Hosseinzadeh 2011, Eshghi & Razzaghi 2011 and Kishore et al 2004) ... 99 Table 8: Maldives Country and Disaster Statistics (Source: the World Bank 2012) ... 101 Table 9: Maldives Tsunami Estimated Losses and Recovery Costs (Source: the World Bank
et al 2005) ... 102 Table 10: Nepal Country and Disaster Statistics (Source: the World Bank 2012) ... 105 Table 11: India Cumulative Impacts from Earthquakes, Floods and Storms 1980-2013
(Source: EM-DAT 2014, UN 2013a and the World Bank 2014c) ... 134 Table 12: Pakistan Cumulative Impacts from Earthquakes, Floods and Storms 1980-2013
(Source: EM-DAT 2014, UN 2013a and the World Bank 2014c) ... 135 Table 13: Bangladesh Cumulative Impacts from Earthquakes, Floods and Storms
1980-2013 (Source: EM-DAT 2014, UN 1980-2013a and the World Bank 2014c) ... 136
Table of Equations
xiii
Glossary of Terms
US$ - unless otherwise stated all currency measurements in this paper are in US Dollars
ADPC – Asian Disaster Preparedness Centre
ADB – Asia Development Bank
EM-DAT – International Disaster Database EM-DAT: The OFDA/CRED International Disaster Database
GDP – Gross Domestic Product
GIS – Geographic Information Systems
GFDRR – Global Facility for Disaster Reduction and Recovery
HFA – Hyogo Framework for Action 2005-2015
IPCC – Intergovernmental Panel on Climate Change
ISDR – International Strategy for Disaster Reduction is the framework adopted by the United Nations member states in 2000
Liquefaction of Soil – A mechanism where saturated/partially saturated soil loses strength/stiffness in response to stress, for example during an earthquake, causing the soil to behave like a liquid
MDG - Millennium Development Goals
xiv Non-Structural Measures – Refers to the non-physical elements, awareness, education, policies, legislation, regulations, knowledge, public involvement, methods and operating practices that can reduce impacts and potential risks
RedR – the international Register of Engineers for Disaster Relief
Resilience – The ability of a system, community, environment or society to adapt to and resist hazards in order to remain functional
Risk Finance – Financial mechanisms created to reduce vulnerability to natural disaster events by implementing instruments including insurance policies and catastrophe bonds which spread risk in exchange for a premium
Risk Transfer – Mechanisms for removing the risk from one area, region, system, environment, time period or community and shifting that risk to another location. Climate change is the ultimate method of risk transfer. For example high polluting industrial countries transfer the risks of anthropogenic climate change to other nations more susceptible to the effects of severe weather and rising sea levels. Furthermore the climate modifying countries accrue the present risk to a future time when the effects and losses due to climate change will surface
SAARC – South Asian Association for Regional Cooperation
Structural Measures – Refers to the physical construction that decreases or avoids the potential impacts of hazards, this includes engineering measures, the construction of hazard resistant and protective structures and infrastructure
UN – United Nations
UNDP – United Nations Development Program
UNICEF – United Nations Children’s Fund
xv USGS – United States Geological Survey
Vulnerability – Physical, environmental, social and economic factors and processes that increase the susceptibility of a community to hazards
WFEO – World Federation of Engineering Organisations
1
1
Introduction
1.1
Background
Since 1980 there have been on average more than 300 natural disaster events per year across the globe, killing an estimated 75 000 people each year, affecting more than 180 million lives and costing more than USUS$75 billion annually.
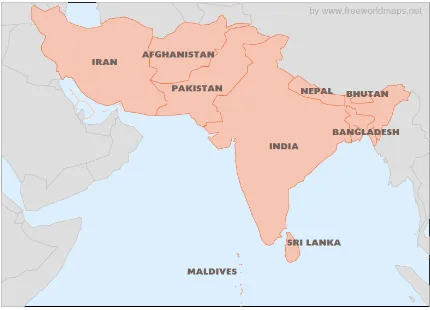
The South Asia Region (see Figure 1) experiences on average about 40 natural disaster events each year, resulting in about 17 000 lives lost, affecting about 60 million people and causing damages amounting to at least USUS$3.7 billion annually (EM-DAT 2014).
[image:16.612.119.549.389.699.2]These figures are quite significant and highlight the importance of effective disaster risk management techniques. Engineers play a key role in disaster risk management throughout the world.
2
1.2
Aim
This project seeks to critically analyse the natural disaster risk management strategies, emergency preparedness and response readiness of countries in the Southern Asian Region including a gap analysis between selected Southern Asian countries and world standards. A focus area will be the roles which the various stakeholders play in disaster risk reduction with particular reference to the restoration of engineering services post disaster event. The final section of this research project will contain an assessment of recent natural disaster events and one high potential risk scenario as case studies.
1.3
Objectives
A broad objective of this study is to generate discussion amongst fellow engineers and decision makers about natural disaster risks and the importance of integrating disaster risk reduction mechanisms into sustainable development.
The specific objectives of this project are to:
1. Research literature and background material relating to:
The type, frequency and severity of natural disaster events globally and in South Asia
Global disaster risk management strategies
Disaster risk management strategies for the three dominant types applicable to South Asia
2. Select up to 3 countries in South Asia for a study of:
Natural disaster events experienced, specifically the three dominant types Risk management strategies for these dominant types
Framework, protocols and recent performance compared to global standards
3 Government Organisations
Non-Government Organisations (NGOs) Private organisations
4. Using the results of the research conduct a number of case studies in South Asia focussing on the implementation of the frameworks and strategies in place
5. Report findings in the required written and oral formats
1.4
Justification
As discussed, a broad objective of this research is to generate discussion about the role of natural disaster risk management in sustainable development. It is hoped that this project will promote further research of natural disaster risk management through the compilation of literature review, statistical data and case studies.
Based on this, the research is justified through reference to the code of ethics for one of the key professions involved with natural disaster risk reduction: Engineers. Engineers Australia (2010) indicates that in order for an engineer to practice competently they must act on the basis of adequate knowledge. To this end this research aims to promote education and awareness of relevant engineering topics, risk management and more specifically disaster risk reduction, that are not commonly covered in tertiary engineering studies.
4
1.5
Limitations
Given the aims, objectives and time available for this undergraduate project, the research and recommendations of this paper are focussed on the South Asia Region, with a restricted element of research and literature references from examples in other global regions.
The time period in focus in this study will be limited to between 1980 and 2013.
1.6
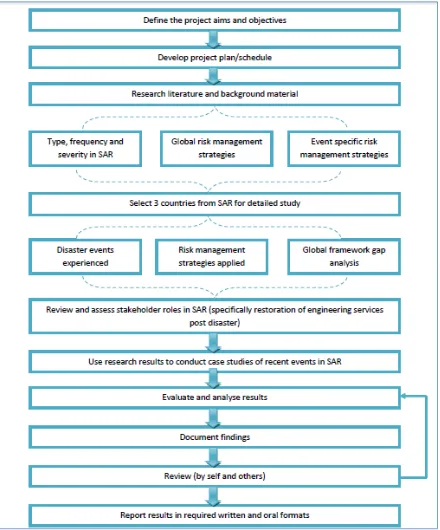
Methodology
5
6
1.7
Outline
The remainder of this document is structured as follows:
CHAPTER 2: This chapter contains the initial literature review of the background information and statistical data and is necessary in providing the building block for the remainder of the research project.
CHAPTER 3: In this chapter the focus of the research is narrowed down to selected countries and specific disaster types. Through the critical analysis of gaps identified in these selected countries a greater understanding of how South Asia stands against global disaster risk management strategies is fulfilled.
CHAPTER 4: This chapter further narrows the research down into a specific area of disaster risk management that involves the restoration of engineering services after natural disaster events. This allows the research to focus on an area explicitly related to civil engineering.
CHAPTER 5: Case studies are undertaken in this chapter in order to measure the success of South Asian countries in the implementation of specific natural disaster risk management strategies, frameworks and mechanisms.
CHAPTER 6: Conclusions and further work are incorporated into this chapter to discuss the achievements of this research and summarise the findings while providing ideas and opinions of what areas need to be studied next.
7
2
Literature Review & Statistical Analysis
The previous chapter provided a brief introduction to the topic and the issues associated with natural disasters in South Asia and across the globe. This upcoming chapter delves deeper into the topic by reviewing literature and statistical data on the subject. The overarching structure of this chapter is as follows:
Type, frequency and severity analysis providing topic definitions, summarising specific statistical data and providing global as well as South Asian regional facts Global strategies for risk management which covers the broad scoped strategies as
well as more specific mechanisms applicable to the types of natural disaster events typically experienced in South Asia
Relevant data for this research project has been sourced online through Google, Google Scholar, Emerald Insight, Cambridge Journals and Engineering Village 2 - Compendex. Statistical data for the types, frequency and severity of natural disasters was sourced from EM-DAT CRED the International Disaster Database, Centre for Research on the Epidemiology of Disasters (EM-DAT). PreventionWeb, the United Nations Office for Disaster Risk Reduction (UNISDR) sponsored database, was also an invaluable tool.
Only literature published in English was used for this research project due to time constraints of having documents translated, however the vast majority of reference material found was already in English. The search criteria used were restricted to sources from 1980 to present.
2.1
Type, frequency and Severity
The most efficient approach regarding the Types considered in this project was to align with the available resources, i.e. EM-DAT which provides data on the following disaster types:
Earthquake Volcano
8 Storm
Flood
Extreme temperature Drought
Wildfire Epidemic
Insect infestation
The Frequency of these disaster events is recorded each year and measured in actual numbers of individual events. The Severity can be measured in the following quantitative categories:
Number of fatalities Number of people injured Number of people affected
Number of people made homeless Total financial damage (USUS$)
2.1.1.1 Natural Disaster Statistical Data
EM-DAT is an emergency events database that has partnerships with the World Bank, the United Nations (UN) and other organisations when discussing statistics and trends of natural disasters (EM-DAT 2014).
A note from EM-DAT (2014) on the criteria for natural disaster events to be entered into the database at least one of the following criteria must be satisfied:
9 Once a disaster triggers the above criteria and the details have been confirmed it is entered into EM-DAT. Since 2003 disasters that span across several country boarders have been assigned a single identification number and recorded as a single event (EM-DAT 2014). EM-DAT (2014) indicates that there is no standard global procedure for financial damage estimations used as the basis for its data, and it has been noted by the UN (2013c) that the direct disaster loss estimates could be at least 50% higher than internationally reported.
A note on the definition of categories from EM-DAT:
Flood – General river flood, flash flood, storm surge/coastal flood
Earthquake – Ground shaking, earthquake related tsunami
Storm – Tropical storms, extra-tropical storms (winter storm), local/convective storms
Total Affected – Is the sum of people injured, people made homeless and people affected
2.1.1.2 Natural Disaster Risk Definition
This section aims to provide a broad definition of natural disaster risk to be utilised throughout this research paper. The main focus of this definition involves the negative aspects of natural disaster risk. However it should be noted that the opportunities and positive possibilities arising from natural disaster events in terms of betterment and resilience will also be discussed in subsequent sections of this report.
A natural disaster is defined by UNISDR (2014) as:
“A serious disruption of the functioning of a community or a society involving widespread human, material, economic or environmental losses and impacts, which exceeds the ability of the affected community or society to cope using its own resources”
(Source: http://www.unisdr.org/we/inform/terminology)
10 1. Natural Hazards – Earthquakes, Storms, Floods, Drought. These can be considered
a fixed variable
2. Exposure – of people and property to the natural hazards 3. Vulnerability – of the people and property exposed
Wisner and Uitto (2009) and the Asian Disaster Preparedness Centre (ADPC) (2010) explain further suggesting that Risk is a function of the Hazard multiplied by the Vulnerability minus the level of disaster Mitigation implemented. The local Capacity to provide self protection from risk and the degree to which political, social and economic limitations affect this capacity can also be added to the equation as a dynamic denominator. This gives:
Equation 1: Simplified Equation of Natural Disaster Risk
Intensive risk refers to the high severity, mid to low frequency disasters, and usually concerns major hazards, while extensive risk concerns the low severity, high frequency disasters and is usually associated with localised disasters (UN 2013c)
2.1.2 Global Data
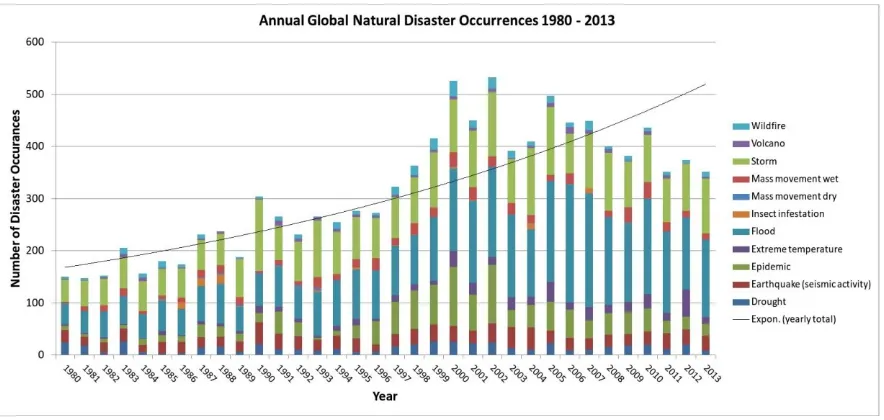
There is a general pattern, which has been globally identified and accepted by relevant stakeholders, that the frequency and intensity of natural disasters is increasing and has been doing so for at least the past 4 decades (World Bank 2012, see also Figure 3). The financial losses resulting from natural disasters amount to hundreds of billions of dollars annually (see Figure 5) and these figures are projected to double by 2030 (UN General Assembly 2013).
11 recovery and post disaster management would have been originally budgeted for other expenditure and investment which is now rendered unavailable. The results are negative impacts on production, growth and development that can take decades to reclaim.
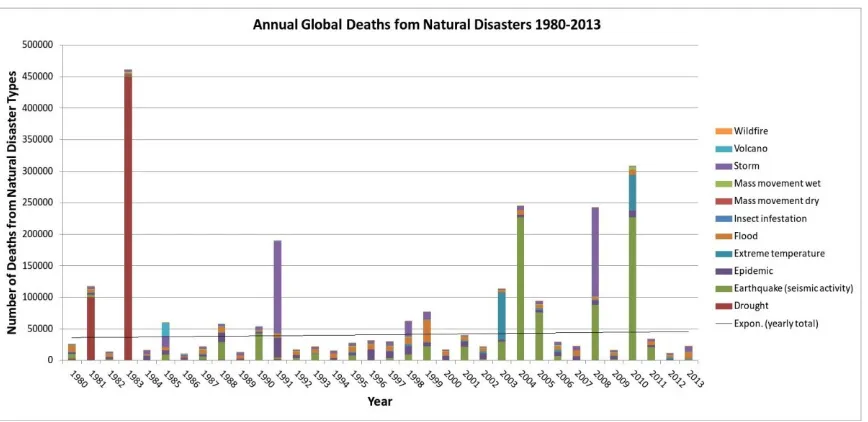
Figure 3 shows the annual occurrences of natural disasters globally from 1980 to 2013. Figure 4, Figure 5 and Figure 6 indicate that globally the death rate from natural disasters is increasing only slightly from 1980 while the financial damage resulting from natural disasters and the number of people affected is increasing significantly and is trending to continue to do so into the future.
[image:26.612.117.559.307.517.2]It should be noted that the use of exponential trend lines for statistical data analysis is consistent with data reporting groups such as the Munich Re Group (Munich Re Group 2008).
12
Figure 4: Annual Global Deaths from Natural Disasters 1980 to 2013 (EM-DAT 2014)
[image:27.612.116.554.347.569.2]13
Figure 6: Global Annual Numbers of People Affected Type 1980-2013 (EM-DAT 2014)
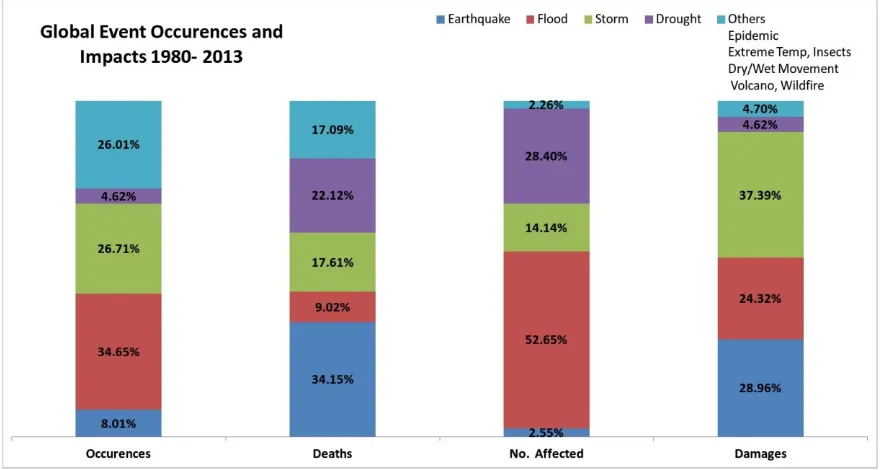
Figure 7: Global Event Occurrences and Impacts 1980-2013 (EM-DAT 2014)
2.1.2.1 Summary of global statistics
[image:28.612.114.555.358.593.2]14 Floods, storms and epidemics are the three leading natural disaster types accounting
for about 73% of all natural disaster events between 1980 and 2013
Storms, earthquakes and floods account for 90% of the losses from natural disaster events globally between 1980 and 2013
In this study period the global cost of natural disasters was USUS$2.55 Trillion (approximately USUS$74.9 billion annually), of this USUS$952 billion resulted from storms, USUS$737 billion from earthquakes, and USUS$619 billion from floods
Earthquakes, drought and storms account for about 74% of the total number of deaths from natural disaster events from 1980 to 2013
Since 1980-2013 over 2.5 million people have been reported killed by natural disaster events, in the past decade the average has been over 100 000 people every year
Of this 2.5 million deaths: about 560 000 result from drought, 867 000 from earthquakes and 447 000 from storms since 1980
Since 1980 approximately 183 million people have been affected by natural disasters every year
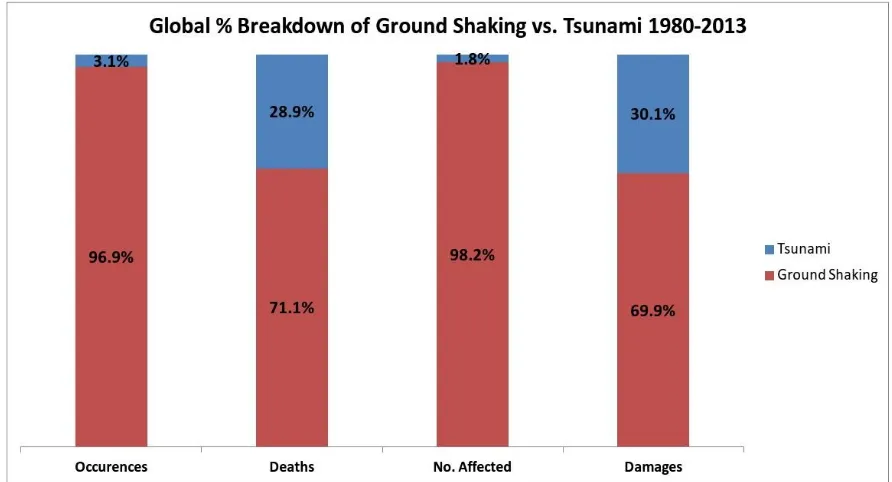
[image:29.612.112.558.461.702.2] Figure 8 below shows the % breakdown of earthquake resultant hazards, this is important because the hazards and therefore the risk reduction strategies are different for ground shaking and tsunami events
15 2.1.2.2 Some global facts from the UNISDR (2012b)
In the last 30 years the number of people living in flood prone river basins has increased by 114%
During that same 30 year period the number of people living on coastlines exposed to cyclone has increased by 192%
More than half of the world’s large cities with populations from 2-15 million people are located in areas that are highly vulnerable to seismic activity.
2.1.2.3 Climate Change
The Intergovernmental Panel on Climate Change (IPCC) (2012b) indicated that the following future occurrences will be likely due to climate change:
Average tropical cyclone wind speed will increase
The frequency of heavy precipitation or the proportion of heavy rainfall in total rainfall will increase
Heavy rainfall associated with tropical cyclones will increase
The increase in exposure combined with the abovementioned climate predictions will result in higher economic losses from natural disaster events.
2.1.3 Southern Asia Region Data
The Southern Asia Region is defined by the UN (2013) as consisting of:
Afghanistan
16 Bhutan
India
Iran (Islamic Republic of)
Maldives
Nepal
Pakistan
Sri Lanka
EM-DAT has the same country composition for Southern Asia as the UN however the World Bank (2012 and 2014a) omits the Islamic republic of Iran from its definitions. For the purposes of this project the UN and EM-DAT definition shall be used.
2.1.3.1 Some facts about the Southern Asia Region
South Asia contains some of the fastest growing megacities in Asia and also some of the most vulnerable to natural disasters (Jabeen 2012, World Bank 2012)
Mumbai, Delhi, Dhaka, Kolkata and Karachi are all forecast to have over 100 million inhabitants by 2015, the South Asia Region’s population has doubled to 1.4 billion in last 40 years, no other region in the world has a concentration of megacities as does South Asia (World Bank 2012)
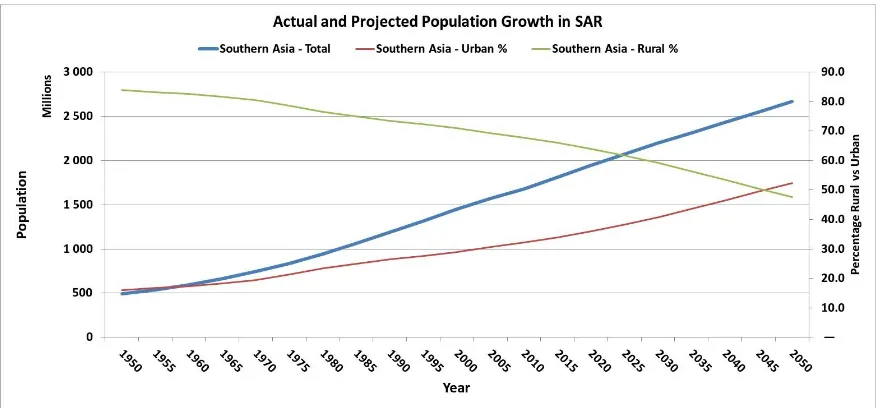
The population in South Asia is trending to increase to over 2.5 billion by 2050 and more than 50% of this population is expected to reside in urban areas (see Figure 9) Estimations indicate that approximately 40% of people in Dhaka live in slums, 50%
in Delhi and up to 60% in Mumbai (World Bank 2012)
The high vulnerability of Water Sanitation and Hygiene services (WASH) in slum areas increases the impact resulting from extensive natural disaster events (Johannessen et al 2013)
17
Bangladesh and Nepal are considered Low-Income countries
India, Pakistan and Sri Lanka are considered lower middle income countries
Bangladesh, India, Iran, Nepal, Pakistan & Sri Lanka are considered developing economies
Afghanistan, Bangladesh, Bhutan and Nepal are considered to be among the world’s least developed countries
The UN (2013c) identify that both intensive and extensive disaster risk is disproportionately concentrated in lower income countries
[image:32.612.115.554.400.604.2] Even with the increasing occurrences and severity of natural disasters in South Asia the vulnerability to and consequences from natural disasters is not a significant component of development agendas. Awareness and understanding of natural disaster risks among key stakeholders remains low (World Bank 2012).
Figure 9: Actual and Projected Population Growth in SAR (UN 2012 and 2013a)
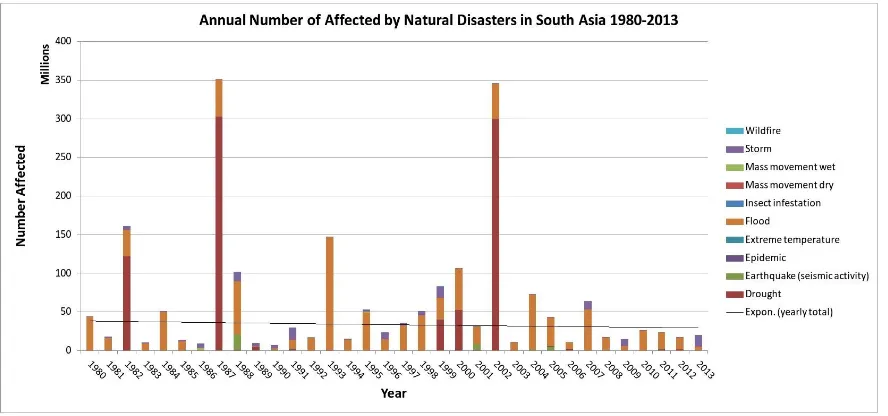
18 affected (see Figure 12). The one consequence of natural disasters in South Asia that is increasing rapidly is the damage caused and the resulting financial losses (see Figure 13).
Figure 10: Annual Disaster Occurrences in Southern Asia 1980-2013 (EM-DAT 2014)
The high number of natural disasters in 2005 is comprised of higher than average occurrences of flooding events in India, Afghanistan and Pakistan during that year (EM-DAT 2014).
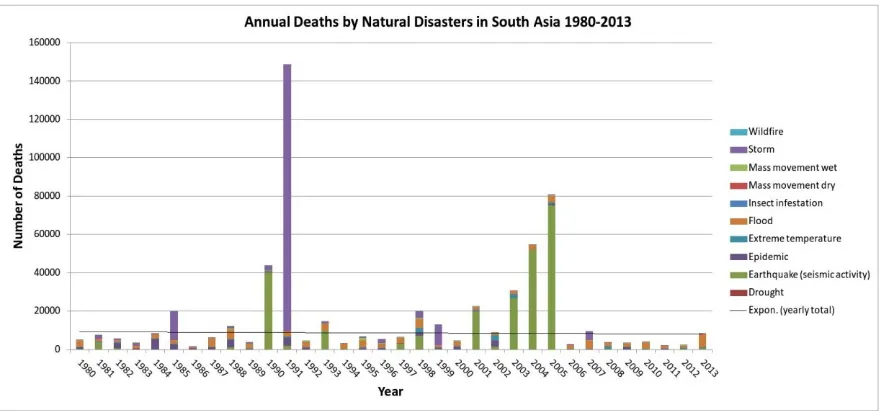
Figure 11: Annual Deaths by Natural Disaster Types in Southern Asia 1980-2013 (EM-DAT 2014)
[image:33.612.116.557.419.625.2]19 during 2004 (killing 16 000 people in India and 35 000 in Sri Lanka) and Kashmir (Pakistan) earthquake in 2005 resulting in 73 000 deaths (EM-DAT 2014 and The World Bank 2012).
Figure 12: Annual No. Affected by Natural Disasters in SAR by Type 1980-2013 (EM-DAT 2014)
The data spikes in the total number of people affected by natural disasters are a result from drought in India during 1987 and again in 2002 affecting an estimated 300 million people during each occurrence (EM-DAT 2014).
[image:34.612.117.555.452.667.2]20
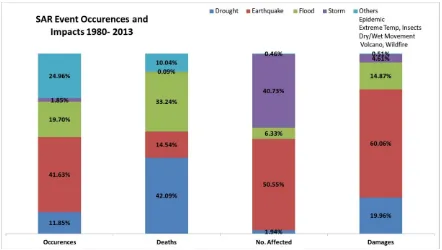
Figure 14: SAR Event Occurrences and Impacts 1980-2013 (EM-DAT 2014)
2.1.3.2 Summary of statistics
The following is a summary of statistics from Figure 14:
Floods (41.6%), Storms (19.7%) and Earthquakes (11.9%) account for about 73% of all natural disasters in the South Asia Region from 1980 to 2013.
Floods (60.1%), Earthquakes (20%) and Storms (14.9%) comprise 95% of the total damages resulting from natural disaster events in the South Asia Region from 1980 to 2013
In this study period the cost of natural disasters in South Asia was USUS$124 billion (approximately USUS$3.7 billion annually), of this: USUS$75 billion was from floods, USUS$25 billion from earthquakes, and USUS$19 billion from storms
21
In this study period over 580 000 people have been reported killed by natural disaster events, in the past decade the average has been over 17 200 people every year
Of this 580 000 deaths: about 245 000 result from earthquakes, 193 000 from storms and 85 000 from floods since 1980
On average every year since 1980 approximately 6 million people have been affected by natural disasters in South Asia
[image:36.612.115.558.262.495.2] Figure 15 below shows the % breakdown of earthquake resultant hazards
Figure 15: SAR % Breakdown of Ground Shaking vs. Tsunami 1980-2013 (EM-DAT 2014)
The conclusion that can be drawn, from the statistics at least, is that significant progress has been made in preventing the loss of life due to natural disaster events in the South Asia Region. However as the figures also indicate the financial damages and resulting losses are rapidly escalating. Takeuchi (2001) indicates that this shift from loss of life to financial damage is ubiquitous wherever development is occurring.
2.2
Global Strategies for Risk Management
22 on the broad global level risk management strategies for the dominant disaster types experience in South Asia, these being floods, storms and earthquakes.
2.2.1.1 United Nations
The UNISDR is the UN secretariat of the International Strategy for Disaster Reduction and the disaster risk reduction community which comprises the various actors that work together to share information and reduce disaster risk. UNISDR is the central driver for the implementation of disaster risk reduction framework (UNISDR 2014).
The Yokohama Strategy for a Safer World: Guidelines for Natural Disaster Prevention, Preparedness and Mitigation was globally adopted in 1994 and was seen as a milestone set of guidelines for risks and impacts relating to natural disasters. A review of these guidelines specified several key areas for improvement. At the World Conference on Disaster Reduction in Kobe, Hyogo, Japan in 2005 this review was used to develop the framework and priorities for action for 2005-2015. This became known as the Hyogo Framework for Action (HFA) (UN 2014).
This framework provides the guiding mechanisms for countries to reference and measure against and forms the platform to build specific risk management strategies that target individual disaster subgroups (i.e. floods, storms and earthquakes).
The HFA priorities for action and the underlying rationales are summarised below.
1. Ensure that disaster risk reduction is a national and local priority with a strong institutional basis for implementation
Countries that develop the necessary legislation, policies and frameworks and utilise specific measurable indicators to track progress against these have an enhanced capacity to reduce natural disaster risks. Having these measurable performance indicators provides the basis for engagement and compliance of all sectors of society.
Key activities are:
23 Ensure that disaster risk reduction is part of policy and planning
Assess, allocate and appropriately manage resources Promote community participation
2. Identify, assess and monitor disaster risks and enhance early warning
Quality risk management will always begin with a full understanding of the hazards (disaster types) and the vulnerabilities (physical, social, economic and environmental). This understanding coupled with the dynamics of such hazards and vulnerabilities in the short and long term provide the basis for appropriate risk management and subsequent action to mitigate these risks.
Key activities are:
Develop and progressively upgrade national and local risk assessments including maps and multi risk event analysis
Create and periodically review people centred early warning systems
Implement and progressively strengthen vulnerability, hazard and risk identification, analysis and reduction capacity
Compile accurate statistical data on disasters, monitor regional as well as trans-boundary disaster events and identify, research and analyse long and short term trends and issues
3. Use knowledge, innovation and education to build a culture of safety and resilience at all levels
24 Key activities are:
Information management and exchange at all levels (local, national and regional) and between all relevant stakeholders including the general community, government, private sectors, expert panels and the scientific community
Education and training regarding disaster risk at all levels including schools, tertiary facilities, disaster risk expert groups and the scientific community
Disaster risk related research
Utilise media outlets to encourage a culture of disaster awareness
4. Reduce the underlying risk factors
Development planning projects as well as post disaster planning opportunities can be used to reduce the risk of natural disasters, particularly for hazards involving water, weather and geological events.
Key activities are:
Environmental and natural resource management Food security and resilience
Ensure the protection of critical public facilities against disasters Social and economic development practices
Implementation and strengthening of land use planning and other technical measures including building codes
25 5. Strengthen disaster preparedness for effective response at all levels
The impacts and losses resulting from natural disaster events can be significantly reduced if authorities, communities and individuals are well prepared and equipped with the capacity for effective disaster management.
Through the implementation abovementioned action priorities and key activities individuals, communities, countries and regions can become more disaster resilient and more effective in reducing the vulnerability and overall impact of natural disaster risks
2.2.1.2 Post 2015 Disaster Risk Reduction (HFA-2)
The UNISDR is the administrating body that is coordinating the progression of disaster risk reduction guidelines post 2015. The role of the UNISDR moving forward is seen as supporting international cooperation, information and knowledge management and policy development and technical cooperation (UNISDR 2013c).This is to be achieved through extensive consultation with multiple stakeholders, including local and national governments, NGO’s, academics, experts and private sector representatives. These consultations are undertaken at regional, sub-regional and individual country levels (UNISDR 2013b).
Some of the key points from the UNISDR (2013a) highlighted through these consultations for disaster risk reduction post 2015 are:
Disasters are commonly viewed as external impacts to systems, the paradigm should change to viewing disasters as the result of risk drivers embedded in development policies and practices which accumulate risk
Development methodologies need to change to be able to enhance resilience, seize opportunities and ensure sustainable development
There needs to be greater promotion of risk sensitive private investment through new and enhanced existing incentive processes
26 Further cooperation is needed between countries and regions in assessing and
managing the trans-boundary and global aspects of risk reduction
Three main focus points moving forward are – risk prevention, risk reduction and strengthened resilience
As intended the HFA is an excellent overriding document to build on and develop risk management strategies from however it does not provide detailed strategies for disaster risk reduction specific to the key natural disaster events experienced in South Asia (floods, storms and earthquakes).
2.2.1.3 AS/NZS ISO 31000:2009 Risk Management – Principles and guidelines
The International Standards Organisation, through consultation with Australia and New Zealand, has developed ISO 31000:2009 Risk Management – Principles and guidelines. This standard is focussed on risk management at an organisational level and can be applied across several operational aspects including safety, financial, environmental and project management. While it does not specifically mention natural disaster risk management it does provide the mechanisms that could be implemented to help manage natural disaster risk. These mechanisms include:
Principles that if followed will facilitate effective risk management Risk management framework including:
Organisational commitment
The organisational context of risk and understanding this risk
Policy creation, implementation and integration into the organisation
Accountability within the organisation and appropriate resource allocation
27 2.2.1.4 The World Bank
The World Bank is a significant global actor in disaster risk reduction. It provides technical and financial support for:
Risk assessment and reduction
Disaster preparedness and financial protection Resilience recovery and reconstruction
The World Bank does this through an institutional mechanism, the Global Facility for Disaster Reduction and Recovery (GFDRR). This facility is an organisation of 41 countries and 8 international organisations and is specifically committed to the reduction of vulnerability to natural hazards in developing countries (The World Bank 2014b).
Some of the projects currently implemented by the World Bank include:
inaSAFE – free software which produces hazard maps and impact scenarios that can be used as the basis for risk management activities including planning, preparedness and risk awareness. This work is in cooperation with the Australian and Indonesian Governments (inaSAFE 2014)
The Open Data for Resilience Initiative is a joint UN/World Bank initiative that provides open access to post disaster risk management strategies based on actual disaster events (the Haiti earthquake for example) (GFDRR 2014)
2.2.1.5 World Federation of Engineering Organisations
The World Federation of Engineering Organisations (WFEO) is an international NGO that represents the engineering profession on a global scale. One of the technical committees of WFEO is the Committee on Disaster Risk Management (WFEO-CDRM). There are three subcommittees under the WFEO:
28 Capacity Building for Natural Disaster Risk Management
WFEO-CDRM provides an interactive community based approach to natural disaster hazard management that includes structural and non-structural methods. It is currently in the process of developing standards for water and earthquake disaster preparedness as well as disaster risk educational packages and hazard response and readiness plans (WFEO-CDRM 2014).
2.2.1.6 Asian Disaster Preparedness Centre
The Asian Disaster Preparedness Centre (ADPC) is an independent NGO that operates in all South Asian countries except Iran. It is worth mentioning here as it is a significant player in disaster risk management. Through partnership with several international agencies ADPC works to deliver technical assistance and support to address the needs expressed by the countries it serves. ADPC uses scientific methodologies ranging from Geographic Information Systems (GIS) to economic modelling to enhance risk reduction at national and sub-national levels, specifically ensuring disaster risk policy and guidelines are implemented and integrated into the development process (ADPC 2014a).
ADPC (2010) defines their disaster risk management as a cycle with the following 5 phases:
1. Mitigation involving structural and non-structural measures
2. Prevention connecting avoidance and minimisation of risk along with education promoting a culture of prevention
3. Preparedness of response procedures including insurance, early warning systems and evacuation facilities
4. Response through the provision of assistance and intervention during and after disaster events
5. Recovery of post disaster areas with an agenda to improve on the existing disaster resilience levels
29 Providing risk and loss estimates at national and local geographical scales including
risk mapping and scenario based investment planning
Vulnerability analysis and early warning system development Community centred risk awareness and risk assessment
2.2.1.7 South Asian Association for Regional Cooperation
The South Asian Association for Regional Cooperation (SAARC) was originally formed in 1985 and contains Bangladesh, Bhutan, India, Maldives, Nepal, Pakistan and Sri Lanka. It was formed based on the recognition that regional economic, social and technical cooperation between South Asian countries would be highly beneficial (SAARC 2014).
SAARC developed seven strategic goals that have been used in conjunction with the Hyogo Framework for Action and Millennium Development Goals to develop disaster risk management strategies and frameworks in South Asian countries. These seven strategic goals are defined by SAARC (2006) in the Comprehensive Framework on Disaster Management as follows:
1. Professionalising the disaster management system 2. Mainstreaming disaster risk reduction
3. Strengthening of community institutional mechanisms
4. Empowering community at risk particularly women, the poor and the disadvantaged 5. Expanding risk reduction programming across a broader range of hazards (all
hazards approach)
6. Strengthening emergency response systems; and
30 2.2.2 Flood Risk Management
This section identifies the global strategies that are specific to flood management.
2.2.2.1 International Centre for Water Hazard and Risk Management
The International Centre for Water Hazard and Risk Management (ICHARM) was formed through the support of the United Nations Organisation for Education Science and Culture (UNESCO) in 2006 to achieve the following objectives (ICHARM 2011):
Improvement in education for water related disaster management through a masters course as well as a Ph.D. Program in Disaster Management
The development of a global system that can deliver efficient access to flood basin data for any basin in the world
Establish cooperation with engineers for the integration of satellite based data with on the ground data
Support disaster risk assessment and disaster preparedness at local levels through relevant stakeholder partnerships
ICHARM has also released a Large-scale Flood Report (Chavoshian and Takeuchi (ed.) 2011), as a response to the increase in flood disaster events across the globe.
Kundzewicz and Schellnhuber (cited in Kundzewicz 2011 p 12) indicate that there have been 3 main strategies for flood management in the past:
Protection within financial and practical limits
Adaption of living conditions to accommodate flooding
31 Kundzewicz (2011) describes some of the current structural and non-structural measures as:
Structural:
Usually large scale physical defence systems
Includes dykes, dams, flood control reservoirs, floodways and diversions as well as channel capacity improvements, dredging
Non-Structural:
Source control:
This includes catching water where it falls and slowing downstream transfer
Enhancing infiltration, reducing runoff, increasing catchment storage resulting in a reduced peak flood level
Laws, policy, regulation Land use planning
Efficient forecasting and warning systems
Awareness, education and enhanced dissemination of information
Kundzewicz and Schellnhuber (cited in Kundzewicz 2011 p 12) further categories and divide these mechanisms of flood risk management into:
Pre flood preparedness
32 With specific regard to the structural mechanisms of risk reduction Takeuchi (2001) considers the fact that often the structural flood infrastructure can increase the financial damage of the flood event. Often it is the flood protection infrastructure itself that accounts for a high percentage of the overall damage and losses. This indicates that careful cost benefit analysis must be undertaken prior to investment in these infrastructures.
Should funds be invested in flood resilient/resistant structures (bridges, roads etc) at a high cost or should investment be made in low cost structures that are easily maintained or replaced after an event? Obviously involved with this cost benefit analysis are the additional factors such as the importance of these structures for post disaster recovery, e.g. are they essential transport routes for emergency services etcetera.
Johannessen et al (2013) go further to suggest that in certain cases these structural measures such as levees and embankments have actually been the cause of more severe flood damages. Furthermore in some cases where development has not been appropriately monitored and controlled, settlements have been allowed to develop behind the flood barriers resulting in increased vulnerability of the population.
Takeuchi (2001), Johannessen et al (2013) and Kundzewicz (2011) describe the best approach to flood management as holistic in nature, taking into account both the structural and non-structural mechanisms throughout the entire flood catchment area. This approach reduces the net risk by reducing the vulnerability and exposure of the population while increasing the capacity for risk reduction.
2.2.3 Storm Risk Management
This section identifies the major global actors in storm risk management and highlights the objective of these groups and the strategies they employ in the disaster risk reduction process.
2.2.3.1 Meteorological Based Storm Risk Management
33 boundaries. The majority of the world’s countries, and all of South Asia’s countries, are members (WMO 2014b).
The Global Framework for Climate Services has been developed as an implementation mechanism for the proactive approach detailed in the HFA, in particular science based risk management and early warning systems. Each member country has obligations to the WMO through their individual national meteorological and hydrological service providers (e.g. Australian Bureau of Meteorology, Indian Meteorological Department etc).
Through multinational cooperation, the WMO (2014a) aims to provide the amalgamated data and modelling to be used in multiple hazard analysis at local, national, regional and global levels to enhance:
Overall hazard risk assessment through the provision of data and forecasting services
Loss and damage datasets by modelling historical and future meteorological data projections
Early warning systems by climate and weather modelling and forecasting
Risk reduction in climate vulnerable sectors such as agriculture, infrastructure, tourism and other industry areas
Risk reducing investment decision making Risk financing and the transferral of risk
2.2.3.2 International Group for Wind Related Disaster Risk Reduction
34 To implement the HFA in the specific target area of wind related risk reduction To store/warehouse up to date information and technology concerning wind related
disasters and provide the mechanisms for disseminating this data to relevant stakeholders
To complement the work of existing international organisations in preparing wind related disaster evacuation, recovery and reconstruction guidelines
To provide efficient post disaster investigation To establish global consensus on:
Extreme wind damage with regard to different construction methods
International guidelines for wind related disaster risk reduction
Wind loading codes and standards
Facilitate regular international workshops and conferences
2.2.3.3 Resilience of buildings and infrastructure
Through the literature review process of this project it has been identified that there are no formal global guidelines for building construction with regard to wind related disasters that are endorsed by the major international expert bodies. This may be due to difficulties in creating international standards including the variance of availability of building materials, experienced professionals and labour in different countries.
35 Post disaster reconstruction methods are under the same circumstances. As Ahmed (2011) and Lloyd-Jones (ed. 2009) indicate that it is common practice to adopt local building and reconstruction practices. Again as an example in Australia post disaster reconstruction may involve reference and adherence to HB132.2-1999 Structural Upgrading of Older Houses – Cyclone Areas. While it may be necessary to adopt local building methods with regards to building materials available, there may be an opportunity to increase disaster resilience through the development of regional or global standards for post disaster infrastructure rebuilding.
2.2.4 Earthquake Risk Management
Unlike storms and floods, earthquakes are not as easy to predict in terms of event occurrence as well as event severity and the effects on communities. This section will provide a brief history which has led to current practices of earthquake event prediction. This will be followed by a discussion of current capabilities to predict injuries, casualties and losses from earthquakes, as well as protection methods and overall risk reduction during earthquake event.
This section will essentially be split into two subcategories, ground shaking and tsunami with discussion of both.
2.2.4.1 Prediction of Earthquake Events and Early Warning
Ground Shaking
The theory of plate tectonics and the use of seismology to explain the earth’s geological system was first accepted in the late 1960’s. Since then technological advances such as Global Positioning Systems (GPS) have helped with monitoring and data gathering however the physics that govern earthquakes is difficult to measure as it is deep in the earth (Wyss 2000).
36 Tsunami
According to the German Centre for Geosciences (2008) 90% of all tsunamis are a direct result of an earthquake. Thus the warning for a tsunami event is limited by the abovementioned earthquake warning times. The 2004 tsunami, as an extreme example, took 15 minutes from the earthquake event to reach land and kill over 140 000 people.
The total death toll of the 2004 tsunami is estimated at 230 000 lives. There was no early warning system for the incoming tsunami in the affected region. As a response to this the Intergovernmental Oceanographic Commission (IOC) has coordinated the implementation of early warning systems in the Indian Ocean, the Mediterranean and the Caribbean (UNESCO 2014), with initial testing indicating that the warning systems are functional (UN News Centre 2011 and UNISDR 2012a).
There are also other organisations that provide tsunami risk management and early warning systems, including the US based National Oceanic and Atmospheric Administration’s National Tsunami Warning Centre.
2.2.4.2 Predicting Earthquake Losses, Casualties and Injuries
Having established that earthquake event prediction is in its infancy and that much more work lies ahead in this area of research, it is therefore necessary to discuss earthquake risk management in its other forms. One of the more recent areas is the development of accurate earthquake scenario modelling and real time loss estimates post event occurrence.
By utilising post earthquake reconnaissance through the use of geo-referenced, metadata embedded digital photography, Bardet and Liu (2010) indicate that losses and damage can be assessed more rapidly and earthquake engineering and scientific knowledge will improve. By means of the ubiquitous camera phone with GPS capability this method of data capture has the potential to increase, this could apply to both ground shaking and tsunami events provided the telecommunications infrastructure remains functional post event.
Ground Shaking
37 planners and risk managers. Real time loss estimates post event for some areas of the globe have been reduced to minutes or even seconds however for other regions, predominately developing regions, this timeframe can be hours or even days. More recently Wyss et al (2012) found, through comparison of event loss predictions and actual post event data, that losses are consistently underestimated by a factor of 2 for small quakes and up to a factor of 700 hundred on average for large quakes. This is due to probabilistic methods of hazard estimation being used, as opposed to deterministic methods including the vulnerability/fragility of infrastructure and soils conditions (Wyss et al 2012).
Tsunami
There are several tsunami modelling methodologies and programs available worldwide from a range of nations, institutions and collaborative joint efforts between bodies. These can be employed to assess risk and run scenarios for individual cities, countries and regions and are an important part of overall risk reduction. IOC (2009) provides a comprehensive guideline for, among other focus areas, the assessment of Indian Ocean coastal community vulnerability through tsunami scenario modelling. Another example is from the USGS (2013) which provides hypothetical tsunami impacts for the Californian coast.
2.2.4.3 Overall Risk Reduction
Ground Shaking
Momani (2012) describes an approach to earthquake risk reduction using set guidelines to integrate modelled earthquake risk, socio-economic conditions and cost-benefit analyses into strategies, plans and procedures. As an example of this integrated approach the Global Earthquake Model (GEM) (2014) addresses the actual mechanisms to implement this by providing:
Risk exposure and consequence databases and the appropriate data capturing tools to populate these databases
Uniform building classification system to capture the structural condition of infrastructure accurately
38 Tsunami
Based on the Indian Ocean methodologies in IOC (2009) the following key points are essential to successful risk reduction:
Initially a clear definition of the geographical area being assessed and the time frame over which the risk reduction measures are to be taken is needed
Strategic mitigation through the utilisation of structural and non-structural mechanisms
Structural mechanisms include both the engineered/built (such as dykes and seawalls) and natural environment (wetland extensions, natural physical barriers and exclusion zones)
Non-structural includes those listed for other hazards e.g. Building codes, guidelines, land use planning, risk transfer and insurance etc Three basic alternative approaches involve: protection from events,
accommodation/living with events and retreat from the high risk areas At all stages of decision making processes the public should be involved Education and awareness of the risks and the reduction techniques are essential
2.3
Chapter Summary and Conclusion
Gross natural disaster risk can be assessed and measured as being the product of a hazard, the exposure of people and infrastructure to this hazard and the vulnerability of these groups to the hazard. Net risk is the ratio of this product, minus the existing mitigation mechanisms in place, to the capacity of the people/infrastructure to adequately respond to the natural disaster hazard.
39 risk to infrastructure has continued to increase at an alarming rate. Further analysis of the statistics has shown that floods, storms and earthquakes are the three most significant natural disaster event types experienced around the world and in South Asia.
40
3
Selected Southern Asia Region Country Study
The previous chapter examined the available natural disaster statistics and risk management strategies at a high level to provide the basis for more specific research. Thus the next chapter incorporates the following sections of this research paper:
The selection of three South Asia countries for analysis
Summary of the 3 key natural disaster events experienced in these selected countries including a brief look at the vulnerability and exposure in those countries
The disaster risk management strategies applied in these countries with regard to these key disaster types
A gap analysis between these countries and global standards
3.1
Selection of 3 Southern Asia Region Countries
Table 1, Table 2 and Table 3 below contain the raw data from EM-DAT (2014) determined the selection of the countries for the detailed study of natural disasters and disaster risk management. The selection was based on the total number of fatalities during time range of 1980 to 2013. The 3 countries with the highest fatality levels were selected for each of the main natural disaster types (floods, storms and earthquakes) and the three dominant countries were chosen.
3.1.1 Earthquakes
41
Country Number of
Earthquakes
Number Killed Total Number
Affected
Total Damage (USUS$ ,000)
Total Annual Average
Total Annual Average
Total Annual Average
Pakistan 25 74,745 2,198 6,722,371 197,717 5,326,500 156,662
Iran Islam Rep
74 74,388 2,188 1,905,159 56,034 11,658,628 342,901
India 18 49,846 1,466 28,501,754 838,287 5,222,300 153,597
Sri Lanka 1 35,399 1,041 1,019,306 29,980 1,316,500 38,721
Afghanistan 28 9,277 273 537,616 15,812 29,060 855
Nepal 4 816 24 709,850 20,878 305,000 8,971
Maldives 1 102 3 27,214 800 470,100 13,826
Bangladesh 7 36 1 19,125 563 500,000 14,706
[image:56.612.109.561.55.269.2]Bhutan 2 12 0 20,028 589 0 0
Table 1: Earthquake Data Summary for SAR 1980-2013 (Source EM-DAT 2014)
3.1.2 Floods
Table 2 below shows that in South Asia India, Bangladesh and Pakistan have the highest fatality levels resulting from flood events. This correlates with the higher total number of affected persons and the total damage as well.
Country Number
of Floods
Number Killed Total Number Affected Total Damage
(USUS$ ,000)
Total Annual Average
Total Annual Average
Total Annual Average
India 202 47,321 1,392 701,776,012 20,640,471 35,698,629 1,049,960
Bangladesh 71 12,576 370 247,627,450 7,283,160 11,228,800 330,259
Pakistan 64 10,372 305 61,340,253 1,804,125 17,798,378 523,482
Nepal 37 5,634 166 3,549,427 104,395 1,037,429 30,513
Afghanistan 69 3,624 107 658,404 19,365 344,000 10,118
Iran Islam Rep
63 3,551 104 3,653,464 107,455 7,652,528 225,074
Sri Lanka 51 1,206 35 11,756,387 345,776 964,064 28,355
Bhutan 3 222 7 1,600 47 0 0
Maldives 2 0 0 1,949 57 6,000 176
[image:56.612.109.562.464.684.2]42 3.1.3 Storms
Table 3 below indicates that fatalities resulting from storm events in South Asia are highest in Bangladesh, India and Pakistan. The data for total number affected and total damages is also higher in these three countries.
Country Number
of Storms
Number Killed Total Number Affected Total D