0022-538X/08/$08.00⫹0 doi:10.1128/JVI.02660-07
Copyright © 2008, American Society for Microbiology. All Rights Reserved.
Deciphering Human Immunodeficiency Virus Type 1 Transmission and
Early Envelope Diversification by Single-Genome Amplification
and Sequencing
䌤
Jesus F. Salazar-Gonzalez,
1# Elizabeth Bailes,
2# Kimmy T. Pham,
1Maria G. Salazar,
1M. Brad Guffey,
1Brandon F. Keele,
1Cynthia A. Derdeyn,
3Paul Farmer,
3Eric Hunter,
3Susan Allen,
4Olivier Manigart,
4Joseph Mulenga,
4Jeffrey A. Anderson,
5Ronald Swanstrom,
6Barton F. Haynes,
7Gayathri S. Athreya,
8Bette T. M. Korber,
8Paul M. Sharp,
9George M. Shaw,
1,10and Beatrice H. Hahn
1,10*
Departments of Medicine1and Microbiology,10University of Alabama at Birmingham, Birmingham, Alabama 35294; Institute of
Genetics, University of Nottingham, Nottingham NG7 2UH, United Kingdom2; Department of Pathology and Laboratory Medicine,
Emory University, Atlanta, Georgia 303293; Zambia-Emory HIV Research Group (ZEHRG) and Zambia Blood Transfusion
Service, Lusaka, Zambia4; Department of Internal Medicine5and UNC Center for AIDS Research,6University of
North Carolina, Chapel Hill, North Carolina 27599; Duke Human Vaccine Institute, Duke University Medical
Center, Durham, North Carolina 277107; Los Alamos National Laboratory, Los Alamos, New Mexico 875458;
and Institute of Evolutionary Biology, University of Edinburgh, Edinburgh EH9 3JT, United Kingdom9
Received 14 December 2007/Accepted 29 January 2008
Accurate identification of the transmitted virus and sequences evolving from it could be instrumental in elucidating the transmission of human immunodeficiency virus type 1 (HIV-1) and in developing vaccines,
drugs, or microbicides to prevent infection. Here we describe an experimental approach to analyze HIV-1env
genes as intact genetic units amplified from plasma virion RNA by single-genome amplification (SGA), followed by direct sequencing of uncloned DNA amplicons. We show that this strategy precludes in vitro
artifacts caused byTaq-induced nucleotide substitutions and template switching, provides an accurate
repre-sentation of theenvquasispecies in vivo, and has an overall error rate (including nucleotide misincorporation,
insertion, and deletion) of less than 8ⴛ10ⴚ5. Applying this method to the analysis of virus in plasma from
12 Zambian subjects from whom samples were obtained within 3 months of seroconversion, we show that
transmitted or early founder viruses can be identified and that molecular pathways and rates of early env
diversification can be defined. Specifically, we show that 8 of the 12 subjects were each infected by a single virus, while 4 others acquired more than one virus; that the rate of virus evolution in one subject during an 80-day
period spanning seroconversion was 1.7ⴛ10ⴚ5 substitutions per site per day; and that evidence of strong
immunologic selection can be seen in Env and overlapping Rev sequences based on nonrandom accumulation of nonsynonymous mutations. We also compared the results of the SGA approach with those of more-conventional bulk PCR amplification methods performed on the same patient samples and found that the
latter is associated with excessive rates ofTaq-induced recombination, nucleotide misincorporation, template
resampling, and cloning bias. These findings indicate that HIV-1 env genes, other viral genes, and even
full-length viral genomes responsible for productive clinical infection can be identified by SGA analysis of plasma virus sampled at intervals typical in large-scale vaccine trials and that pathways of viral diversification and immune escape can be determined accurately.
The transmission of human immunodeficiency virus type 1 (HIV-1) and the establishment of a productive infection are complex biological processes, the precise mechanisms of which remain to be elucidated. Because most HIV-1 transmissions result from virus exposure at mucosal surfaces and because there is a delay of approximately 1 to 3 weeks between virus infection and the first detection of viral RNA (vRNA) in the blood, it has been difficult to study the molecular details of HIV-1 transmission and early diversification in humans (12, 30,
42). Initial studies of sexually acquired HIV-1 infection sug-gested that virus populations in the acute phase are generally genetically highly homogeneous, in contrast to the more het-erogeneous viral populations found in chronic infections (4, 5, 52, 55–57). This observation, along with the observation that new infections are almost always caused by CCR5-tropic vi-ruses, suggested that HIV-1 infection is associated with a trans-mission “bottleneck.” Morecent studies, however, have re-ported heterogeneous virus populations near the time of infection, including in samples from female sex workers from Kenya and South Africa (11, 21, 22, 31) and in samples from men who had sex with men in the United States (32), suggest-ing that the routes and circumstances of infection may affect the complexity of the transmitted virus (36). In particular, sexually transmitted diseases, high viral loads in the donor, and
* Corresponding author. Mailing address: Department of Medicine, University of Alabama at Birmingham, 720 20th Street South, Kaul 816, Birmingham, AL 35294. Phone: (205) 0412. Fax: (205) 934-1580. E-mail: [email protected].
# These authors contributed equally to the work. 䌤Published ahead of print on 6 February 2008.
3952
on November 8, 2019 by guest
http://jvi.asm.org/
particular routes of transmission increase the transmission ef-ficiency of HIV-1 (28, 29, 48, 49) and may favor the transmis-sion of multiple HIV-1 variants. Finally, it has been suggested that the transmission of multiple variants is common, but that homogenization of viral sequences occurs in the postinfection period (15). Thus, while it is clear that HIV-1 infection can result from the transmission of a single or more than one virus, little else is known about the quantitative or qualitative fea-tures of HIV-1 transmission, including the identities and phe-notypic properties of the transmitted viruses.
Differing findings concerning the complexity of viruses in the acute and early phases of HIV-1 infection likely result from a combination of factors, including differences in study popula-tions and associated risk behaviors; various clinical and labo-ratory definitions of acute, early, and chronic infection; and different experimental strategies used to analyze the genetic complexity of the evolving viral quasispecies postinfection. Chief among these are differences in the experimental designs and the methodologies used. A common approach has been to identify subjects within the first several months following in-fection and to derive viral sequences by bulk or near-limiting-dilution PCR amplification of proviral DNA or plasma RNA in samples obtained from them, followed by cloning, sequencing, and phylogenetic analysis (2, 4, 5, 9, 15, 21, 24, 31, 32, 36, 37, 57). In addition, acute infection cases have been analyzed by using the heteroduplex tracking assay (HTA) (4, 15, 21, 31, 32). While these approaches provide a first approximation of the complexity of transmitted virus(es), they have significant limi-tations. HTA, for example, interrogates only a fraction of the gene of interest and does not provide sequence information (4, 15, 21, 31, 32). Consequently, HTA allows for only qualitative inferences regarding the genetic complexity of virus popula-tions. Bulk and near-endpoint PCR followed by cloning and sequencing are compromised by Taq polymerase-mediated template switching, which generates recombinants in vitro that do not exist in vivo (6, 26, 35, 43, 54); the introduction ofTaq polymerase errors into cloned products (27); and nonpropor-tional representation of target sequences due to template re-sampling (44, 45) or unequal template amplification and clon-ing (20, 27). Verified endpoint titration of viral nucleic acids eliminates PCR-induced recombination and ensures the pro-portional representation of target sequences (43), but if the amplicon is molecularly cloned prior to sequencing (as is gen-erally the case), it will containTaq-induced nucleotide misin-corporations (27).
In this study, we sought to develop an experimental strategy that would allow us to amplify and sequence complete HIV-1 envgenes from virion RNA in the plasma of infected individ-uals while avoiding methodological artifacts inherent in previ-ously used approaches. To this end, we adapted methods de-scribed by Palmer and colleagues, who used single-genome sequencing of unclonedpro-polamplicons to identify geneti-cally linked drug resistance mutations in plasma-derived virus (27). The newly developed methods were applied to charac-terize the evolving quasispecies in a cohort of heterosexual Zambian subjects with acute or early HIV-1 clade C (or other) infections who were screened at 3-month intervals for evidence of incident infections. We also compared the results obtained by single-genome amplification (SGA)-direct sequencing with those obtained by more-conventional bulk PCR cloning and
sequencing methods on the same clinical specimens and de-veloped methods for evaluating the sample misidentification and cross-contamination that invariably occur in the setting of a large field trial. Our results define an effective experimental strategy for the molecular analysis of the transmission of HIV-1 and its early evolution in cohorts with differing risk behaviors and in vaccine trials where the identification of transmitted viruses and molecular pathways of virus immune escape can be instrumental in assessing vaccine efficacy or failure.
MATERIALS AND METHODS
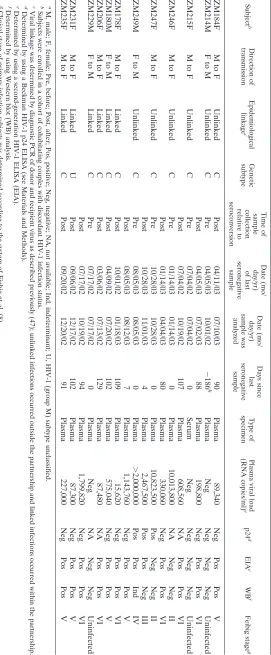
Subjects.The 12 subjects whose infections are characterized in this study were enrolled in a cohort of heterosexual couples with discordant HIV infection status (where one partner is HIV-1 infected and the other is uninfected) which was established in Lusaka, Zambia, in 1994 to provide voluntary HIV-1 testing and counseling, health care, and longitudinal monitoring for incident infections (1, 25). Although the number of new HIV-1 infections in this cohort has been less than the number in the general population, seroconversion still occurs at a frequency of 8.5 per 100 person years, with similar female and male-to-female transmission rates (7). HIV-1-negative subjects were monitored for an-tibody seroconversion at 3-month intervals, and all new infections were molec-ularly characterized to determine whether they had resulted from transmission by the cohabiting partner (“linked” transmission) or a different individual (“un-linked” transmission) (47). Six of the 12 individuals included in the current study had epidemiologically linked infections, while the other six had unlinked infec-tions. Since the primary purpose of this study was to develop and validate a new experimental strategy to infer transmitted HIV-1envgenes, no attempt was made to match the demographic or laboratory characteristics of subjects with linked or unlinked infections.
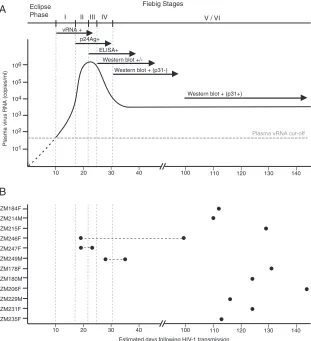
Laboratory staging of primary HIV-1 infection.The subjects were classified according to the system of Fiebig et al. (8) that is based on the detection of HIV-1-specific RNA, antigen, and antibody in plasma (Fig. 1). The Fiebig clas-sification includes an eclipse phase that precedes the first detection of vRNA and subsequent stages defined by the orderly appearance of viral markers: stage I (vRNA positive, p24 antigen and antibody negative), stage II (vRNA and p24 antigen positive, antibody negative), stage III (enzyme-linked immunosorbent assay [ELISA] antibody positive, Western blot negative), stage IV (ELISA pos-itive, Western blot indeterminant), stage V (ELISA and Western blot pospos-itive, p31 integrase antibody negative), and stage VI (ELISA, Western blot, and p31 integrase antibody positive). Plasma samples from the patients were tested for HIV-1 antibodies by ELISA (Enzygnost HIV integral from Dade Behring, Mar-burg, Germany; Biotest anti-HIV tetra ELISA from Biotest, Dreieich, Germany; or Abbott Murex HIV Ag/Ab combination assay from Murex Biotech Limited, Dartford, United Kingdom) and Western blot analysis (Genetics Systems HIV-1 Western blot from Bio-Rad Laboratories, Hercules, CA). In accordance with diagnostic guidelines, a positive Western blot was defined as reactivity with any two of the following three HIV-1 proteins: the exterior envelope glycoprotein/ uncleaved envelope precursor (gp120/gp160), the transmembrane envelope gly-coprotein (gp41), and the major core protein (p24). An indeterminate Western blot was defined as any visible band that did not meet the positivity criteria. A negative Western blot included no visible bands. A subset of samples was also monitored for p24 antigen by using a Beckman Coulter HIV-1 p24 antigen ELISA (Beckman Coulter Inc., Fullerton, CA).
RNA extraction.For plasma specimens containing⬎10,000 RNA copies/ml, plasma RNA was extracted by using a QIAamp viral RNA mini kit (Qiagen, Valencia, CA). Samples with vRNA loads of⬍10,000 copies/ml were concen-trated by centrifugation at 23,600⫻gfor 1 h at 4°C prior to the same extraction procedure. RNA was recovered from the spin columns in a final elution volume of⬃50l. For SGA and bulk PCR methods, between 1,000 and 20,000 vRNA molecules were typically reverse transcribed.
cDNA synthesis.Reverse transcription of RNA to single-stranded cDNA was performed by using the SuperScript III protocol according to the manufacturer’s instructions (Invitrogen Life Technologies, Carlsbad, CA). RNA, deoxynucleo-side triphosphates (0.5 mM each), and 0.25M primer OFM19 (5⬘-GCACTC AAGGCAAGCTTTATTGAGGCTTA-3⬘; nucleotides [nt] 9604 to 9632 of the HXB2 sequence) were incubated for 5 min at 65°C to denature secondary structure of the RNA. First-strand cDNA synthesis was carried out in 20- to 100-l reaction mixtures with 1⫻reverse transcriptase buffer containing 5 mM dithiothreitol, 2 U/l of an RNase inhibitor (RNaseOUT), and 10 U/l
on November 8, 2019 by guest
http://jvi.asm.org/
Script III. For SGA, the reaction mixture was incubated at 50°C for 60 min followed by an additional hour at 55°C. For bulk PCR, the reaction mixture was incubated at 55°C for 60 min. Following the completion of the reverse transcrip-tion step, the reactranscrip-tion mixture was inactivated by being heated to 70°C for 15 min followed by RNase H digestion at 37°C for 20 min (Invitrogen Life Technologies, Carlsbad, CA). The resulting cDNA was used immediately for PCR or kept frozen at⫺80°C until further analysis.
Standard (bulk)envgene amplification.Full-lengthrev/envcassettes (includ-ing parts of the first exon of thetatgene; the entirevpu,rev, andenvgenes; and parts of thenefgene) were amplified by nested PCR from plasma-derived viral cDNA as previously described (5, 50, 51). Briefly, 1l of bulk cDNA (containing 100 to 1,000 viral templates) was subjected to first-round PCR in a volume of 20 l. PCR was performed by using an Expand High Fidelity PCR system (Roche Diagnostic Corporation, Indianapolis, IN) in 1⫻Expand PCR buffer containing 1.5 mM MgCl2, 0.2 mM of each deoxynucleoside triphosphate, and 0.2M of
Vif1 (5⬘-GGGTTTATTACAGGGACAGCAGAG-3⬘; nt 4900 to 4923) and OFM19 primers. The following cycling conditions were used: 94°C for 2 min followed by 35 cycles of 94°C for 15 s, 55°C for 30 s, and 68°C for 4 min, with a final extension of 68°C for 10 min. Second-round PCR was performed by using 1l of the first-round PCR product and primers EnvA (5⬘GGCTTAGGCAT CTCCTATGGCAGGAAGAA-3⬘; nt 5954 to 5982) and EnvN (5⬘-CTGCCAA TCAGGGAAGTAGCCTTGTGT-3⬘; nt 9145 to 9171) under the same condi-tions used for the first-round PCR. To ensure that the amplified HIV-1env sequences were representative of the plasma quasispecies, five independent nested PCRs were carried out for each specimen (20, 41). The final PCR prod-ucts were analyzed by 1% agarose gel electrophoresis, and prodprod-ucts of the
predicted size (⬃3.2 kb) were ligated into the pcDNA3.1.V5-His TOPO TA vector according to the manufacturer’s instructions (Invitrogen Life Technolo-gies, Carlsbad, CA). The ligated vector was transformed into Stbl2 cells at 42°C for 25 s (Invitrogen Life Technologies, Carlsbad, CA). Transformed reaction mixtures were plated on LB-Amp (ampicillin; 100g/ml) plates and cultured overnight at 30°C. Multiple colonies were picked and grown in LB broth (100 g/ml ampicillin), and plasmid DNA was isolated by using a QIAprep spin miniprep kit (Qiagen, Valencia, CA). The resulting plasmid DNA was subjected to restriction enzyme digestion to identify full-length clones, and 10 to 37 env-containing clones from each patient were sequenced.
SGA.For SGA of the full-lengthenvgenes, cDNA was endpoint diluted in 96-well plates such that fewer than 29 PCRs yielded an amplification product. According to a Poisson distribution, the cDNA dilution that yields PCR products in no more than 30% of wells contains one amplifiable cDNA template per positive PCR more than 80% of the time. First-round PCR was carried out in 1⫻ High Fidelity platinum PCR buffer, 2 mM MgSO4, 0.2 mM of each
[image:3.585.137.448.69.410.2]deoxynucleo-side triphosphate, 0.2M of primers Vif1 and OFM19, and 0.025 U/l platinum TaqHigh Fidelity polymerase (Invitrogen, Carlsbad, CA) in a 20-l reaction mixture. The PCR mixtures were set up in MicroAmp optical 96-well reaction plates (Applied Biosystems, Foster City, CA) and sealed with ABI MicroAmp adhesive film. The following PCR conditions were used: 94°C for 2 min followed by 35 cycles of 94°C for 15 s, 55°C for 30 s, and 68°C for 4 min, with a final extension of 68°C for 10 min. Second-round PCR was carried out using 1 to 2l of the first-round product and 0.2M of primers EnvA and EnvN with the same PCR mixture as the first round. The PCR conditions included: 94°C for 2 min followed by 45 cycles of 94°C for 15 s, 55°C for 30 s, and 68°C for 4 min, with a FIG. 1. Laboratory staging of acute and early HIV-1 infections. (A) Temporal appearance of HIV-1-specific laboratory markers following HIV-1 infection according to the classification system of Fiebig et al. (8). The eclipse phase is defined by the interval between transmission and first detection of vRNA in the plasma and generally lasts about 10 days, with a range of approximately 7 to 21 days (3, 10, 17–19, 40). The mean durations of Fiebig stages I (7 days), II (5 days), III (3 days), IV (6 days), and V/VI (70⫹days) are indicated. (B) Time points (xaxis) at which plasma samples were obtained for each of the 12 study subjects (yaxis). Because subjects were studied at intervals of⬃3 months, the symbols are positioned to represent the maximum possible number of days from transmission.
on November 8, 2019 by guest
http://jvi.asm.org/
final extension at 68°C for 10 min. The amplicons were sized on precast 1% agarose E-gel 96 (Invitrogen Life Technologies, Carlsbad, CA). All products derived from cDNA dilutions yielding less than 30% PCR positivity were se-quenced. A standard operating procedure for SGA derivation of full-lengthenv genes is available upon request.
Generation of vRNA transcripts from HIV-1 molecular clones with T7 poly-merase.Envelope genes corresponding to two transmitted strains of HIV-1 (BORId9.4F8 and BORId9.4F12) obtained from the plasma of an acutely in-fected individual were directionally cloned into the viral expression vector pcDNA3.1D (Invitrogen Life Technologies, Carlsbad, CA) under the control of the T7 promoter. These plasmids were digested with EcoRV, and linear DNA was recovered by QIAquick gel extraction (Qiagen, Valencia, CA) following electrophoresis in 1% agarose.envRNA transcripts were generated using a Riboprobe in vitro transcription system (Promega, Madison, WI) by incubating 700 ng template DNA with T7 polymerase at 37°C for 80 min and utilizing a standard 100-l-volume transcription protocol under the following conditions: 1⫻optimized transcription buffer; 10 mM dithiothreitol; 0.5 mM rATP, rGTP, rCTP, and rUTP; 100 U rRNasin RNase inhibitor; and 80 U T7 polymerase. Following transcription, the DNA template was degraded with 1 U perg of template RQ1 RNase-free DNase (Promega, Madison, WI) for 15 min at 37°C. RNA molecules of more than 200 nucleotides were concentrated with RNeasy MinElute cleanup (Qiagen, Valencia, CA) and stored at⫺80°C. The RNA’s mass was determined by spectrophotometry (NanoDrop 1000), and the copy number estimated assuming that all transcripts were full-length. RNA transcripts (BORId9.4F8 and BORId9.4F12) were mixed 1:1 at an estimated 100,000 copies total. RNA transcripts were reverse transcribed into cDNA (using primer Env3in; see below) which was then diluted to the single-molecule level prior to PCR amplification as described above, with the following primer modification: for first-round PCR, primer Env5in (5⬘-TTAGGCATCTCCTATGGCAGGAA GAAG-3⬘; nt 5957 to 5983) and antisense primer Env3in (5⬘-GTCTCGAGAT ACTGCTCCCACCC-3⬘; nt 8904 to 8882) were used, and for second-round PCR, primers 3⬘R3BG (5⬘-CCTATCTGTCCCCTCAGCTACTGC-3⬘; nt 8510 to 8531) and 5⬘F3BG (5⬘-CGACGAAGACCTCCTCAAGACAG-3⬘; nt 5993 to 6015) were used. A total of 59 envelope genes representing 145,590 bases were sequenced and compared to the inputenvsequences to detect recombination during cDNA synthesis and to identify all transversion, transition, and insertion-deletion mutations.
Generation of virion RNA by transfection of 293T cells with HIV-1 molecular clones.The infectious molecular clones YU2 and SG3 were independently trans-fected into 293T cells (Fugene; Roche Diagnostic Corporation, Indianapolis, IN) and cultured for 48 h to generate viral stocks. The virus concentration was determined by using an Amplicor vRNA assay, version 1.5 (Roche Diagnostic Corporation, Indianapolis, IN). Equal numbers of RNA molecules from each virus stock were mixed 1:1, and 20,000 vRNA copies were extracted by using a QIAamp viral RNA mini kit (Qiagen, Valencia, CA). Purified vRNA was reverse transcribed into cDNA (using primer Env3out; see below) and diluted to the single-molecule level prior to PCR amplification as described above, with the following primer modifications: for first-round PCR, primer Env5out (5⬘-TAG AGCCCTGGAAGCATCCAGGAAG-3⬘; nt 5853 to 5877) and antisense primer Env3out (5⬘-TTGCTACTTGTGATTGCTCCATGT-3⬘; nt 8913 to 8936) were used, and for second-round PCR, primer Env5in (5⬘-TTAGGCATCTCCTATG GCAGGAAGAAG-3⬘; nt 5957 to 5983) and antisense primer Env3in (5⬘-GTC TCGAGATACTGCTCCCACCC-3⬘; nt 8904 to 8882) were used. A total of 50 envelope genes representing 132,839 bases was sequenced and compared to the inputenvsequences to detect recombination during cDNA synthesis and to identify all transversion, transition, and insertion-deletion mutations.
DNA sequencing.Viralenvgenes were sequenced by using BigDye Terminator chemistry and the protocols recommended by the manufacturer (Applied Bio-systems, Foster City, CA). The sequences were determined by using an ABI 3730xl genetic analyzer (Applied Biosystems, Foster City, CA) and edited by using the Sequencher program, version 4.7 (Gene Codes, Ann Arbor, MI). Both strands of DNA were sequenced. All chromatograms were carefully inspected for sites of ambiguous sequence (double peaks), and those that contained one or more positions of mixed bases were excluded from further analysis.
Microsatellite analysis.Samples with heterogeneous infections were examined for potential misidentification by microsatellite analysis using an AmpFlSTR Identifiler PCR amplification kit following the manufacturer’s instructions (Ap-plied Biosystems, Foster City, CA). Briefly, DNA was extracted from 200l of plasma by using a QIAamp DNA blood minikit (Qiagen, Valencia, CA) and used for the amplification of 15 highly polymorphic microsatellite loci (D8S1179, D21S11, D7S820, CSF1PO, D3S1358, TH01, D13S317, D16S539, D2S1338, D19S433, vWA, TPOX, D18S51, D5S818, and FGA) and a portion of the amelogenin gene for gender identification in a single PCR amplification. The
amplicons were sized by using an ABI 3130 genetic analyzer. Data analysis and allele designations were carried out by using the GeneMarker program (Soft-Genetics LLC). The selected markers are widely accepted tetranucleotide loci for genetic characterization, standardized under the Combined DNA Index System (CODIS).
Phylogenetic analyses.Env protein sequences from each subject were aligned using CLUSTAL W (46), and amino acids were then replaced by codons. In-trastrain diversities were calculated by using uncorrected sequence distances. For all other analyses, the alignments were gap stripped and sequences with large deletions were excluded. All trees were constructed by using the neighbor joining method (38) implemented in CLUSTAL W using Kimura’s correction (14). The following subtype C sequences were included for reference: 98ZA502 (GenBank accession no. AY158534), DU151 (GenBank accession no. DQ41185), DU422 (GenBank accession no. DQ411854), TV012 (GenBank accession no. AF391243), TV002 (GenBank accession no. AF391232), SK144B1 (GenBank accession no. AY703911), and BWMC168 (GenBank accession no. AF443087).
Recombination breakpoint analysis.Diversity plots were used to map break-points in putative recombinants. The percent diversity betweenenvnucleotide sequences of a presumed recombinant and each of two parental strains believed to have been involved in the recombination event was determined by moving a window of 100 bp along an alignment in 10-bp increments. The distance values for each of these pairwise comparisons were plotted at the midpoint of the 100-bp segment. Sites where the putative mosaic was equidistant from both parents (i.e., sites where the two parental distance lines crossed) were scored as recombination crossovers (due to the window size of 100 bp, the positions of these breakpoints are only approximate). If the sequence distance between the recombinant and both putative parents was greater than 0.05 (yaxis), then this sequence was scored as being of unknown origin. If the recombinant was iden-tical to one putative parental sequence, then that sequence was taken to be the parent, even if the nucleotide sequence distance in the window to the other parent was less than 0.05. Finally, if the recombinant was identical to both parents, no recombination breakpoint was invoked. All recombinants were con-firmed by phylogenetic tree analysis.
Statistical analyses.Power calculations were performed to estimate the like-lihood of missing infrequent viral variants present in patient plasma but not sampled and represented in ourenvanalyses. From probability theory, withn plasma vRNA sequences, there is a 95% likelihood that a given missed variant comprises a fractionf(or less) of the virus population wheref⫽1⫺0.051/n. For
n⫽20,fis less than 14%; forn⫽30,fis less than 10%; and forn⫽40,fis less than 8%.
We also estimated the probability that observed clusters of nonsynonymous mutations in the Rev and Env coding regions could occur by chance; if the estimated likelihood is small, we may infer that the clusters reflect selection of variant amino acid sequences. We considered 9-codon windows because this was the length of the observed clusters, and this is also the length of a typical T-cell epitope. From the binomial expansion, the probability of seeing at least the observed number (k) of clustered mutations within a single 9-mer is
r⫻
冘
k⬘ ⫽k m
冉
mk⬘
冊
pk⬘共1⫺p兲m⫺k⬘whereris the number of potential 9-mers,mis the total number of mutations relative to the consensus, andpis the probability that a mutation falls by chance in any particular 9-mer. We calculated the probability only fork⬘ ⫽k, since the results for allk⬘ ⬎kare very much smaller and can be ignored. Only nonsyn-onymous mutations were included in the analysis. Within the 9-mers of interest, but not elsewhere along the alignment, many of the mutations occurred in multiple sequences. These multiple occurrences of the same mutation could reflect common ancestry, although this is unlikely unless the mutations had conferred a selective advantage; nevertheless, to be conservative, we considered only distinct mutations in the analysis.
Nucleotide sequence accession numbers.The GenBank accession numbers for all env sequences determined in this study are EU166353 to EU166402, EU166413 to EU166473, EU166483 to EU166517, and EU166544 to EU166916, except for one bulk-amplified sequence (DQ388514) which was reported previ-ously.
RESULTS
Assay validation. The main objective of this study was to
develop and implement an experimental approach that would
on November 8, 2019 by guest
http://jvi.asm.org/
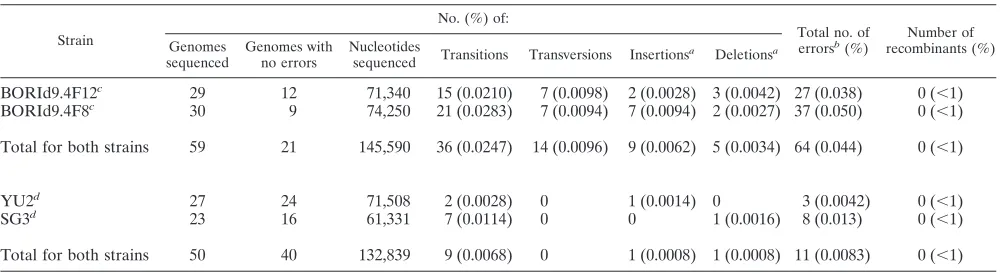
yield an accurate representation of the HIV-1 env genes in plasma vRNA such that meaningful inferences concerning their genetic (and ultimately, biological) properties could be drawn. To this end, we first tested the performance of the SGA-direct sequencing method using in vitro-generated HIV-1 RNA templates. Two different approaches were used to generate RNA templates from different sets of cloned HIV-1 DNA so as to account for (i) differences in fidelities between T7 and human Pol II RNA polymerases and (ii) differences in recombination rates between more- or less-related HIV-1 DNA templates. In the first set of experiments, we used T7 polymerase to synthesize vRNA from two HIV-1env clones derived from an acutely infected subject (BORI0637) in whom we had observed extensive env gene recombination in vivo (B. F. Keele, unpublished data). The two clones, BORId9.4F12 and BORId9.4F8, are 97.2% identical and represent the prog-eny of two transmitted variants in this subject. From a 1:1 mixture of the two RNA genomes carried through cDNA syn-thesis and SGA-direct sequencing, we obtained 59 full-length envsequences, corresponding to 145,000 nucleotides. In none of the sequences did we find evidence for recombination be-tween the two genomes. The combined T7 polymerase and Superscript III nucleotide misincorporation rate was 4.39 ⫻ 10⫺4, consisting mainly of random nucleotide
misincorpora-tions (3.43 ⫻ 10⫺4) but also of single or double nucleotide
insertions or deletions in runs of common nucleotides (9.61⫻ 10⫺5). Finally, transcripts from the two molecular clones were
recovered in equal proportions, demonstrating that heteroge-neous templates are accurately represented using the SGA approach (Table 1).
In a second set of experiments, we transfected 293T cells with infectious molecular clones of HIV-1 (YU2 and SG3) and collected virions from the culture supernatants for analysis. This was done to avoid T7 polymerase contributions to the measured error rate and to more closely replicate in vivo con-ditions of HIV-1 gene expression and replication. The env genes of YU2 and SG3 are 92.5% identical. Virion RNA preparations from the two strains were mixed 1:1 and sub-jected to cDNA synthesis and SGA-direct sequencing. Again, the inspection of 50envsequences corresponding to more than 132,000 nucleotides failed to yield evidence of recombination
but provided a nearly equal representation of both input strains (Table 1). The combined error rate using RNA Pol II and Superscript III was 8.28 ⫻ 10⫺5, consisting of random
nucleotide substitutions (6.77⫻ 10⫺5) and single-nucleotide
insertions or deletions in runs of A or T residues (1.51⫻10⫺5).
Of note,Taqpolymerase misincorporations do not contribute to this error rate because either they appear as mixed bases in sequence chromatograms (if introduced during the first rounds of amplification) and are thus discarded or they remain unde-tected because they affect only a minor fraction of the ampli-fied molecules. Thus, in addition to precluding artifactual re-combination, SGA-derived sequences are not affected byTaq polymerase-induced errors. These results, along with the rates of transitions, transversions, insertions, and deletions, are sum-marized in Table 1.
Laboratory staging of acute and early HIV-1 infection in
subjects.In order to evaluate the sequence diversity of HIV-1
[image:5.585.43.543.79.216.2]in relation to the estimated duration of infection, we adopted the Fiebig classification (8), which categorizes patients based on an orderly and reproducible appearance of HIV-1-specific markers in the plasma (Fig. 1A). The eclipse phase is defined by the interval between virus transmission and the first detec-tion of vRNA in the plasma and is believed to last on average about 10 days, with a range of approximately 7 to 21 days (3, 10, 17–19, 40). The mean durations of Fiebig stages I (7 days), II (5 days), III (3 days), IV (6 days), and V/VI (70⫹days) are indicated. The 95% confidence intervals (CI) were calculated and reported elsewhere (8). The timing of patient sampling (Fig. 1B) was determined from the clinical record and by anal-ysis of plasma vRNA, p24 antigen, and antibody, and all were in good agreement (Table 2). Two subjects (ZM246F and ZM247F) were initially studied during Fiebig stage II, when their plasma vRNA levels were extremely high and HIV-1 antibody was undetectable. Subject ZM249M was first studied during Fiebig stage IV, when plasma vRNA was still high and antibodies were detectable by ELISA but the Western blot pattern was indeterminant. Based on estimates of Fiebig stage durations, this sample was still expected to have been obtained within⬃31 days of infection. Subjects ZM246F, ZM247F, and ZM249M were each studied at a second time point 4 to 80 days after the first. The other nine subjects were studied on a single
TABLE 1. Determination of SGA-direct sequencing error rates using in vitro-synthesized HIV-1 RNA templates
Strain
No. (%) of:
Total no. of errorsb
(%)
Number of recombinants (%) Genomes
sequenced
Genomes with no errors
Nucleotides
sequenced Transitions Transversions Insertions
a
Deletionsa
BORId9.4F12c 29 12 71,340 15 (0.0210) 7 (0.0098) 2 (0.0028) 3 (0.0042) 27 (0.038) 0 (⬍1)
BORId9.4F8c 30 9 74,250 21 (0.0283) 7 (0.0094) 7 (0.0094) 2 (0.0027) 37 (0.050) 0 (⬍1)
Total for both strains 59 21 145,590 36 (0.0247) 14 (0.0096) 9 (0.0062) 5 (0.0034) 64 (0.044) 0 (⬍1)
YU2d 27 24 71,508 2 (0.0028) 0 1 (0.0014) 0 3 (0.0042) 0 (⬍1)
SG3d 23 16 61,331 7 (0.0114) 0 0 1 (0.0016) 8 (0.013) 0 (⬍1)
Total for both strains 50 40 132,839 9 (0.0068) 0 1 (0.0008) 1 (0.0008) 11 (0.0083) 0 (⬍1)
a
Insertion or deletion of 1 or 2 A or T nucleotides to a preexisting run of A or T residues.
b
Total errors including transitions, transversions, insertions, and deletions.
c
T7-generated HIV-1 RNA transcripts were mixed 1:1 and subjected to SGA analysis as described in the text.
d
HIV-1 vRNA from transfected human 293T cell culture supernatants was mixed 1:1 and subjected to SGA analysis as described in the text.
on November 8, 2019 by guest
http://jvi.asm.org/
TABLE 2. Epidemiological and laboratory information for primary infection subjects a Subject b Direction of transmission Epidemiological linkage c Genetic subtype Time of sample collection relative to seroconversion Date (mo/ day/yr) of last seronegative sample Date (mo/ day/yr) sample was analyzed Days since last seronegative sample Type of specimen Plasma viral load (RNA copies/ml) e p24 d EIA e WB f Feibig stage g ZM184F M to F Unlinked C Post 04/11/03 07/10/03 90 Plasma 89,340 Neg Pos Pos V ZM214M F to M Unlinked C Pre 04/05/03 10/01/02 ⫺ 186 h Plasma Neg Neg Neg Neg Uninfected Post 04/05/03 07/02/03 88 Plasma 198,800 Neg Pos Pos VI ZM215F M to F Unlinked C Pre 07/04/02 07/04/02 0 Serum Neg Neg Neg Neg Uninfected Post 07/04/02 10/19/02 107 Plasma 608,560 NA Pos Pos VI ZM246F M to F Unlinked C Pre 01/14/03 01/14/03 0 Plasma 10,013,800 NA Neg Neg II Post 01/14/03 04/04/03 80 Plasma 330,060 Neg Pos Pos VI ZM247F M to F Unlinked C Pre 10/28/03 10/28/03 0 Plasma 10,823,500 Pos Neg Neg II Post 10/28/03 11/01/03 4 Plasma 2,467,500 Pos Pos Neg III ZM249M F to M Unlinked C Pre 08/05/03 08/05/03 0 Plasma ⬎ 2,000,000 Pos Pos Ind IV Post 08/05/03 08/12/03 7 Plasma 1,143,760 Neg Pos Pos V ZM178F M to F Linked C Post 10/01/02 01/18/03 109 Plasma 15,620 Neg Pos Pos VI ZM180M F to M Linked C Post 04/09/02 07/20/02 102 Plasma 575,040 Neg Pos Pos V ZM206F M to F Linked C Post 03/06/02 07/13/02 129 Plasma 87,480 NA Pos Pos VI ZM229M F to M Linked C Pre 07/17/02 07/17/02 0 Plasma Neg NA Neg Neg Uninfected Post 07/17/02 10/19/02 94 Plasma 1,799,820 Neg Pos Pos VI ZM231F M to F Linked U Post 09/06/02 12/17/02 102 Plasma 87,300 Neg Pos Pos V ZM235F M to F Linked C Post 09/20/02 12/20/02 91 Plasma 227,000 Neg Pos Pos V a M, male; F, female; Pre, before; Post, after; Pos, positive; Neg, negative; NA, not available; Ind, indeterminant; U, HIV-1 (group M) subtype unclass ified. b Subjects were enrolled in a cohort of cohabitating couples with discordant HIV-1 infection status. c Viral linkage was determined by diagnostic PCR of donor and recipient virus as described previously (47); unlinked infections occurred outside the p artnership and linked infections occurred within the partnership. d Determined by using a Beckman HIV-1 p24 ELISA (see Materials and Methods). e Determined by using a second-generation HIV-1 ELISA (EIA). f Determined by using Western blot (WB) analysis. g Clinical stage of primary infection subjects was determined according to the system of Fiebig et al. (8). h Plasma was obtained 186 days prior to the last seronegative sample.
on November 8, 2019 by guest
http://jvi.asm.org/
[image:6.585.156.427.70.725.2]occasion no more than 99 to 151 days after infection, according to their clinical records (Table 2).
env gene diversity in acute and early infections.A total of
417 SGA-derived full-lengthenvgene sequences were obtained
[image:7.585.134.454.68.608.2]from the 12 subjects, with a range of 24 to 49 sequences per subject. A phylogenetic tree of theseenvsequences is shown in Fig. 2. Eleven subjects were infected with HIV-1 subtype C; one individual (ZM231F) harbored a strain that fell outside
FIG. 2. Env quasispecies complexity in 12 primary infection subjects from Zambia. A neighbor-joining tree of SGA-derived full-lengthenv sequences is shown. Brackets encompass sequences from each study subject, as indicated. Asterisks at nodes indicate 90% or higher bootstrap values (shown only on branches whose length exceeds 0.003 substitutions per site). The scale bar represents 0.01 nucleotide substitutions per site. 98ZA502, DU151, DU422, TV012, TV002, SK144B1, and BWMC168 represent subtype C reference sequences. ZM231F falls outside all known group M subtypes and thus remains unclassified.
on November 8, 2019 by guest
http://jvi.asm.org/
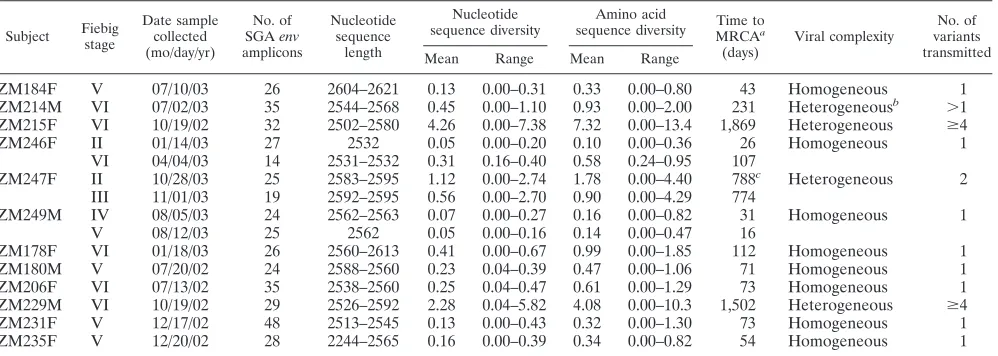
the established group M subtypes and thus remained unclas-sified. The mean within-patientenvnucleotide diversity ranged from 0.05% to 4.26%, and the maximum within-patient env nucleotide diversity ranged from 0.16% to 7.38% (Table 3). Based on these values, the subjects could be divided into two groups: those with maximum within-patient env diversities greater than 1.0% (subjects ZM214M, ZM215F, ZM247F, and ZM229M) and those with maximum within-patientenv diver-sities of less than 0.7% (the remaining eight subjects). We have previously estimated that the maximum within-patient diversity that can plausibly develop from a single infecting virus within 100 days is 0.60% (95% CI; range, 0.54 to 0.68%) and the maximum within 150 days is 0.72% (95% CI; range, 0.65 to 0.85%) (B. F. Keele, unpublished data). Thus, the latter eight subjects appeared to have been infected with a single viral variant. To examine this further, we inspected the viral phy-logenies more closely. As shown in Fig. 2, sequences from the two subjects analyzed during the earliest stages of infection (ZM246F and ZM249M) each formed single virus lineages with very short branch lengths. The sequences from six other subjects (ZM178F, ZM180M, ZM184F, ZM206F, ZM231F, and ZM235F) also comprised discrete lineages, but with slightly longer branches consistent with a longer duration of infection, as indicated by their Fiebig stages (V and VI). The other four individuals, including subject ZM247F, whose sam-ple was obtained within 30 days of infection (Fig. 1B), exhib-ited much greater diversities and had thus acquired more than one virus strain.
To estimate the rate ofenvevolution in the critical period spanning seroconversion, we examined sequences from one individual (ZM246F) who had been infected by a single virus (Fig. 2, Table 3) and from whom sequential blood samples were obtained 80 days apart, during Fiebig stages II and VI (Fig. 1B). First, a tree was constructed using the 27 sequences from the earliest time point and was midpoint rooted. Second, a tree was constructed using 41 sequences from both time
points and rooted to match the first tree, assuming a molecular clock. The distance from the tip of each branch to the root of the tree was calculated by using Branchlength (http://www.hiv .lanl.gov/content/sequence/BRANCHLENGTH/branchlength .html) and plotted against the time in days (0 days for sequences from the 14 January 2003 time point and 80 days for sequences from the 4 April 2003 time point). This yielded a rate of evolution of 1.7⫻10⫺5substitutions per site per day
(6⫻10⫺3substitutions per site per year), which is very close to
a rate previously obtained for HIV-1envgene sequences (16) and similar to the mutation rate of HIV-1 in cell culture (2.4⫻ 10⫺5 mutations per site per replication cycle, excluding
[image:8.585.45.544.81.259.2]insertions and deletions), assuming a replication time between 1 and 2 days (23). To estimate the time to the most-recent common ancestor (MRCA) for sequences from all 12 primary infection subjects, this rate was applied to the average branch length of their respectiveenvsequences to the root of the tree. For subjects ZM247F and ZM246F, from whom samples were obtained very early (Fig. 1B), estimates of the time to the MRCA of their transmitted viruses ranged between 10 and 31 days (Table 3), well within the upper bounds of the Fiebig eclipse phase and stages I and II (note that this is true for each of the two variants acquired by subject ZM247F). For subject ZM249M, the same estimate was 31 days, which corresponds to the approximate beginning date for Fiebig stage IV (Fig. 1B). For the other six subjects with homogeneous virus populations, from whom samples were obtained no later than 99 to 151 days postinfection according to clinical and serological data, the env diversities implied a time to the MRCA ranging from 43 to 73 days for stage V subjects and 73 to 112 days for stage VI subjects, again within the bounds of the corresponding Fiebig stages. These findings supported the conclusion that subjects ZM178F, ZM180M, ZM184F, ZM206F, ZM231F, and ZM235F, like subjects ZM246F and ZM249M, each had been infected by a single virus. Conversely, subjects ZM214M, ZM215F, and ZM229M all had env
TABLE 3. Diversity of SGA-direct sequence-derived completeenvgenes in subjects with primary HIV-1 infections
Subject Fiebig stage
Date sample collected (mo/day/yr)
No. of SGAenv amplicons
Nucleotide sequence
length
Nucleotide sequence diversity
Amino acid
sequence diversity MRCATime toa
(days)
Viral complexity
No. of variants transmitted Mean Range Mean Range
ZM184F V 07/10/03 26 2604–2621 0.13 0.00–0.31 0.33 0.00–0.80 43 Homogeneous 1
ZM214M VI 07/02/03 35 2544–2568 0.45 0.00–1.10 0.93 0.00–2.00 231 Heterogeneousb ⬎1
ZM215F VI 10/19/02 32 2502–2580 4.26 0.00–7.38 7.32 0.00–13.4 1,869 Heterogeneous ⱖ4
ZM246F II 01/14/03 27 2532 0.05 0.00–0.20 0.10 0.00–0.36 26 Homogeneous 1
VI 04/04/03 14 2531–2532 0.31 0.16–0.40 0.58 0.24–0.95 107
ZM247F II 10/28/03 25 2583–2595 1.12 0.00–2.74 1.78 0.00–4.40 788c Heterogeneous 2
III 11/01/03 19 2592–2595 0.56 0.00–2.70 0.90 0.00–4.29 774
ZM249M IV 08/05/03 24 2562–2563 0.07 0.00–0.27 0.16 0.00–0.82 31 Homogeneous 1
V 08/12/03 25 2562 0.05 0.00–0.16 0.14 0.00–0.47 16
ZM178F VI 01/18/03 26 2560–2613 0.41 0.00–0.67 0.99 0.00–1.85 112 Homogeneous 1
ZM180M V 07/20/02 24 2588–2560 0.23 0.04–0.39 0.47 0.00–1.06 71 Homogeneous 1
ZM206F VI 07/13/02 35 2538–2560 0.25 0.04–0.47 0.61 0.00–1.29 73 Homogeneous 1 ZM229M VI 10/19/02 29 2526–2592 2.28 0.04–5.82 4.08 0.00–10.3 1,502 Heterogeneous ⱖ4
ZM231F V 12/17/02 48 2513–2545 0.13 0.00–0.43 0.32 0.00–1.30 73 Homogeneous 1
ZM235F V 12/20/02 28 2244–2565 0.16 0.00–0.39 0.34 0.00–0.82 54 Homogeneous 1
aThe time to the MRCA was estimated by using the average branch length to root of midpoint-rooted neighbor-joining trees (inferred after excluding gaps and with
Kimura’s two-parameter correction) assuming a rate of 1.7⫻10⫺5substitutions per site per day (estimated from the extent ofenvsequence divergence in subject
ZM246F).
bThe number of transmitted variants could not be determined.
cThe time to the MRCA for sequences within each of the two discrete transmitted virus lineages in subject ZM247F was estimated to be between 10 and 31 days.
on November 8, 2019 by guest
http://jvi.asm.org/
on November 8, 2019 by guest
http://jvi.asm.org/
sequences whose diversities led to time estimates for an MRCA virus that far exceeded plausible durations for a single virus source given their Fiebig stage, and this was also true for the two variants identified in subject ZM247F (Table 3). These subjects had therefore clearly been infected by two or more viral variants. Detailed recombination analysis of the viruses from subjects ZM229M and ZM215F indicated at least four different transmitted variants (see below), while the number of transmitted variants for subject ZM214M could not be determined with certainty (Table 3).
Identification of transmitted or early “founder” viruses.The
estimates of time to the MRCA for all subjects with homoge-neous infections suggested that viral sequences were coalescing at or near the transmission event. To evaluate this further, we se-lected for analysis three subjects (ZM249M, ZM247F, and ZM246F) from whom we had very early samples. Figure 3 depicts
[image:10.585.51.548.79.430.2]the phylogenetic trees of the SGA-derivedenvsequences from two consecutive plasma samples obtained from each of these subjects 4 to 80 days apart. The sequences were also exam-ined by using a novel analytical tool, Highlighter (http://www .hiv.lanl.gov/content/sequence/HIGHLIGHT/highlighter.html), which provides a visually informative representation compar-ing eachenv sequence to a selected reference sequence. For subject ZM249M, both the phylogenetic tree and Highlighter analysis identified a single set of 48 identical or nearly identical sequences that differed from the consensus by 4 or fewer nu-cleotide substitutions, while any 1 sequence differed from an-other by a maximum of 8 nucleotides (0.3% maximum diver-sity) (Fig. 3A). For subject ZM247F, both the phylogenetic tree and Highlighter analysis identified two distinct sets of identical or nearly identicalenv sequences. Although the se-quences in one lineage differed from those in the other lineage
FIG. 3. Identification of transmitted or early founderenvgenes in subjects with acute HIV-1 infection. SGA-derivedenvsequences from pre-and postseroconversion plasma samples from subjects ZM249M (A), ZM247F (B), pre-and ZM246F (C) were examined by phylogenetic tree construction (left panels) and Highlighter analysis (right panels). Sequences from the earlier time points are in bold face. Trees are midpoint rooted. The scale bars represent 1 (A and C) or 10 (B) nt substitutions per site. The corresponding Highlighter diagrams denote the locations of nucleotide sequence substitutions in eachenvsequence in comparison to a reference sequence listed at the top; the positions of these substitutions within theenvsequence are indicated at the bottom. Nucleotide substitutions and gaps are color coded. For each subject, sets of identical and nearly identicalenvsequences form consensus sequences that coalesce to transmitted or early founder viralenvsequences. Subjects ZM249M and ZM246F were infected by a single virus and ZM247F by two viruses, identified as variant 1 and variant 2 in the tree (panel B). The tick in parentheses in sequence 080503_A5 (panel A) indicates a single-nucleotide insertion. The boxed region in panel C indicates clustered mutations in V3. Interestingly, these changes were limited to position 8 (Ile to Thr, Arg, or Lys) and position 25 (Asp to Asn, Glu, or Gly).
on November 8, 2019 by guest
http://jvi.asm.org/
by as many as 66 nucleotides (2.7% maximum diversity), the sequences from within a lineage differed by no more than 4 nucleotides from each other and by no more than 2 nucleotides from the lineage consensus (⬍0.2% maximum diversity) (Fig. 3B). Finally, for subject ZM246F, a set of 26 identical or nearly identical sequences that differed from the consensus by 3 or fewer nucleotides and from each other by a maximum of 5 nucleotides (⬍0.2% maximum diversity) was identified for the first time point (Fig. 3C). Fourteenenvsequences obtained 80 days later were still closely related to the original consensus sequence, although none was identical to an earlier sequence. Nonetheless, their consensus was still identical to the consen-sus of the earlier time point. Mathematical models of virus replication and diversification that assume exponential growth in the absence of immune selection predict a high proportion of identical sequences in acute and very early infections (B. F. Keele, unpublished data). For subject ZM247F, lineages 1 and 2, and subjects ZM246F and ZM249M, the proportions of identical sequences in the earliest samples were 5/7 (71%), 11/18 (61%), 16/27 (59%), and 11/24 (45%), consistent with the model expec-tations. Thus, we conclude that these consensus sequences corre-spond to the transmitted or early “founder” viruses that initiated productive clinical infection in these subjects.
envgene evolution postseroconversion. Although it is
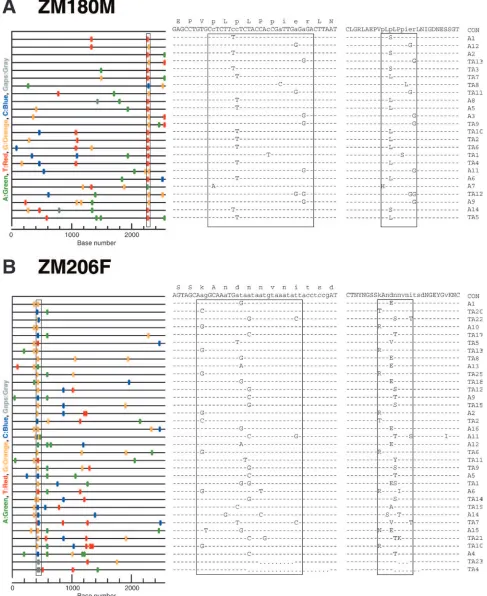
pref-erable to collect sequential plasma samples before and after seroconversion for the analysis of env evolution, this is not always feasible, especially in large-scale natural history studies or vaccine trials. We thus sought to determine what inferences could be drawn concerning the transmitted virus and its early evolution from the analysis of SGA-derived sequences from later time points, without the benefit of earlier samples. Figure 4 illustrates two examples. Samples were obtained from subject ZM180M during Fiebig stage V, no more than 124 days after infection, and from subject ZM206F during Fiebig stage VI, no more than 151 days after infection. Based on the extent of maximum envdiversity in these subjects (0.39% and 0.47%, respectively) and on their env phylogenetic trees, we deter-mined that each had likely been productively infected by a single virus. Inspection of the Highlighter plot of sequences from subject ZM180M provided evidence of strong selection in theenvregion that overlaps the second exon ofrev(Fig. 4A, left panel). When compared to the consensus sequence, each of 24env/revsequences contained a mutation within a region spanning 24 nucleotides; one of the sequences contained two mutations (Fig. 4A, middle panel). These 25 differences from the consensus comprised seven different mutations, each present in one to eight different sequences. All of these muta-tions were nonsynonymous in therevreading frame, yielding seven different amino acid replacements within a single Rev 9-mer (Fig. 4A, right panel). We note that 9 amino acids is the length of a typical T-cell epitope. Given that there were only eight different mutations within therevexon, we estimated the probability that seven would fall within a single 9-mer as less than 10⫺6. There was equally strong evidence of selection in
the sample from subject ZM206F, where each of 35env se-quences contained at least one mutation or a deletion within a span of 9 codons (Fig. 4B, left panel). The 41 nucleotide changes comprised 16 different mutations (Fig. 4B, middle panel), all of which were nonsynonymous with respect to the consensus sequence (Fig. 4B, right panel). Given that there
were 54 different nonsynonymous mutations within the env gene, we estimated the probability that 16 would fall within a single 9-mer as less than 10⫺12(these probability calculations
are conservative in that they assume that each of the observed mutations arose only once and that the multiple occurrences of some of the mutations reflect common ancestry).
Contribution of viral recombination to env gene diversity.
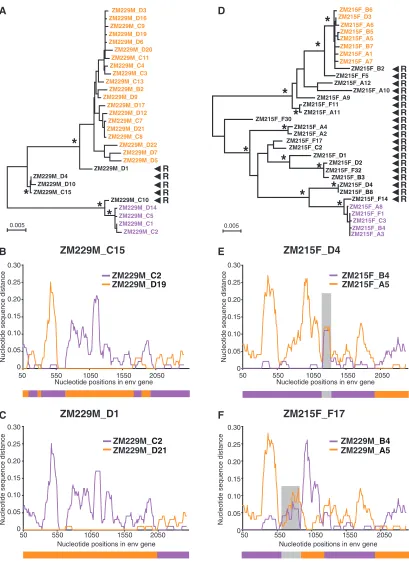
Recombination can accelerate virus evolution and adaptation by reassortment of large sequence fragments (13, 33, 53). Sub-jects ZM229M and ZM215F exhibited the greatest within-patientenvdiversity, and we examined sequences from each for evidence of recombination by using the SGA-direct se-quencing approach. Both subjects had evidence of infection by two or more viruses, based on theirenvdiversity and estimates of timing to the MRCA (Table 2). Sequences from both sub-jects also contained numerous recombinants comprised of two or more transmitted lineages. The majority of these recombi-nants were likely generated in the newly infected individuals and not in the transmitting partner, since most of the mosaic sequences were unique and very closely related to only two transmitted parental strains. For example, sequence C15 from subject ZM229M contained seven putative recombination crossover sites, but all fragments between these crossover points were identical (or nearly identical) to those of one of the two transmitted variants, C2 or D19 (Fig. 5B). Sequences D1 (Fig. 5C) and C10 (not shown) exhibited a similar pattern, although they contained fewer crossover sites. Sequences D4 and D10 were very closely related to C15 (Fig. 5A) and shared identical recombination breakpoints; this is most readily ex-plained by assuming recombination in the newly infected sub-ject followed by a clonal expansion of the mosaic virus. For subject ZM215F, there was an even greater number of recom-binants which were derived from the two major transmitted variants (Fig. 5D). However, three mosaic sequences (D4, B8, and F17) were of particular interest since they contained short regions that were equally distant from the two principal lin-eages, suggesting that these viruses had recombined with ad-ditional viruses not represented in the phylogenetic tree (two examples are shown in Fig. 5E and F). Based on these and additional phylogenetic analyses (not shown), we estimated that subjects ZM229M and ZM215F each had acquired at least four different variants which had undergone extensive recom-bination. Thus, recombination accelerates sequence diversifi-cation in newly infected individuals.
Comparison of SGA and bulk amplification methods for
analyzing HIV-1 diversity. Because previous studies of viral
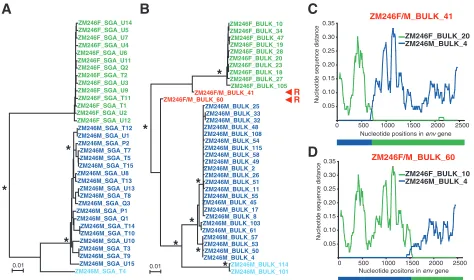
diversity in acute HIV-1 infection have generally utilized non-SGA methods, we sought to compare the two strategies side-by-side on the same clinical samples. Specifically, we asked whether SGA and bulk PCR methods were equivalent in pro-viding an accurate representation of virus identity and di-versity. The results showed that this was not the case: bulk amplification was prone to introducing a variety of method-ological artifacts. Figure 6 depicts the phylogenies of 19 SGA-derived (Fig. 6A) and 34 bulk-amplifiedenv sequences (Fig. 6B), both obtained from the sample obtained on 1 November 2003 from subject ZM247F. What is immediately apparent is that the terminal branches of the bulk-amplifiedenvsequences are consistently longer than those of SGA-derived sequences. This is most obvious for the more abundant of the two
on November 8, 2019 by guest
http://jvi.asm.org/
FIG. 4. Evidence of immune selection in two subjects sampled at later Fiebig stages. (A) Highlighter analysis of SGA-derivedenvsequences (left panel) from subject ZM180M (Fiebig stage VI), and corresponding nucleotide (middle panel) and amino acid (right panel) sequence alignments from the overlappingrevgene. Boxes indicate mutations that cluster within a 27-nt region that corresponds to a 9-mer in the Rev protein sequence. (B) Highlighter analysis of SGA-derivedenvsequences (left panel) from subject ZM206F (Fiebig stage VI), and corresponding nucleotide (middle panel) and amino acid (right panel) sequence alignments of the V1 region. Boxes indicate mutations that cluster within a 27-nt region that corresponds to a 9-mer of the V1 loop. In Highlighter analyses, nucleotide substitutions and gaps are color coded. The consensus sequence is at the top of each alignment; lowercase letters show residues where mutations occurred. Dashes in the alignments indicate sequence identity to the consensus; dots indicate deletions.
3963
on November 8, 2019 by guest
http://jvi.asm.org/
FIG. 5. In vivo recombination in multiply-infected subjects. (A) Neighbor-joining tree of SGA-derivedenvsequences from subject ZM229M depicting two major transmitted variants (orange and purple), as well as five in vivo-generated recombinants (black). Asterisks at nodes indicate 90% or higher bootstrap values. The scale bars represent 0.005 nucleotide substitutions per site. (B-C) Diversity plots of two representative recombinants identified in panel A. The sequence distances of ZM229M_C15 (panel B) and ZM229M_D1 (panel C) are compared to those of representatives of the two parental lineages (orange and purple, respectively). The two recombinants contain between one and seven crossovers; schematic representations of their putative mosaic structures are shown below. (D) Neighbor-joining tree of SGA-derivedenvsequences from subject ZM215F depicting two major transmitted variants (orange and purple), as well as 19 different recombinants (black). Asterisks and scale bar are as described for panel A. (E-F) Diversity plots of two ZM215F recombinants containing “extraneous” sequences. The sequence distances of ZM215F_D4 (panel B) and ZM215F_F17 (panel C) are compared to those of representatives of the two parental lineages (orange and purple, respectively). Shaded areas indicate regions where ZM215F_D4 and ZM215F_F17 are equidistant from the two parental lineages, suggesting recombination with additional variants. Schematic representations of their putative mosaic structures are shown below.
on November 8, 2019 by guest
http://jvi.asm.org/
mitted variants: in comparing 17 SGA-derived and 25 bulk-derived env sequences to their corresponding consensus se-quence, we found average distances of 0.028% (0.73 substitutions) and 0.094% (2.4 substitutions) for SGA- and bulk PCR-derived sequences, respectively. This difference is highly significant (ttest;P⬍0.0001) and can be attributed to Taq-induced misincorporations; such Taq-induced errors are evident in sequences of individualenvclones derived from bulk PCR, but not in sequences of uncloned SGA amplicons since they represent only a very minor population. Similar results were obtained for the sample from a second subject (ZM249M) when 25 SGA-derived and 12 bulk-derived sequences were com-pared to their corresponding consensus env sequence (not shown). The average distance of the SGA sequences was 0.027% (0.7 substitutions), compared to 0.073% (1.9 substitutions) for the bulk sequences. Again, these differences were statistically signif-icant (P⬍0.002) and attributable toTaq-induced errors.
Bulk amplification also generated a surprisingly large num-ber of recombinants compared to the SGA approach, where none were evident. This is exemplified in Fig. 6B, showing the results of bulk amplification of plasma from subject ZM247F that yielded 8 recombinants out of 34 sequences (Fig. 6C and D), as opposed to no recombinants out of 19 sequences derived by SGA from the same sample. To insure that we had suffi-ciently sampled the plasma virus pool by SGA, we obtained 25 additional SGA sequences from a second plasma sample
col-lected 4 days earlier. Again, no mosaic sequences were found (Fig. 3B). Power calculations indicated that with a sample size of 44 sequences, we could be 95% confident that any missed variant (including a recombinant) comprised less than 7% of the virus population. These data suggest that bulk PCR facil-itates template switches by the Taq polymerase, generating recombinants in vitro that do not exist in vivo.
Comparison of SGA and bulk amplification methods for
detection of specimen cross contamination. Quality control
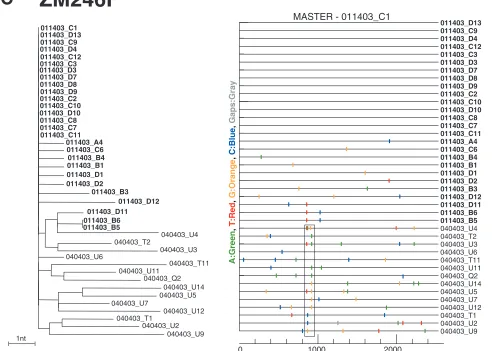
[image:14.585.47.542.72.351.2]and assurance are always a concern in large-scale clinical trials, since specimens can be misidentified, cross-contaminated, or otherwise compromised. In the course of the present study, we obtained one plasma sample from subject ZM246F in which phylogenetic analyses suggested specimen cross contamina-tion. This questionable sample revealed three SGA-derived envlineages (Fig. 7A), in contrast to the presence of a single viral lineage in this individual’s plasma 3 months earlier (Fig. 3C). We considered the possibility that subject ZM246F had become super-infected in the intervening 80 days, but the ex-tent of sequence diversity within the blue lineages made this explanation extremely unlikely. When bulk PCR was per-formed on the questionable specimen (Fig. 7B), we obtained an even more complicated phylogenetic tree, this time reveal-ing three lineages plus two additional recombinant viruses (ZM246F/M_BULK_41 and ZM246F/M_BULK_60). We re-solved this quandary by reviewing clinic records and subjecting
FIG. 6. Bulk PCR-induced in vitro recombination in a multiply-infected individual. (A) Neighbor-joining tree of SGA-derivedenvsequences derived from subject ZM247F (sample obtained 1 November 2003) depicting two major transmitted variants (green and blue; sequences of the more-abundant variant are in green) and no recombinants. (B) Neighbor-joining tree of bulk PCR-derivedenvsequences amplified from the same specimen depicting two transmitted variants (green and blue; sequences of the more-abundant variant are in green) and eight recombinants (red). Asterisks at nodes indicate 90% or higher bootstrap values. The scale bars show 0.002 substitutions per site. (C and D) Diversity plots of two representative recombinants in panel B. The two recombinants contain one or more crossovers, the approximate positions of which are indicated by nucleotide position (xaxis) and shown schematically below the panels.
on November 8, 2019 by guest
http://jvi.asm.org/
the questionable plasma sample to DNA microsatellite analy-sis. The comparison of 15 polymorphic loci and one gender marker revealed three rather than two alleles in the question-able sample, but not in samples from three control subjects with heterogeneous HIV-1 infections (Table 4). This finding indicated that genetic material from two different individuals had been mixed in the questionable ZM246F sample. Analysis of peripheral blood mononuclear cell DNA from the partner (ZM246M) of subject ZM246F provided an explanation: the contaminating alleles in the questionable specimen were his (Table 4). Thus, during the processing of the couple’s blood on the 4 April 2003 clinic visit, the two plasma samples were inadvertently mixed. This inadvertent sample contamination was informative in that the two recombinant viruses whose diversity plots are shown in Fig. 7C and D could only have been generated in vitro as an artifact of Taq-induced template switching, since the two viral lineages from which they were derived never coexisted in the same individual. Moreover, a substantial number of the bulk-derived (17 out of 25), but not SGA-derived, sequences of ZM246M were identical or nearly identical, most likely because of target resampling and/or dif-ferences in cloning efficiency among different env sequences (20).
DISCUSSION
[image:15.585.56.530.67.347.2]The primary objective of this study was to develop, validate, and implement a new experimental strategy for analyzing com-plete HIV-1 env genes and, eventually, complete HIV-1 ge-nomes from plasma RNA in a manner that would accurately reflect their identity and composition in vivo. To this end, we adapted methods previously described by other investigators (27, 43–45) and tested them using in vitro-synthesized HIV-1 RNA transcripts of known sequence identity and plasma spec-imens from subjects with acute and early infections. Using an equal mixture of T7-synthesized RNA transcripts from two related but distinct HIV-1envclones (BORId9.4F12 and 4F8), we carried out SGA-direct sequencing to estimate the rates of nucleotide misincorporation and recombination from this method. We observed 3.4 assay-related errors per 10,000 nu-cleotides, indicating a misincorporation rate of 0.034%. In addition, we observed a 0.01% rate of elongation errors within runs of the same nucleotide. We attribute these rates to a combination of T7 polymerase and Superscript III reverse transcriptase errors and note that Palmer and coworkers re-ported very similar values (0.011% nucleotide substitution er-rors and 0.022% elongation erer-rors) for T7 RNA transcripts of
FIG. 7. Bulk PCR-induced in vitro recombination in a mixture of two plasma samples. (A) Neighbor-joining tree of SGA-derivedenvsequences derived from a mixture of plasma from two infected subjects, ZM246F (green) and ZM246M (blue). Subject ZM246M was chronically infected with at least two major viral lineages (dark and light blue) that differed in theirenvsequences by approximately 6%. ZM246F was acutely infected with a virus from an unrelated individual which differed from the ZM246Menvsequences by approximately 10%. (B) Neighbor-joining tree of bulk PCR-amplifiedenvsequences from the same mixed-plasma specimen. In addition to viral lineages representing ZM246F (green) and ZM246M (blue), two additional recombinants (ZM246F/M_BULK_41 and ZM246F/M_BULK_60) are apparent (red). Asterisks at nodes indicate 90% or higher bootstrap values. The scale bars show 0.01 nucleotide substitutions per site. (C and D) Diversity plots of the two recombinants in panel B. The approximate position of recombination crossovers is indicated by nucleotide position (xaxis) and schematically shown below the panels.
on November 8, 2019 by guest
http://jvi.asm.org/
HIV-1pro-polgenes (27). We also performed SGA analysis on an equal mixture of vRNA from two transfection-derived HIV-1 strains, YU2 and SG3. Here, human RNA Pol II, and not T7 polymerase, catalyzes the RNA synthesis step. In this case, we observed a nucleotide misincorporation rate of 0.0068%, or 0.68 assay-related errors per 10,000 amplified nu-cleotides. In addition, we observed a 0.0015% rate of elonga-tion errors within runs of A or T residues. We attribute these to a combination of human Pol II and Superscript III reverse transcriptase errors and note that Mansky and Temin reported a similar value of 0.0034% for the overall HIV-1 reverse tran-scriptase-plus-human Pol II error rate on alacZtemplate (23). Thus, the total error rate of the SGA-direct sequencing method as described here for the analysis of HIV-1 env se-quences is no more than 8⫻10⫺5, due mostly to Superscript
III errors. This is not a negligible error rate even whenTaq polymerase errors are avoided altogether (by direct sequencing of uncloned amplicons), since it can lead to single-nucleotide misincorporations in as many as 1 in 5envsequences. None-theless, we suspect that 8 ⫻ 10⫺5 is an upper limit for the
Superscript III error rate in our analyses, since in some pa-tients with very early infection (Fiebig stages I and II), we found as many as 48 of 52 (92%) plasma virionenvsequences to be identical, with the remaining four varying by only five nucleotides altogether; this yields an inferred rate of Super-script III error of⬍4⫻10⫺5 (G. M. Shaw and B. H. Hahn,
unpublished data). For certain applications, such as identifying transmitted or early founder sequences, infrequent nucleotide misincorporations are of no consequence since many indepen-dently generated sequences are analyzed together and all co-alesce to a single consensus. However, if SGA-derived env genes from chronically infected subjects, in whom most circu-lating viruses are unique (27), are analyzed, then
single-base-pair misincorporations due to Superscript III error can be a confounding variable. Finally, we examined whether cDNA synthesis using Superscript III generated recombinant viral sequences in vitro. Among 109 completeenvsequences, cor-responding to 278,000 nucleotides, we observed no recombi-nants. We also observed no instances of intragenic recombina-tion or of inserrecombina-tion, delerecombina-tion, or duplicarecombina-tion. Our findings are thus in agreement with those of Palmer and coworkers, who also found no evidence of Superscript III-mediated recombi-nation, insertion, deletion, or duplication in any of 50 genomes (66,000 nucleotides) analyzed (27). Although we did not for-mally evaluate the substitution rates and template-switching frequencies forTaqpolymerase when using the bulk amplifi-cation method, we frequently encountered Taq-induced re-combinants and/or misincorporations in bulk-amplified se-quences (Fig. 6 and 7). Moreover, in a separate study where we obtained functionalenvclones from SGA-derived amplicons (B. F. Keele, unpublished data), we identified (and discarded) numerous clones that containedTaq-induced errors and thus did not correspond to the env consensus sequences. These clones were excluded from subsequent biological analyses since they did not represent viruses present in the patient but rather in vitro artifacts. We thus conclude that only SGA-based strategies can unequivocally identify genetically linked muta-tions and that assay-related nucleotide misincorporamuta-tions and recombination frequencies are much lower for SGA ap-proaches than with other strategies.
[image:16.585.45.540.81.274.2]A second objective of this study was to evaluate in a field trial setting the ability of SGA-direct sequencing strategies to decipher transmitted clade C (or other non-clade B) viruses and their early evolution in a time frame typical of vaccine trial follow-up schedules (every 3 months). In a companion study of acute and early subtype B infections (B. F. Keele, unpublished
TABLE 4. Microsatellite analysis of plasma samples with heterogeneous viral sequencesa
Locus
Allele(s) identified in sample obtained (mo/day/yr) from indicated subject
ZM229M ZM215F ZM247F ZM246F ZM246Mc
04/04/03 07/17/02 10/19/02 07/04/02 10/19/02 10/28/03 11/01/03 01/14/03 04/04/03b
D8S1179 14, 16 14, 16 13, 15 13, 15 15, 17 15, 17 14 14 14
D211S11 30.2, 31.2 30.2, 31.2 28, 36 28, 36 28.2, 27 28.2, 27 28, 31 27, 28, 31 27, 28
D7S820 11, 12 11, 12 8, 10 8, 10 10, 11 10, 11 10, 13 10, 12, 13 12
CSF1PO 7, 12 7, 12 10, 11 10, 11 10, 12 10, 12 7, 10 7, 10, 12 12
D3S1358 15, 17 15, 17 17 17 16, 17 16, 17 15 15, 16, 17 16, 17
TH01 6, 8 6, 8 7, 8 7, 8 7, 9.3 7, 9.3 7, 8 7, 8, 9 8, 9
D13S317 12, 13 12, 13 10,12 10, 12 12, 13 12, 13 11, 12 11, 12, 14 11, 14
D16S539 12, 13 12, 13 9, 12 9, 12 10 10 11 10, 11, 12 10, 12
D2S1338 22, 23 22, 23 21, 22 21, 22 20 20 19, 22 19, 22, 23 19, 23
D19S433 12, 14 12, 14 11, 13 11, 13 14, 16.2 14, 16.2 13, 14 13, 14, 15 13, 15
vWA 13, 20 13, 20 16, 17 16, 17 18 18 15 15 15
TPOX 9, 11 9, 11 10, 11 10, 11 9, 11 9, 11 7, 11 7, 8, 11 8, 11
D18S51 14.2, 16 14.2, 16 16, 18 16, 18 17, 20 17, 20 17, 18 16, 17, 18 16
D5S818 12 12 13 13 12, 14 12, 14 12, 13 11, 12, 13 11, 12
FGA 20, 22 20, 22 21, 26 21, 26 24, 28 24, 28 22, 23 22, 23 22, 23
Amelogenin Y Y X X X X X X, Y Y
aMicrosatellite analyses were performed using DNA extracted from plasma samples, except for subject ZM246M for whom only peripheral blood mononuclear cell
DNA was available. Loci were amplified using an AmpFlSTR Identifiler kit (Applied Biosystems, Foster City, CA). This PCR amplification kit is a short tandem repeat multiplex assay that amplifies 15 tetranucleotide repeat loci and the amelogenin gender-determining marker in a single PCR amplification; all identifiable alleles per locus are shown.
bThis sample was identified as an inadvertent mixture of plasma from two different individuals (ZM246F and ZM246M).
cSubject ZM246M is the chronically infected partner of subject ZM246F but not the individual who transmitted virus to subject ZM246F (see Fig. 7 and associated
text for explanation).
on November 8, 2019 by guest
http://jvi.asm.org/
data), we studied 51 subjects in Fiebig stages I/II and 26 sub-jects in Fiebig stages III/IV; with such early sampling we found that we could infer transmitted or early founderenvsequences in most patients, including tho