Observing Galaxy Formation During the First 2
Billion Years
Thesis by
Daniel P. Stark
In Partial Fulfillment of the Requirements
for the Degree of
Doctor of Philosophy
California Institute of Technology
Pasadena, California
2009
ii
c
2009
Daniel P. Stark
iii
This thesis has benefited from the help of many. First and foremost, I must thank
my Ph.D advisor, Richard Ellis. It has been a true pleasure to work with Richard
over the past five years. His enthusiasm for astronomy, tireless work ethic, unique
vision and ability to grasp the big picture are second to none. I really couldn’t have
envisioned a better supervisor.
I am very grateful for the guidance and mentoring that I received as an
under-graduate at the University of Wisconsin. In particular, I would like to thank Ed
Churchwell for taking me in while still a young high school student and guiding me
over the years. I also must thank Barb Whitney for teaching me many of the
funda-mentals of astrophysics research and putting up with the longest ApJ resubmission
process ever. I am grateful to Joe Cassinelli for his enthusiastic and insightful
ap-proach to teaching. I still find my notes from his courses very useful! In 2001, I had
the good fortune to spend a very productive summer working with Debra Shepherd
at the VLA. I thank Debra for a wonderful research experience and for opening doors
for me at Caltech. I also thank Miller Goss for supporting my research endeavors as
a young undergraduate and inviting me back to Socorro numerous times to finish off
our project. All of these individuals were always willing to listen to my questions,
whether they be about science or picking grad schools, and I am very grateful for all
the advice I have received from them over the years.
Caltech has provided a nourishing scientific environment during my Ph.D, and I
am thankful to a large number of people that have passed through Caltech during
my time there. In my first few years, I was fortunate to interact with a number
of postdocs and elder graduate students. In particular, I thank Graham Smith for
bringing me into the Ellis group and mentoring me early on. I was fortunate to
overlap briefly with Jean-Paul Kneib at Caltech, and I am very appreciative of his
help over the years. I am particularly grateful to Dave, Josh, Melissa, and Kevin
for always being willing to discuss science and/or provide a fun social outlet during
my early years. Perhaps one of the greatest benefits of working with Richard Ellis
is the scientific interaction with others in the research group. I gained a great deal
iv
grateful for all his help! Over the years, I’ve also been fortunate to interact with Mike
Santos, Sean Moran, Chris Conselice, Tom Targett, and James Taylor, each of whom
have helped me during my Ph.D. I must also thank George Becker for providing his
superb NIRSPEC reduction software. Finally, I’d like to thank Adam, Brian, Larry,
and Stuartt for providing great lunchtime diversions over the last several years.
I have also gained a tremendous amount from a number of colleagues outside of
Caltech. I learned a great deal from my collaboration with Avi Loeb and am very
grateful for his continued support of my research. I thank Mark Swinbank for all his
help and expertise dealing with the IFU data which was instrumental in Chapter 6
of this thesis. Tommaso Treu has always been willing to listen to science ideas and
career questions which I am very grateful for. I thank Andy Bunker for inviting me
to the UK a number of times to work on high redshift galaxies. These trips were
instrumental in the papers that are presented in Chapter 2 and 5 of this thesis.
Most of this thesis would not have been possible if it wasn’t for the hard work of
people at Keck. In particular, I thank Jim Lyke and Grant Hill for all their efforts
in keeping NIRSPEC up and running during my first few years at Caltech. Also,
Chapter 6 could not have been completed without a properly functioning laser guide
star system at Keck, and I thus thank everyone who contributed to getting the system
up and running.
I am grealy indebted to Judy McLain for all her hard work during my 5 years at
Caltech. I still don’t know how Judy does everything she does! It’s been a pleasure
stopping by her office these past 5 years.
Finally and most importantly, I must thank Marija and my family for all their
neverending support and inspiration over the years. I never could have made it
v
Abstract
The universe evolves dramatically in its first two billion years. From the formation
of the first stars and protogalaxies, to the reionization of hydrogen and the assembly
of massive 1011 M
⊙ galaxies, this era contains some of the most important events in
cosmic history. Current observations of this era are limited causing many of these
processes to remain unconstrained. This thesis is comprised of five projects, each of
which focuses on advancing the observational study of galaxies in this early era.
First, we develop an indirect method of estimating the star formation activity
at z >∼ 6. Motivated by the discovery of galaxies with evolved stellar populations at z >∼ 6 (Egami et al. 2004, Eyles et al. 2005), we propose that the stellar mass density at z ≃5−6 can be used to robustly constrain the integrated star formation density at yet earlier times. Given the difficulties in reliably confirming galaxies at
z >∼6, we argue that this method may represent one of the most promising means of characterizing the contribution of star forming galaxies to reionization. We compute
the stellar masses of a large sample ofz ≃5 rest-UV selected galaxies in the GOODS-South field and derive an estimate of thez ≃5 stellar mass density. In spite of the fact that this measurement is surely incomplete (only UV luminous galaxies are included),
the resulting mass density is very large, requiring significant star formation at higher
redshifts. In spite of this indication of earlier activity, no sources have yet been
identified with robust spectroscopic confirmation at z >∼7.
Comprehensive searches for galaxies at z >∼7 are thus key to progress. Starting in 2004, we began work on a Keck/NIRSPEC survey for gravitationally lensed
vi
star-forming sources at very early times. If these sources are at z > 8, it would indicate that low luminosity galaxies dominate the UV photon budget necessary for
reionization, explaining the shortfall found in previous studies of luminous sources
(Bunker et al., 2004; Oesch et al., 2008). Follow-up imaging and spectroscopy lends
support to the high redshift case, but further work is still required before these objects
can be claimed as z ≃ 10 sources. We discuss several ongoing efforts to confirm the nature of these candidates.
Noting the rapid observational progress identifying the first candidate galaxies at
z >∼7 and hundreds of galaxies at z ≃ 5−6, we set out to put these observations in the context of a simple analytic star formation model, taking into consideration
the evolution in the underlying dark matter halos. We find that the abundance of
luminous Lyman break galaxies in the 500 Myr betweenz ≃6 and 10 can be naturally explained by the hierarchical assembly of dark matter halos. In contrast, the first
estimates of the abundance of less luminous star-forming galaxies at z ≃ 9 −10 are higher than predicted by the simple model and, if verified by further data, may
suggest some evolution in the efficiency of star formation or the initial mass function.
We also use the simple model to assess the efficiency of future surveys at z >∼ 7 and conclude that with the development of new instrumentation, dedicated programs
should soon allow considerably larger samples (≃100) of z ≃7−8 LBGs and LAEs to be detected.
As observations probe closer to the epoch when the first galactic systems emerge,
it is thought that star-forming galaxies will begin to appear younger and less massive
then their lower-redshift counterparts. While the first glimpse of the stellar
popula-tions of high-zhas been obtained in recent years (Egami et al. 2004, Eyles et al. 2005) lacking has been a systematic analysis of the evolving stellar masses and ages of a large
sample of LBGs uniformly selected in different redshift bins atz >∼3. We present the results of the first such analysis, compiling the stellar populations of a large sample
(>∼4500 galaxies) of photometrically selected LBGs spanning z ≃ 3.5−6.5. While we find considerable variation in the stellar mass as a function of rest-UV luminosity,
vii
massive than those at z ≃ 4. The results are consistent with a picture in which freshly luminous systems are continually emerging over time, consistent with the
ob-served growth in the UV luminosity function (Bouwens et al., 2007). These results
also reveal a marked increase in the number density of actively-forming massive 1011
M⊙ galaxies over 4 < z∼ <∼6. Extrapolating this growth to later times, we conclude
that a significant fraction of the population of z ≃ 2−3 distant red galaxies (van Dokkum et al., 2006; Kriek et al., 2008) may have passed through the LBG phase
while assembling their mass.
Most of the progress in our understanding of galaxy formation in the first two
billion years has stemmed from measurements of the integrated properties of high
redshift galaxies. While such observations have certainly improved our
understand-ing of galaxies at early times, in order to shed light on the physics governunderstand-ing star
formation in these galaxies, one must study their internal structure (i.e. dynamical
state, distribution of HII regions and molecular gas). The development of integral
field spectrographs on 8-10 meter telescopes has led to recent progress on this front
(e.g., Forster-Schreiber et al. 2006, Law et al. 2007), but the interpretation of these
studies is often ambiguous due to the lack of independent resolution elements. In this
thesis, we discuss how progress can be achieved through the study of
gravitationally-lensed systems. We present observations of the resolved star formation, dynamics,
and gas physics of one of the most highly-magnified LBGs at z = 3.06. We find well-ordered rotation and infer that molecular gas is being efficiently converted into
stars in a remarkably compact region, suggesting that we are possibly witnessing the
early growth of a disk galaxy where the current star formation is rapidly assembling a
central bulge. While the results are only based on a single system located at
compar-itively low-redshift for this thesis, we note that ongoing surveys are now discovering
many more strongly-lensed systems out to z ≃ 7 (Belukorov et al. 2007, Frye et al. 2007, Richard et al. 2008, Bradley et al. 2008); hence we argue that the method
de-scribed within this chapter will soon become a commonly-used, effective path toward
viii
Contents
Abstract v
1 Introduction 1
1.1 Patching together Cosmic History . . . 2
1.2 Galaxies in the Reionization Era and Beyond . . . 7
1.3 Thesis Overview . . . 11
2 A New Measurement of the Stellar Mass Density at z ≃5: Implica-tions for the Sources of Cosmic Reionization 15 Abstract . . . 15
2.1 Introduction . . . 16
2.2 The GOODS-S Dataset . . . 19
2.2.1 ACS Imaging . . . 20
2.2.2 Ground-Based Near-infrared Imaging . . . 20
2.2.3 Spectroscopy . . . 21
2.2.4 SpitzerImaging . . . 21
2.3 Photometric Samples . . . 22
2.4 Selection of z≃5 Galaxies . . . 25
2.4.1 The Photometric Sample . . . 25
2.4.2 The Spectroscopic Sample . . . 34
2.5 Stellar Mass Determination . . . 38
2.5.1 Masses for the Spectroscopic Sample . . . 38
2.5.2 Masses for the Photometric Sample . . . 45
ix
2.6 Implications for the Previous Star Formation History . . . 48
2.7 Conclusions . . . 53
Acknowledgements . . . 54
3 A Keck Survey for Gravitationally-Lensed Lyman-α Emitters in at 8.5<∼z<∼10 56 Abstract . . . 56
3.1 Introduction . . . 57
3.2 Gravitational Lensing and Survey Strategies - A Critique . . . 60
3.3 NIRSPEC Critical Line Survey . . . 63
3.3.1 Cluster Sample . . . 63
3.3.2 Observations and Data Reduction . . . 65
3.3.3 Survey Sensitivity . . . 68
3.3.4 Cluster Magnification . . . 70
3.3.5 Limiting Lyman-α Luminosity . . . 73
3.4 Identification and Reality of the Candidate Lyman-α Emitters . . . . 74
3.5 Verifying the Candidate Redshifts . . . 78
3.5.1 Stacked Line Profile of Candidates . . . 81
3.5.2 Searching for Lensed Pairs . . . 81
3.5.3 Broadband Photometry of Candidates . . . 82
3.5.4 Spectroscopically Testing Low Redshift Scenarios . . . 84
3.5.5 Best Candidates: Abell 68 c1 and Abell 2219 c1 . . . 87
3.5.6 Other Candidates . . . 92
3.6 Implications . . . 93
3.6.1 Volume Density of z>8 Lyman-α Emitters . . . 93
3.6.2 Contribution of Low Luminosity Galaxies to Reionization . . . 98
3.7 Summary . . . 100
x
4 An Empirically-Calibrated Model For Interpreting the Evolution of
Galaxies During the Reionization Era 110
Abstract . . . 110
4.1 Introduction . . . 111
4.2 A Physical Model for High Redshift Star Forming Galaxies . . . 114
4.3 The Effect of Variance in Deep Surveys . . . 118
4.3.1 Variance in Narrowband Surveys . . . 120
4.3.2 Variance in Lyman-break Surveys . . . 124
4.3.3 Variance in Lensed Longslit Spectroscopic Surveys . . . 125
4.4 Model Calibration Using z ≃5−6 Observations . . . 128
4.4.1 Lyman-Break Galaxies . . . 128
4.4.2 Lyα emitters . . . 132
4.4.3 Comparison of LAEs and LBGs . . . 136
4.5 Interpretations of Observations at z ≃7−10 . . . 138
4.5.1 Lyman-Break Galaxies . . . 138
4.5.2 Lyα Emitters . . . 141
4.6 Implications for Future Surveys . . . 143
4.6.1 The Dark Ages z Lyman-alpha Exlorer: LAEs at z ≃7−10 . 144 4.6.2 Imaging Surveys for LBGs at z ≃7−10 . . . 147
4.6.3 Lensing Surveys for Star-forming Galaxies at z ≃7−10 . . . 150
4.7 Conclusions . . . 155
Acknowledgements 159 5 The Evolutionary History of Lyman Break Galaxies Between Red-shift 4 and 6: Observing Successive Generations of Massive Galaxies in Formation 160 Abstract . . . 160
5.1 Introduction . . . 161
5.2 Data . . . 165
xi
5.2.2 Optical Photometry . . . 166
5.2.3 Near- and mid-infared Photometry . . . 166
5.3 Selection of High-Redshift Galaxies . . . 167
5.3.1 Dropout Selection . . . 167
5.3.2 Removal of Stellar and Low-z Contaminants . . . 170
5.3.3 Surface Densities and Effective Volume . . . 172
5.3.4 The Evolving Rest-Frame UV Slopes of High Redshift Galaxies 174 5.4 Mid-infrared Properties of Dropouts . . . 177
5.4.1 Construction of Spitzer-Isolated Subsample . . . 177
5.4.2 MIPS Detections . . . 179
5.5 Derivation of Physical Properties . . . 180
5.5.1 CB07 Models . . . 180
5.5.2 The Effect of TP-AGB stars on Inferred Properties at z >∼4 . 182 5.5.3 Systematic Uncertainties in Derived Properties . . . 184
5.6 New Insight into the History of High Redshift Star Formation . . . . 186
5.7 Connecting the z >∼ 4 Mass Assembly History to Quiescent Galaxies atz ≃2 . . . 199
5.8 Summary . . . 205
6 Resolving the Formation of the First Galactic Disks 209 6.1 Supplementary Information . . . 218
6.1.1 Details of the Keck/OSIRIS Observations: . . . 218
6.1.2 Gravitational Lens Modelling: . . . 218
6.1.3 Analysis of Emission Line Maps: . . . 219
6.1.4 Rotation vs. Merger Interpretation: . . . 221
6.1.5 The Rotating Disk Model: . . . 223
6.1.6 Metallicity Constraints: . . . 225
xii
7 Synthesis and Future Directions 228
7.1 Summary of Recent Progress . . . 228
7.2 The Contribution of Galaxies to Reionization . . . 233
7.3 Future Directions . . . 237
7.3.1 Continuum Dropouts atz >∼7 . . . 237
7.3.2 Detecting Lyman-α at z>∼7 . . . 241
7.3.3 Detailed Properties of Galaxies at z ≃3−6 . . . 243
xiii
List of Figures
1.1 Limits on the comoving densities of primeval galaxies circa 1994 . . . . 5
1.2 Observational constraints on the History of Reionization . . . 9
1.3 Evolution of LBGs over 3< z∼ <∼10 . . . 11
2.1 Colors of z≃5 candidates in GOODS-S. . . 26
2.2 Colors of Spectroscopically Confirmed Subset . . . 35
2.3 Best-fit Bruzual & Charlot (2003) SEDs to 15 spectroscopically-confirmed z ≃5 galaxies. . . 42
2.4 Confidence intervals on inferred stellar mass and age. . . 43
2.5 Distribution of IRAC magnitudes for photometrically-selected subset. . 44
2.6 Comoving star formation rate density as a function of redshift. . . 50
2.7 Evolution of Stellar Mass Density at z ≃5−10 . . . 52
3.1 Strategies for Locating Lyman-α Emitters . . . 62
3.2 Clusters surveyed with NIRSPEC . . . 65
3.3 Sensitivity Limit for NIRSPEC survey . . . 69
3.4 Magnification as function of Redshift and Position along typical NIR-SPEC slit. . . 71
3.5 Distribution of Lensing Magnification in NIRSPEC Survey. . . 72
3.6 Candidate Lyman-α emitters . . . 75
3.7 Noise Distribution of NIRSPEC data . . . 77
3.8 Broadband Images of Candidate Lyman-α Emitters . . . 83
3.9 Possible Emission Line Explanations for Candidates . . . 85
xiv
3.11 Constraints on number density of 8.5<z<10.2 sources. . . 96
3.12 Comparison of Implied Abundance of z >∼ 8 Lyman-α Emitters with that Required for Reionization . . . 101
4.1 Variance in a narrowband Lyα survey. . . 121
4.2 Variance in dropout LBG survey. . . 125
4.3 Variance in a z= 10 lensed longslit spectroscopic survey. . . 127
4.4 Confidence intervals on fit to the observed abundances of LBGs at z=6. 129 4.5 Predicted LBG luminosity function at z=6 and 7.6 . . . 131
4.6 Confidence intervals on fit to LAEs . . . 133
4.7 Model fits to Lyα luminosity function at z=5.7 and z=6.5 . . . 134
4.8 Comparison of model z = 9 LBG luminosity function with constraints from observations. . . 140
4.9 Comparison of model z ≃ 9 LAE luminosity function with constraints from observations. . . 143
4.10 Prospects of Future Surveys to Detect Lyα Emitters at z >∼7 . . . 146
4.11 Prospects of Future Surveys to Detect LBGs at z ≃7.5 . . . 148
4.12 Prospects of Future Surveys to Detect LBGs at z ≃10 . . . 151
5.1 Distribution of Optical Magnitudes for Dropout Samples. . . 169
5.2 Surface Density of Dropout Samples. . . 172
5.3 Variation in Rest-frame UV Slope with apparent magnitude and Redshift175 5.4 Mid-infrared vs. optical flux for Dropouts . . . 178
5.5 Comparison of Stellar Masses Derived from CB07 and BC03 models. . 183
5.6 Systematic Uncertainty in Inferred Stellar Masses and Ages . . . 184
5.7 Best fit Models to Composite SED of faint B-dropout Stack . . . 187
5.8 Stellar Mass vs. absolute magnitude at 1500˚A (uncorrected for dust extinction) over z ≃4−6. . . 189
5.9 Ages of B-dropout sample as function of M1500. . . 193
5.10 Stellar Mass Function of Dropout Samples . . . 200
xv
6.1 Color Image of J2135-0102, a strongly lensed z = 3.07 LBG . . . 212 6.2 Source Plane Properties of J2135-0102 . . . 216
6.3 Uncertainties in Source Plane Reconstruction . . . 220
6.4 Best-Fitting Disk Model for J2135-0102 and Corresponding Residuals. 224
7.1 Redshift Evolution of Characteristic Rest-Frame UV Luminosity. . . . 230
7.2 Observational Constraints on Ionizing Emissivity at High Redshift . . . 234
xvi
xvii
List of Tables
2.1 Photometric catalog of z ≃5 galaxies in GOODS-S Field . . . 30
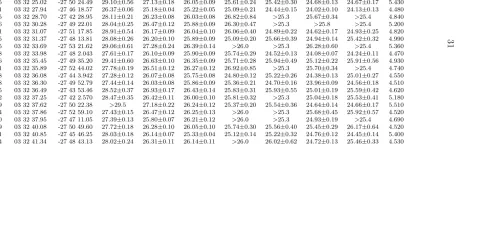
2.1 Photometric catalog of z ≃5 galaxies in GOODS-S Field . . . 31
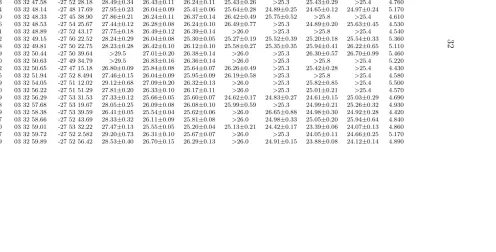
2.1 Photometric catalog of z ≃5 galaxies in GOODS-S Field . . . 32
2.1 Photometric catalog of z ≃5 galaxies in GOODS-S Field . . . 33
2.2 Spectroscopically-confirmed z ≃5 galaxies in GOODS-S Field . . . 36
2.3 Photometric Properties of z≃5 spectroscopically-confirmed galaxies. . 37
2.4 Modeling Results . . . 41
3.1 Clusters surveyed . . . 64
3.2 NIRSPEC Survey Observations . . . 66
3.3 NIRSPEC Lyman α Candidates . . . 75
3.4 Wavelengths of Additional Emission Lines for Low-z Scenarios . . . 85
3.5 Constraints on Low-redshift Interpretations of Candidates . . . 88
3.5 Constraints on Low-redshift Interpretations of Candidates . . . 89
3.5 Constraints on Low-redshift Interpretations of Candidates . . . 90
4.1 Variance in High-z Galaxy Surveys . . . 123
5.1 Photometry of Stacked Images . . . 186
xviii
1
Chapter 1
Introduction
Observational cosmologists have long sought to capture the history of the universe,
from its origins to the present day. Measurements of the cosmic microwave
back-ground radiation (CMB) currently provide our earliest snapshot of the universe, just
400,000 years after the Big Bang (z ≃ 1100). At this time, the universe had finally cooled sufficiently to allow electrons and protons to combine to form hydrogen atoms.
The next available picture comes almost one billion years later (z ≃6−7), revealing a decidedly more complex universe containing an abundant population of galaxies and
quasars and an ionized intergalactic medium (IGM). The period between these two
redshifts represents one of the final uncharted frontiers in cosmology. Buried in this
unexplored era are the keys to understanding how the first stars and galaxies came
to be and what led to the reionization of intergalactic hydrogen.
The goal of my thesis has been to push back the redshift frontier to yet earlier
times, shedding light on the nature of the earliest galaxies, quantifying their
contri-bution to the reionization of hydrogen, and optimizing the methods used to detect
them. Before beginning a detailed discussion of the specific projects that make up
this thesis, it is worthwhile to consider the developments that have laid the ground
for the consideration of these issues. With this goal in mind, in §1.1, I provide a
brief historical narrative focused on the events that led to our current observational
understanding of cosmic history in the high-redshift universe. Following this section,
I discuss more recent developments (§1.2), closing with brief descriptions of each of
2
1.1
Patching together Cosmic History
We begin our discussion in the early 1920s, a time in which there was still contentious
debate focused on whether the universe extended beyond the Milky Way. This
de-bate was ultimately resolved in 1925 through observations of Cepheid stars in spiral
nebulae. Using the known relationship between the variability period and stellar
luminosity, Edwin Hubble established that the nebulae were located outside of our
galaxy. With this discovery, our understanding of the universe was fundamentally
altered and moreover the field of extragalactic astronomy was born.
It did not take long for the observational study of distant galaxies to further
revolutionize the prevailing cosmological model. Pioneering work by Hubble in the
1920s revealed that distant galaxies were recessing away the Milky Way with a velocity
proportional to their distance. Georges Lemaitre claimed that this correlation offered
concrete evidence that the universe was expanding, a notion that both he and and
Alexander Friedmann had previously proposed. Lemaitre went on to argue that a
necessary ramification of the expansion is that the universe began in an “explosion”
from what he referred to as a “primeval atom,” later coined the big bang by Fred
Hoyle.
In the 1940s, work by Gamow and Alpher further developed Lemaitre’s theory,
working out the sequence of the nucleosynthesis that occurred after the big bang and
making one of the fundamental predictions of big bang theory. In their model, the
early universe was comprised of a hot plasma of protons, electrons, and photons. The
photons coupled to the plasma by their interaction with electrons through Thomson
scattering. As the universe expanded, its temperature decreased via adiabatic cooling,
eventually reaching 4000 K, whereby the electrons and protons could combine to form
neutral hydrogen. At this point, the photons became decoupled from matter and
began to travel freely through space, their temperature continuing to decrease as the
universe expanded. Gamow predicted this radiation field should be observable at
the present day with a temperature of 5 K. Sixteen years later, this prediction was
3
(1965), a resounding success for the big bang theory.
The same year that Penzias and Wilson discovered the CMB, astronomers began to
realize that the universe must have been reionized at some point after recombination.
Two independent papers in 1965 pointed out that if the IGM was still filled with
the neutral hydrogen, the resonant interaction between Lyα photons and hydrogen would lead to a very large optical depth to Lyα photons, causing the spectra of extragalactic sources to be strongly absorbed at wavelengths shorter than Lyα(Gunn & Peterson, 1965; Scheuer, 1965). The discovery of a quasar located at a high enough
redshift for Lyα to be in the visible (Schmidt, 1965) allowed this “Gunn-Peterson” test to be performed. Remarkably these observations revealed little absorption at
frequencies blueward of Lyα implying that the IGM must not contain significant neutral hydrogen. Gunn & Peterson concluded that if current estimates of the mass
density of the universe are accurate then the hydrogen making up the IGM must be
highly ionized, requiring an additional phase transition at some point afterz ≃1100. What provided the ionizing flux responsible for this reionization was not known,
although as we will see in the next several paragraphs, work by Peebles and others
would soon predict a tremendous ionizing source at high-redshift likely to play a
significant role.
In the mid 1960s, cosmologists began to focus their efforts on explaining the
forma-tion of galaxies in the context of an expanding universe. In a series of papers, Peebles
layed the groundwork for the field of structure formation, explaining how galaxies
could have formed from small-scale fluctuations imprinted on the initial density field.
These density perturbations grew more pronounced with time via gravitational
at-traction, becoming detached from the expansion and forming a bound system once
the Jeans instability criterion was satisfied. The collapse of these bound gas clouds
subsequently led to the formation of massive protogalaxies (see also Larson 1974).
Throughout the 1960s, observational constraints on these theories were
predom-inantly limited to observations of our own galaxy (e.g. Eggen et al. 1962), which
suggested that the halo of our galaxy must have formed in a free-fall time with
4
seminal paper, Partridge & Peebles (1967) considered the possibility of directly
lo-cating galaxies during their initial assembly. Adopting a simple dissipationless model
for galaxy formation, they predicted that ≃ 1011 M
⊙ galaxies would begin
form-ing when the universe was 140 Myr old (z ≃ 20). These “primeval galaxies” were predicted to be large (≃ 10 arcsec) low surface brightness systems with bolometric
luminosities on order 2.5×1045 erg s−1. Detection of rest-UV continuum emission
from such protogalaxies was thought difficult given the brightness of the night sky at
the wavelengths the galaxy emission was expected to be brightest (1-3µm). Instead, Partridge & Peebles suggested the most promising method of detecting protogalaxies
would be the Lyα emission line, which they predicted might contain up to 6-7% of the bolometric luminosity.
This theoretical exploration led to numerous observational attempts to locate
the formation epoch of galaxies. Initial experiments, designed to find diffuse, large
(θ <∼3”) images on photographic plates (Partridge, 1974) and to find the fluctuation signal expected from such a high-redshift population (Davis & Wilkinson, 1974) met
with no success. The advancement of dissipative galaxy formation theories (Larson,
1974; Meier, 1976; Sunyaev et al., 1978) shifted the strategy of primeval galaxy surveys
toward more compact, blue systems. With the development of CCD detectors in the
late 1970s, such surveys became much more efficient, but the null results continued
through the 1980s (see Koo 1986 and references therein).
One of the major barriers impeding progress in the observational pursuit of the
primeval galaxies was the tremendous uncertainty in the expected redshift, luminosity,
and size distribution of the population. Different assumptions led to widely different
predictions which vastly increased the observational parameter space that needed to
be probed. Even with the development of galaxy formation scenarios in the context
of the now-standard cold dark matter theory of structure formation (White & Rees,
1978; Blumenthal et al., 1984; White & Frenk, 1991), uncertainties in the properties
and epoch of the galaxy formation remained significant, due largely to the difficulty
in constraining the heating and cooling physics that governs star formation (not to
5
Figure 1.1 Limits on the comoving densities of LAEs at z ≃3 from the mid 1990s as compiled in Pritchet (1994). The shaded region corresponds to parameter space that had been covered in previous surveys, while the curve represents a simple model of the LAE luminosity function described in Pritchet & Hartwick (1990). The puzzling lack of LAE detections seemed to imply serious flaws in the model.
models predicted a relatively late formation epoch, a conjecture that was given further
support by claims that damped Lyα absorbers at z ≃ 2 contained sufficient neutral gas to form all the stars seen locally (Wolfe, 1988). However, there was not a complete
consensus surrounding the notion of a late formation epoch. Indeed, the discovery of
luminous quasars at z ≃ 4−5 was argued to provide strong evidence that galaxies were primarily formed at z >∼5 (Turner, 1991).
With no clear picture from observations or theory, observers soldiered on in their
efforts to locate primeval galaxies, covering new regions of luminosity and redshift
parameter space. Deep redshift surveys uncovered a population of faint blue
galax-ies (Broadhurst et al., 1988; Colless et al., 1990), but these sources were generally
found to lie at moderately low-redshifts (z <∼0.9). Emission line searches reached increasing levels of sophistication throughout the 1980s and early 1990s using slitless
spectroscopy (Crampton et al., 1987), long-slit spectroscopy (Cowie, 1988; Djorgovski
& Thompson, 1992; Djorgovski et al., 1993), and narrowband imaging (Cowie, 1988;
6
search for primeval galaxies atz ≃2−5. While these surveys did uncover a number of intriguing candidates, no unambiguous primeval galaxies were identified (Figure
1.1). Knowledge of galaxies in the z >∼2 universe was thus limited to quasars and radio galaxies (Lilly, 1988; Chambers et al., 1990), superluminous infrared objects
(Rowan-Robinson et al., 1991), and damped Lyα absorbers (e.g. Wolfe et al. 1992). How these objects related to the sought after primeval galaxies was unclear.
In the mid 1990s, work by Steidel and collaborators identified a population of
actively star-forming galaxies at z ≃ 3 using color selection techniques (Steidel & Hamilton, 1992, 1993; Steidel et al., 1995). The method targeted star-forming
galax-ies at 3.0< z∼ <∼3.5 using three custom broadband filters designed to isolate objects with Lyman continuum breaks and flat far-UV continuum slopes (fν ∝ν0) from the
foreground population. Keck spectroscopy soon after confirmed the redshifts of this
population of “Lyman break galaxies” (LBGs) and moreover enabled the detailed
spectroscopic properties of the population to be studied (Steidel et al. 1996),
reveal-ing surpisreveal-ingly weak Lyα emission and the existence of P-Cygni profiles suggestive of strong winds. The implied star formation rates, velocity dispersions, and
morpholog-ical properties of the LBGs were argued to be consistent with that expected for the
high-redshift precursors to the spheroids of the local universe (Steidel et al., 1996;
Giavalisco et al., 1996).
In spite of the success of the LBG surveys, it was realized early on that the
galaxies selected using these techniques are biased to the portion of the high-z star-forming population with little dust extinction and strong continuum emission. Indeed
some of the most actively star-forming galaxies in the local unvierse are completely
enshrouded in dust, emitting most of their luminosity in the far-infrared. With the
arrival of sensitive submillimeter observations (via the SCUBA array on the James
Clerk Maxwell Telescope) in the mid 1990s, the high- redshift counterparts of these
local systems – the submillimeter galaxies (SMGs) – were soon discovered (Smail et
al., 1997; Hughes et al., 1998; Barger et al., 1998) suggesting that LBG surveys were
7
redshift. Such objects were thought to have relatively little continuum light making
their detection in LBG surveys difficult. In 1996, Hu & McMahon achieved success
using this technique, reporting the detection of a pair of Lyα emitting star-forming galaxies (LAEs) at z = 4.55. The advent of 10 meter telescopes rapidly made the detection of such high-z LAEs commonplace (Cowie & Hu, 1998; Hu et al., 1998) and soon the galaxy redshift frontier was pushed back nearly to z ≃ 6 (Hu et al., 1999). Thus by the late 1990s, after many decades of searching, large numbers of
star-forming galaxies were finally being discovered atz >∼2. In the following section, we bring our narrative to the present era, discussing the current challenges facing the
field.
1.2
Galaxies in the Reionization Era and Beyond
The motivation for locating primeval galaxies remains twofold. On one hand the goal
is to improve our understanding of when and how galaxies formed, but at the same
time, we are also interested in patching together the missing pieces of cosmic history
in the early universe. With the discovery and characterization of large samples at
z ≃ 2−5, these pursuits diverged. While considerable efforts continue to focus on the physics of galaxy formation at z ≃2−3 (e.g. Shapley et al. 2003, 2005; F¨orster Schreiber et al. 2006; Erb et al. 2006a,b,c; Law et al. 2007, etc.), those interested in
surveying the uncharted eras of cosmic history have begun to focus their efforts on yet
earlier times. Their goals have shifted from identifying the high-redshift precursors of
the luminous galaxies of the present day to understanding how the IGM was reionized
and when the first luminous sources and galactic systems emerged. In this section, I
will outline recent progress on this front, laying the framework for the projects that
I have conducted in this thesis.
In the last decade, the study of the first generation of stars, the so-called
Pop-ulation III, has emerged as one of the foremost areas of cosmological research.
Nu-merical simulations of the collapse and fragmentation of primordial, metal-free gas
8
and were primarily very massive due to the inability of the primordial gas to cool
efficiently (Bromm et al., 1999, 2002; Abel et al., 2000, 2002). The exact masses of
the Pop III stars and the precise form of the primordial initial mass function remain
unknown and are the focus of fervent numerical research (Larson, 1998; Nakamura &
Umemura, 2001; Omukai & Yoshii, 2003). Though the details remain controversial
and an active area of research (Bromm & Larson 2004 and references within), it is
clear that the epoch of Pop III star formation was eventually terminated and replaced
by a star-formation mode dominated by lower-mass stars. This important transition
is thought to have paved the way for the formation of the first galactic systems and
subsequently the reionization of hydrogen in the IGM.
While direct observation of the emergence of the first stars remains out of grasp
at the present day, the study of the subsequent reionization era is well within the
capabilities of current facilities. The three most fundamental questions that
observa-tions are attempting to address arewhendid reionization occur? Howdid it proceed? And what were the sources responsible for the transition? Complementary to these questions, observers are seeking to trace the growth of galaxies back to increasingly
earlier epochs, in hopes of identifying the era when the first galaxies began to emerge.
Recent observations have narrowed the era during which the bulk of reionization
occurred to 6-7< z∼ <∼20. Studies of the optical depth in Lyman-αabsorption probed by high resolution spectra of the most distant quasars show a rapid upward
transi-tion in the neutral fractransi-tion beyond z ≃ 5.5 (Djorgovski et al., 2001; Becker et al., 2001; Fan et al., 2006) suggesting that reionization may have ended at z ≃ 6-7. In contrast, others have argued that the evolution in the Lyα forest between z ≃ 2 and 6 can be explained as a result of slowly evolving densities, ionization rates, and
temperatures of the IGM, requiring no dramatic transition at z ≃ 6 (Becker et al., 2007). Regardless of the interpretation of the quasar absorption spectra, we can be
assured that reionization is complete byz <∼6 given the presence of significant trans-mitted flux in the quasar spectra below this redshift. Meanwhile, the optical depth
of microwave photons to electron scattering derived from the EE spectrum measured
9
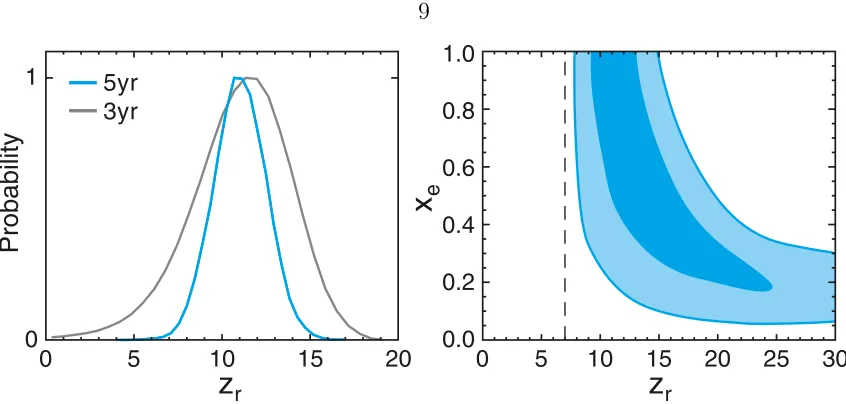
Figure 1.2 Constraints from the five-year WMAP data on the redshift of reionization taken from Dunkley et al. (2008). Assuming a simple instantaneous reionization model (left), the data rule out sudden reionization at z=6 with more than 99.9% confidence. Adopting a two-step reionization model (with reionization proceeding from an ionization fraction xe at redshift zr to full ionization at z=7), the WMAP
data are consistent with an extended reionization scenario, perhaps beginning as early as z≃15−20.
process, suggesting that the IGM was significantly ionized by z ≃ 11 and excluding an instantaneous reionization at z = 6 at the 99.9% confidence level (Figure 1.2). Taken together, the CMB polarization and quasar data are suggestive of a complex
and extended (∆z ≃5−10) ionization history.
Determining how reionization developed is a challenging endeavor with current technology. The basic picture of reionization involves the production and growth of
an HII region around each ionizing source with neighboring HII regions eventually
overlapping and ultimately terminating the reionization era. Initially it was thought
that reionization was limited by recombinations and hence proceeds from low- to
high-density regions (Miralda-Escud´e et al., 2000; Gnedin, 2000). Recent numerical
and analytical work has shown that a different picture emerges if the large- scale
clustering of sources is considered (Knox et al., 1998; Sokasian et al., 2003, 2004;
Furlanetto et al., 2004). In this picture, a small number of large ionized bubbles form
around highly-clustered sources with recombination playing only a secondary role
10
picture will require observations of the large-scale distribution of hydrogen throughout
the epoch of reionization. Assuming technical challenges (e.g. foreground removal,
ionospheric distortions) can be met, new facilities built to observe the redshifted
21-cm transition at high redshift (Morales & Hewitt, 2004) may eventually illuminate
how reionization occurred.
Characterizing the ionizing sources responsible for reionization is a more feasible
goal for existing observational facilities. The prevailing notion held today is that
star-forming galaxies dominate the ionizing photon budget during the end of the
reionization era, a conjecture supported by the discovery of evolved galaxies at z ≃
6−7 (Egami et al., 2005; Eyles et al., 2005) and the presence of CIV in the highest
redshift quasars sampled (Ryan-Weber et al., 2006), both of which require an earlier
(z >∼7) period of vigorous star formation. The emergence of an array of deep fields with extensive multiwavelength coverage has enabled galaxies to be selected toz ≃10, offering a direct probe of the nature of high-redshift galaxies and their contribution to the reionization process. The comoving density of emerging UV photons from
luminous galaxies appears to decrease continuously to z = 8 (Figure 1.3, Bouwens et al. 2008); simple estimates imply that the luminosity density of these UV-bright
sources is insufficient to reionize the universe without invoking non-standard initial
mass functions (Stiavelli et al., 2004; Oesch et al., 2008) or very steep faint end-slopes
for the luminosity function (Yan & Windhorst, 2004; Richard et al., 2008).
Reconciling the observed decline in the star formation rate density of luminous
galaxies with the requirements for reionization has become one of the major driving
forces behind the quest to locate the most distant galaxies. According to hierarchical
structure formation models, the dominant contribution to reionization comes from
low-luminosity galaxies residing in low-mass dark matter halos (e.g., Loeb 2006 and
references within), most of which likely lie faintward of the sensitivity limits of current
surveys. This notion is supported by measurements of the evolving UV luminosity
function of LBGs which show a continuously decreasing characteristic luminosity
11
Figure 1.3 Left: The evolution of the star formation rate density over cosmic history as taken from Bouwens et al. (2008). The data show a marked decline in luminous UV emitting sources between z ≃ 3 and 10, causing tension with the requirements for reionization (e.g., Bunker et al. 2004). Right: The evolving UV luminosity func-tions of B-drops (blue), V-drops (green),i′-drops(red), andz-drops (pink) taken from
Bouwens et al. 2008. The decline in density betweenz ≃4 andz ≃7.5 is much larger for the most luminous sources, implying that galaxies are becoming increasingly dom-inated by low luminosity systems at high-redshift. This suggests that there may be a large population of star-forming galaxies hidden beneath the sensitivity limits of current surveys.
at earlier times (Figure 1.3). While this certainly hints at an important contribution
of ionizing photons from low luminosity galaxies, it remains a distinct possibility that
feedback suppresses star formation in these dwarf galaxies, negating their contribution
to reionization. Characterizing the properties and abundance of this high-redshift
population has emerged as one of the most active areas of extragalactic astronomy
and plays a central role in my thesis, described in the following section.
1.3
Thesis Overview
My thesis consists of five separate projects, each providing a different means of
im-proving our undersanding of high-redshift galaxies or quantifying their contribution
to reionization. Below, I briefly summarize the goals and conclusions of each of these
projects.
12
an indirect method of constraining star formation atz >∼6. Motivated by the discov-ery of galaxies with evolved stellar populations at z >∼6 (Egami et al., 2005; Eyles et al., 2005), we propose that a measurement of the stellar mass density at z ≃5−6 can be used to robustly constrain the integrated star formation density at yet
ear-lier times. Since it is incredibly challenging for current facilities to unambiguously
confirm galaxies at z >∼6, we argue that this method may represent one of the most promising means of characterizing the role that young galaxies play in reionization.
Examining the stellar masses of a large sample of z ≃5 rest-UV selected galaxies in the GOODS-S field, we derive an estimate of the z ≃5 stellar mass density. In spite of the fact that this measurement is surely incomplete (only UV luminous galaxies
are included), the resulting mass density is suprisingly large, requiring significant star
formation at yet earlier times.
Such indications of earlier activity strongly motivate attempts to secure a first
glimpse of thez >∼7 universe. In Chapter 3, I discuss the results of a Keck/NIRSPEC survey for gravitationally lensed LAEs at z >8 (originally published in Stark et al. 2007, 663, 10). The survey yielded six promising candidate LAEs between z=8.7
and z=10.2, suggesting that there may be a large population of feeble star-forming
sources at very early times. If these sources are at z > 8, it would indicate that low luminosity galaxies dominate the UV photon budget necessary for reionization,
explaining the shortfall found in previous studies of luminous sources. Follow-up
imaging and spectroscopy supports the high-redshift case, but the evidence is not yet
sufficient to claim these asz ≃10 sources. Further work is now underway to confirm the nature of the candidates.
Noting the rapid observational progress identifying the first candidate galaxies at
z >∼7 and hundreds of galaxies at z ≃ 5−6, I set out in Chapter 4 to put these observations in the context of a simple analytic star formation model taking into
consideration the evolution in the underlying dark matter halos (originally published
in Stark, Loeb, & Ellis 2007, ApJ, 668, 627). We find that the abundance of luminous
13
the abundance of less luminous star-forming galaxies at z ≃ 9−10 are higher than predicted by the simple model and, if verified by further data, may suggest a
top-heavy stellar mass function at these early epochs. Using the model, we conclude that
with the development of new instrumentation, dedicated programs should soon allow
considerably larger samples ofz ≃7−8 LBGs and LAEs to be detected.
As observations probe closer to the epoch when the first galactic systems emerge,
it is thought that star-forming galaxies will begin to appear younger and less massive
then their lower-redshift counterparts. While the first glimpse of the stellar
popula-tions of high-z galaxies has been obtained in recent years (Egami et al., 2005; Eyles et al., 2005), lacking has been a systematic analysis of the evolving stellar masses and
ages of a large sample of LBGs uniformly selected in different redshift bins at z >∼3. In Chapter 5, we present the first such analysis, compiling the stellar populations of
a large sample (>∼4500 galaxies) of photometrically selected LBGs at z ≃ 3.5−6.5. While we find considerable variation in the stellar mass as a function of rest-UV
lu-minosity, we find no evidence that the dropouts at z ≃ 6 are significantly younger or less massive than those at z ≃ 4. The results are consistent with a picture in which the evolving stellar mass and luminosity distributions are being predominantly
driven by growth in the underlying dark matter halo mass functions and show no
sign of reaching the era when galactic systems are undergoing their initial assembly.
These results also have implications for the formation mode of the massive distant red
galaxies (DRGs) seen at z ≃2−3 (e.g., van Dokkum et al. 2006). By computing the density of massive galaxies betweenz ≃6 and 4 and comparing to those measured in
z ≃2−4 DRG populations, we conclude that a significant fraction of the z ≃2−3 DRGs passed through the LBG phase at z >∼4 while assembling their mass.
In the first five chapters, the majority of our discussion has focused on
measure-ments of the integrated properties (i.e., star formation rate, stellar mass) of galaxies
at high redshift. While such observations have certainly improved our
understand-ing of star formation at early times, more insight into the physics governunderstand-ing galaxy
14
of high redshift galaxies. Of particular interest is when the angular momentum of
galaxies was established. With the development of integral field spectrographs on
8-10 meter telescopes, it is now becoming possible to explore these questions at high
redshift for the first time. The first results (e.g., F¨orster Schreiber et al. 2006; Law et
al. 2007) do not yet reveal a complete picture, with the largest galaxies showing
evi-dence of rotation and smaller systems showing more chaotic velocity fields. However,
the interpretation of these studies is confused by the lack of independent resolution
elements. In Chapter 6, we show how progress can be achieved through the study of
gravitationally-lensed systems. We present observations of the resolved star
forma-tion, dynamics, and gas physics of one of the most highly-magnified LBGs atz = 3.07, concluding that the galaxy is destined to be a bulge-dominated galaxy. While the
results are only based on a single system located at comparitively low-redshift for this
thesis, we note that ongoing surveys are now discovering many more strongly-lensed
systems out to z ≃ 7 (Belokurov et al., 2007; Frye et al., 2007; Richard et al., 2008; Bradley et al., 2008); hence we argue that the method described within this chapter
will soon become a commonly-used, effective path toward revealing the nature of the
most distant galaxies.
In the final chapter, we attempt to synthesize these results. After summarizing the
key findings of the thesis and commenting on ongoing work, we revisit the question
of whether the ionizing emissivity of the observed 6 < z∼ <∼ 10 galaxy population is sufficient to achieve reionization by z >∼6. We close by proposing several of the most promising routes toward improving our understanding of the early universe. We
discuss the prospects of new imaging and spectroscopic campaigns to secure large
15
Chapter 2
A New Measurement of the Stellar
Mass Density at
z
≃
5
:
Implications for the Sources of
Cosmic Reionization
Abstract
We present a new measurement of the integrated stellar mass per comoving
vol-ume at redshift 5 determined via spectral energy fitting drawn from a sample of 214
photometrically-selected galaxies with z′
850LP <26.5 in the southern GOODS field.
Following procedures introduced by Eyles et al. (2005), we estimate stellar masses for
various sub-samples for which reliable and unconfused Spitzer IRAC detections are
available. A spectroscopic sample of 14 of the most luminous sources with z = 4.92 provides a firm lower limit to the stellar mass density of 1 × 10⁶M
⊙ Mpc−3. Several
galaxies in this sub-sample have masses of order 1011M
⊙ implying significant earlier
activity occurred in massive systems. We then consider a larger sample whose
photo-metric redshifts in the publicly-available GOODS-MUSIC catalog lie in the range 4.4
< z < 5.6. Before adopting the GOODS-MUSIC photometric redshifts, we check the accuracy of their photometry and explore the possibility of contamination by low-z
galaxies and low-mass stars. After excising probable stellar contaminants and using
the z′
850LP −J color to exclude any remaining foreground red galaxies, we conclude
16
that 196 sources are likely to be at z ≃ 5. The implied mass density from the un-confused IRAC fraction of this sample, scaled to the total available, is 6×10⁶M
⊙
Mpc−3. We discuss the uncertainties as well as the likelihood that we have
under-estimated the true mass density. Including fainter and quiescent sources the total
integrated density could be as high as 1×10⁷M
⊙ Mpc−3. Even accounting for 25%
cosmic variance within a single GOODS field, such a high mass density only 1.2 Gyr
after the Big Bang has interesting consequences for the implied past average star
formation during the period when cosmic reionization is now thought to have taken
place. Using the currently available (but highly uncertain) rate of decline in the star
formation history over 5< z < 10, a better fit is obtained for the assembled mass at
z ≃ 5 if we admit significant dust extinction at early times or extend the luminosity function to very faint limits. An interesting consequence of the latter possibility is
an abundant population of low luminosity sources just beyond the detection limits of
current surveys. As mass density estimates improve at z ≃ 5-6, our method is likely to provide one of the tightest constraints on the question of whether star forming
sources were responsible for reionizing the Universe.
2.1
Introduction
Finding the sources responsible for cosmic reionization is now the active frontier in
studies of galaxy formation. A number of independent arguments are focusing efforts
on searches for star forming galaxies in the redshift interval 5 < z < 10. Studies of the optical depth in Lyman α absorption probed by high resolution spectra of the most distant quasars suggest an upward transition in the neutral fraction beyondz ≃
5.5 (Fan et al., 2006); these data suggest reionization was just ending at z ≃ 6. In contrast, the optical depth of microwave photons to electron scattering derived from
the angular power spectrum of the WMAP polarization-temperature cross-correlation
function (Spergel et al., 2006) places a valuable upper bound on the reionization
process corresponding toz ≃ 10-20.
17
the Universe has rapidly expanded to the point where the discovery of z ≃ 5− 6 star-forming galaxies has now become routine. Deep imaging surveys with the
Hubble Space Telescope (HST)and 8-10 meter ground based telescopes have uncovered hundreds of galaxies at z ≃ 5 (Iwata et al., 2003; Bremer et al., 2004) and z ≃ 6 (Bunker et al., 2004; Dickinson et al., 2004; Bouwens et al., 2006) via the Lyman
break galaxy (LBG) technique pioneered by Steidel and collaborators to identify
star-forming galaxies atz ≈3−4 (Steidel et al., 1996, 1999).
The consensus emerging from these studies, however, is that abundance of lumi-nousgalaxies is substantiallylessatz ≈6 than atz ≈3 (Stanway et al., 2003; Bunker et al., 2004; Dickinson et al., 2004; Bouwens et al., 2006). If this trend continues to
fainter systems and higher redshift, then it may prove challenging to explain the
ear-lier star formation activity necessary to fulfill reionization in the redshift interval 5
< z < 10 implied by the quasar and WMAP studies (Bunker et al., 2004). However, it has been suggested that the evolution in the galaxy luminosity function between
z = 3 and z = 6 is luminosity dependent: although the entire luminosity function is not yet well-constrained atz ≈6, intrinsically fainter galaxies appear to become more abundant at earlier times (Bouwens et al., 2006). If this is the case, then the bulk
of reionizing photons could come from lower luminosity galaxies not yet adequately
probed in deep surveys.
As the redshift boundary of cosmic reionization narrows, so it becomes crucial to
improve our understanding of the cosmic star formation history in the corresponding
time interval. Unfortunately however, confirming even the most luminous sources in
the range 7 < z < 10 is challenging for current facilities. Although some candidate
z ≃ 7−10 galaxies have been identified in ACS and lensed surveys (Bouwens et al 2004b, Bouwens et al 2005, Richard et al 2006, Stark et al. 2007b), these are generally
too faint for spectroscopic study. The situation may not significantly improve for
several years.
This paper explores a more practical approach for constraining the amount of star
18
the stellar mass density atz ≃5-6 must represents the integral of past activity. With adequate precision, such estimates can be used to independently verify the claimed
decline in overall star formation to z ≃ 10 and to assess whether the past activity is sufficient for cosmic reionization.
The approach is made practical by the remarkable progress recently made in
estimating stellar masses at high redshift via the use of the Infrared Array
Cam-era (IRAC, Fazio et al. 2004) onboard the Spitzer Space Telescope. Egami et al. (2005) first demonstrated the technique for one of the most distant known sources:
a multiply-imaged pair with a photometric redshift of z ≃ 6.8. Eyles et al. (2005) later extended the technique for two spectroscopically-confirmed galaxies at z = 5.8, demonstrating the presence of massive galaxies (Mstellar > 1010M
⊙) with evolved
stellar populations of ages ≫100 Myr.
The IRAC filters at 3.6−8.0µm probe the rest-frame optical atz ≈5−6, provid-ing a valuable indicator of established stellar populations and, indirectly, hintprovid-ing at
vigorous star formation activity atz >6. Combining these data with deep broadband optical photometry from HSTand 8-10 meter class ground based telescopes, spectral energy distributions (SEDs) can be compared with population synthesis models to
constrain the age, star formation history and stellar masses of galaxies. The initial
discovery of massive (1010M
⊙) galaxies at z ≃ 6 presented in Eyles et al. (2005)
was subsequently confirmed by the independent analysis of Yan et al. (2005). More
recently, Mobasher et al. (2005) identified a galaxy in the Hubble Ultra Deep Field
(UDF) with a photometric redshift ofz ≃6.5 (but see also the recent paper by Dun-lop et al. 2006). If this high redshift is correct, then the MIPS and IRAC detections
imply a very massive system of Mstellar > 1011M
⊙, providing further evidence for
significant star formation activity at z >6 (Panagia et al., 2005).
The studies of galaxy masses published thus far have focused on only a few
indi-vidual systems. Although some studies (e.g. Stark & Ellis 2006) have attempted to
infer the contribution of past star formation to cosmic reionization, without
know-ing how typical such massive galaxies are, it is difficult to make precise statements.
19
comovingstellar mass densitycan be directly compared with various models of earlier star formation.
In a companion paper, we compute the stellar mass density at z ≈ 6 from the
i′-band dropouts in GOODS-South (Eyles et al., 2007). A similar study of i′-drops
was conducted in Yan et al. (2006). However, the surface density of i′-band dropout
galaxies at z ≈ 6 with Spitzer detections is low. A more statistically-meaningful sample can be found using thez ≈5v-band dropouts. The age of the Universe at this time is only marginally older (1.2 Gyr c.f. 0.95 Gyr) yet larger, more representative,
samples are available. In this paper we will examine the stellar mass density at
z ≈5 using sources to a limiting magnitude of z′
850LP ≈26.5 selected from the Great
Observatories Origins Deep Survey (GOODS, Giavalisco et al. 2004a). We present an
analysis of various subsamples atz ≈5 drawn from a total of≃214 v-band dropouts. The goal of the study is to establish whether the assembled stellar mass at z ≃ 5 is consistent with current (and admittedly uncertain) estimates of the preceding star
formation activity. If not, this might be taken to imply a significant component of
star formation is missing, occurring either at lower intrinsic luminosities, obscured by
dust, or at uncharted epochs (z >10).
A plan of the paper follows. In §2.2, §2.3, and §2.4, we introduce the various
imaging and spectroscopic datasets, the photometric procedures and the selection of
various subsamples ofz ≃5 galaxies. We describe the derivation of the stellar masses and comment on the uncertainties in §5.5. In §2.6, we examine the implications for
the star formation history at earlier times.
We adopt a cosmology consistent with the initial WMAP data release (?): a
Λ-dominated, flat universe with ΩΛ = 0.7, ΩM = 0.3 andH0 = 70h70km s−1Mpc−1. All
magnitudes in this paper are quoted in the AB system (Oke & Gunn, 1983).
2.2
The GOODS-S Dataset
In this paper, we continue our analyses of the Great Observatories Origins Deep
20
ground-based facilities to study the high-redshift universe across a wide range of
wavelengths. We focus on the southern GOODS field which has the greatest amount
of multi-wavelength data essential for reliable stellar masses. The GOODS-S survey
area covers a total of 160 arcmin2 and is centered on the Chandra Deep Field South
(CDF-S; Giacconi et al. 2002).
2.2.1
ACS
Imaging
Deep optical imaging of GOODS-S has been obtained with the Advanced Camera
for Surveys (ACS, Ford et al. 2003) instrument onboard HST as part of a Treasury Program (Giacconi et al., 2002). The Wide Field Camera on ACS has a field of
202×202 arcsec2 and a pixel scale of 0′′.05. The GOODS-South field was observed
in the F435W (B-band), F606W (v-band), F775W (SDSS-i′) and F850LP (SDSS-z′)
broad-band filters for 3, 2.5, 2.5 and 5 orbits, respectively over 16 pointings.
Here we present an analysis of z ≃5 galaxies making use of the publicly-available version-1.0 data-release of the ACS GOODS data1. The reduced data have been
‘drizzled’ onto a large grid made up of 18 sections with a pixel scale of 0′′.03. Each
section comprises an image of 8192 × 8192 pixels in size.
2.2.2
Ground-Based Near-infrared Imaging
Deep near-infrared observations of most of the GOODS-S field were obtained with the
ISAAC camera on the Very Large Telescope (VLT) at the ESO Paranal Observatory
as part of the ESO Large Programme: LP168.A-0485(A) (PI: C. Cesarsky). The
publically available version-1.5 data release includes 24 fully reduced ISAAC/VLT
pointings in the J and Ks-bands2, covering ≈160 arcmin2. Additional details of the
observations are to be presented in Vandame et al. (2006, in prep). The VLT images have a pixel scale of 0′′.15, a factor of five times larger than the drizzled ACS pixels.
The median exposure times are 11.3 ksec in J, and 17.9 ksec in Ks.
1available fromftp://archive.stsci.edu/pub/hlsp/goods/
21
2.2.3
Spectroscopy
We also use publicly-available spectroscopy from the GOODS team to identify
con-firmed z ≈5 galaxies for futher study. Multi-object spectroscopy was performed on the GOODS-S field with the FORS2 instrument mounted at the Kueyen Unit
Tele-scope of the VLT at ESO’s Cerro Paranal Observatory as part of the ESO/GOODS
Large Program LP170.A-0788 (PI Cesarsky). Details of the survey are presented
in Vanzella et al. (2002, 2005). The primary selection criteria for placing objects
on the slitmask was (i′
775W −z′850LP) > 0.6 and z850′ LP < 25.0; objects with 0.45 <
(i′
775W −z′850LP)<0.6 were placed on the slitmask with lower priority. We make use
of the VLT/FORS2 spectroscopic catalogs from the version-2.0 release which provide
725 unique redshift assignments with quality flags A, B, or C (where A=solid redshift,
B=likely redshift, C=potential redshift).
2.2.4
Spitzer
Imaging
Spitzer images of GOODS-S were obtained with the Infrared Array Camera (IRAC) and Multiband Imaging Photometry for Spitzer (MIPS) cameras on theSpitzerSpace Telescope as part of the “Super Deep” Legacy programme (PID 169, Dickinson et
al. in prep, Chary et al., in prep). The IRAC camera comprises four channels, each with a 2562 InSb array imaging a 5.2′×5.2′ field with a pixel size of ≈1′′.22. Images
were taken through four broad-band infrared filters, with central wavelengths at
ap-proximately λcent = 3.6µm, 4.5µm, 5.6µm and 8.0µm (channels 1–4), and widths of ∆λFWHM = 0.68,0.87,1.25,2.53µm respectively. The total exposure time in each
channel is ≈86 ksec, depending on location. The data were taken in two epochs,
with the telescope roll angle differing by 180◦. In the first epoch, each filter covered
a 10.0′ × 10.0′ area in GOODS-S; however, the area covered by channels 1 and 3
(3.6µm and 5.6µm) was offset by 6.7 arcminutes from that covered by channels 2 and 4 (4.5µm and 8.0µm). Hence, only a portion of the GOODS-S field was observed in all 4 filters after the first epoch of observations. In the second epoch, the area
22
vice versa. A central overlap region appeared in both epochs, and this deeper area
intentionally contains the Hubble Ultra Deep Field (HUDF, Beckwith et al. 2003;
Bunker et al. 2004).
We analyze the publicly availableSpitzermosaics from the first and second epochs of the observations of GOODS-S 3. The data reduction pipeline employs a
‘multidriz-zle’ technique similar to that used successfully on HST/ACS GOODS data. This provides combined images with a pixel scale of 0′′.6. The magnitudes listed in this
paper are determined from this ‘drizzled’ data. We use the updated “Super Deep”
epoch 1 images from the third data release (DR3) and the Super Deep epoch 2 images
from the second data release (DR2).
2.3
Photometric Samples
The photometry we compute in this section will be used for two independent samples
of z ≃5 objects: a small sample of spectroscopically confirmed galaxies and a larger sample of photometrically selected galaxies. The spectroscopic sample will provide a
robust lower limit to the z ≃5 stellar mass density whereas the photometric sample will provide a more representative estimate of the integrated mass density. To obtain
stellar masses of individual galaxies, we must have accurate photometry for both
samples as well as photometric redshifts for the photometric sample. The reliability
of the photometric redshifts is especially crucial since contamination by low-redshift
interlopers could seriously skew our estimates of the total mass.
We obtain photometric redshifts from the GOODS MUSIC photometric catalog
of GOODS-S (Grazian et al., 2006). This catalog uses uses 13-band SEDs from HST
/ACS and Spitzer/IRAC photometry along with ground-based U, J, & KS to derive
photometric redshifts. Before adopting the GOODS MUSIC photometric redshifts,
we verify the accuracy of the photometry in the GOODS MUSIC catalog (discussed
below) and test the reliability of their photometric redshifts which we discuss in §4.1.
23
ACS photometry was obtained from the GOODS team r1.1 catalog 4. The
pho-tometric zeropoints adopted in the catalog on the AB magnitude system are 25.653,
26.493, 25.641, and 24.843 for the B435W-band, v606W-band, i′775W band, and z850′ LP
-band, respectively. We have corrected for the small amount of foreground Galactic
extinction using theCOBE/DIRBE &IRAS/ISSA dust maps of Schlegel et al. (1998); for the GOODS-S field, selective extinction is given by E(B−V) = 0.008 mag. Mag-nitudes are measured in 0′′.50-diameter apertures. Total magnitudes are derived from
the aperture magnitudes by correcting for the small amount of light falling outside the
aperture: 0.14, 0.15, and 0.20 magin the v606W,i′775W, and z850′ LP-bands, respectively
(Sirianni et al., 2005). We note that GOODS website implies that the SExtractor
parameter PHOT APERTURES measures the radius of the photometric aperture, when it in fact measures the diameter. The correct interpretation has been applied to our dataset.
Near-infrared photometry was performed with 1′′-diameter apertures using the
ground-based near-infrared ISAAC images. The center of the photometric aperture
was taken from the centroid of the GOODSr1.1 catalog. The seeing varied across the
ISAAC field as different tiles were taken over many nights, so we determined separate
aperture corrections from unresolved sources for each tile. For the J- and Ks-band
images the seeing is typically good (FWHM = 0′′.4−0′′.5), and the aperture corrections
are ≈0.3−0.5 mag, determined from bright but unsaturated isolated stars measured in 6′′-diameter apertures. The 3σ limiting AB-magnitudes in a 1′′-diameter aperture
are J ≈ 26.4 and KS ≈ 25.7, although these vary over the field because of different
exposure times and seeing conditions.
The details of