A National Statistics publication
National Statistics are produced to high professional standards set out in the National Statistics Code of Practice. They undergo regular quality assurance reviews to ensure that they meet customer needs. They are
Provision for children under five years of age in
England: January 2014
Reference SFR 20/2014
Date 26 June 2014
Coverage England
Theme Children, Education and Skills
Issued by Department for Education, Sanctuary Buildings, Great Smith Street, London SW1P 3BT
Press office 020 7925 6789
Public enquiries 0370 000 2288
Statistician Adam Whitaker
Phone 0114 274 2458
Email [email protected]
Internet Statistics: Childcare and Early Years
86,640
Eligible 2-year-olds are taking up their entitlement to funded early education.
96%
Of eligible 2-year-olds taking up funded early education do so in private and voluntary providers.1,299,910
3- and 4-year-olds are taking up funded early education – a rise of 1.3% from 1,283,500 last year and a rise of 9.6% since 2010 (1,186,370).97%
Of 3- and 4-year-olds are taking up funded early education – an increase of 1 percentage point on last year. This participation rate has been increasing since 2010 when the rate was 94%.1. Background and context
This Statistical First Release (SFR) contains the latest information for January 2014 on provision of education for children under 5 in the maintained, private, voluntary and independent sectors in England, together with figures for earlier years. The data was collected from schools, maintained nurseries, local authorities and private, voluntary and independent providers (PVIs) in January 2014 as part of the early years census, spring school census and the school level annual school census (for independent schools).
This SFR has data on: the types of providers; take-up rates; qualified staff; Ofsted ratings; number of funded hours. This SFR has three ways of counting children:
Number of Children This is a head count of children in receipt of some funded early education. Where they are receiving funded provision at more than one provider, they have only been counted once; it is a unique count of children.
Number of Places This is a count of the number of children at each provider. Where they are receiving provision at more than one provider, they have been counted more than once
Number of Part-time equivalents
This is the number of multiples of 15 hours across all children. For example, a child taking 7 hours entitlement and a different child taking 8 hours entitlement will equate to 1 part-time equivalent place.
All 4-year-olds have been entitled to a funded early education place since 1998 and in 2004 this was extended to all 3-year-olds.
From September 2013, the entitlement to 15 hours of funded early education per week was extended to 2-year-olds meeting the following eligibility criteria:
they have a parent in receipt of:
o Income Support
o Income-based Jobseeker’s Allowance (JSA)
o Income-related Employment and Support Allowance (ESA)
o Support through part 6 of the Immigration and Asylum Act
o The guaranteed element of State Pension Credit
o Child Tax Credit (but not Working Tax Credit) and have an annual income not over £16,190
o The Working Tax Credit 4-week run on (the payment you get when you stop qualifying for Working Tax Credit)
Or they are looked after by a local authority.
They have a parent in receipt of you get Working Tax Credits and earn no more than £16,190 a year
They have a current statement of special educational needs (SEN) or an education, health and care plan
They get Disability Living Allowance
They’ve been adopted from local authority care
They’ve left care under a special guardianship order, a child arrangements order or a child arrangements order which covers with whom the child lives.
More information is included in the statutory guidance for local authorities
2. Numbers benefitting by age
(Tables 1 to 4 in excel tables)One of the key statistics in this release is the actual number of children benefitting from some funded early education provision and this number expressed as a proportion of the population (take-up or participation rates).
Definition: Actual numbers benefiting from some funded early education
The number and proportion of children benefittingfrom some funded early education. This is a head count of children in receipt of some funded early education. Where they are receiving funded provision at more than one provider, they have only been counted once; it is a unique count of children.
For 3- and 4-year-olds, the eligible population used to calculate take-up rates is the ONS population estimate.
This publication also expresses the number of olds as a proportion of the ONS 2-year-old population estimate. This is not a take-up rate because not all 2-year-2-year-olds are eligible. We are consulting users to determine the most appropriate estimate of the number of eligible 2-year-olds. See section 11 for more details.
Number of 2-year-olds benefiting from funded early education.
Chart A: Numbers and participation rates of 3- and 4- year olds benefitting from funded early
education continue to rise.
Numbers and participation rates of 3- and 4-year-olds benefitting from some funded early education, 2010 to 2014 (Tables 2 to 4).
Number of 3- and 4-year-olds benefitting has increased
In January 2014, the number of 3- and 4-year-olds benefitting from some funded early education was 1,299,910 or 97% of the 3- and 4-year-old population. This is up 16,410 on the previous year (1,283,500) and the proportion of the 3- and 4-year-old population is up one percentage point. (Table 2)
Separately, the number of 3-year-olds
benefitting has increased…
The number of 3-year-olds benefitting from some funded early education was 641,230 or 94% of the 3-year-old population. This is up 15,920 from last year (625,310) and the general trend has been increasing since 2010 (585,480). The participation rate remains the same as last year (94%) but the general trend has been increasing since 2010 (91%). (Table 3)
… and the number of 4-year-olds benefitting also increased
The number of 4-year-olds benefitting from some funded early education was 658,680 or 99% of the 4-year-old population. This is up 490 from last year (658,190) and the general trend has been increasing since 2010 (600,890). The participation rate (99%) has also increased since last year (98%). (Table 4)
Why are take-up rates lower for 3-year-olds?
We know from research1 that some parents consider that their child is
too young to take up a funded place. Some parents choose to wait until their child is older; others choose to increase the number of hours per week their child attends a setting gradually as their child grows older. Lack of awareness of the different types of providers
1
Exploring the flexibility of the free entitlement – research among parents -
offering funded early education places may also be a factor affecting take up. For example some parents may not realise that they can have their funded place in a private nursery or with a child-minder.
3. Numbers benefitting by Provider type
(Tables 1 to 4 in excel tables) [image:5.595.69.534.293.461.2]There are different types of childcare available where funded hours can be used. This section gives numbers benefiting by the main provider types.
Table B: Private and voluntary providers take the greater share of 2- and 3-yearolds
Numbers benefiting by provider type January 2014.
2-year-olds
3-year-olds
4-year-olds
3- & 4-
year-olds
% % % %
Private and Voluntary Providers 96 60 18 39
Independent Schools 0 2 2 2
Maintained Nursery Schools 2 4 2 3
Nursery Classes in Primary Schools 1 32 14 23
Infant Classes in Primary Schools 0 0 63 32
State-funded Secondary Schools 0 0 1 0
Special Schools 0 0 0 0
Total 100 100 100 100
Private and voluntary providers have the greater share of 2- and 3-year-olds…
In January 2014, private and voluntary providers have the greater share of 2- and 3-year-olds (96% and 60% respectively). Maintained settings have the greater share of year-olds (79%) because the 4-year-old count includes 4-4-year-olds who started reception in September 2013 but turned 5-years-old after the 31 December 2013.
…and the proportion of 3-year-olds in private and voluntary providers has been gradually increasing since 2010
In January 2014, the proportional split of 3-year-olds in private and voluntary providers has gradually increased from 57% in 2010 to 60% in 2014, whilst maintained nursery schools and nursery classes in primary schools have decreased their share from 39% in 2010 to 37% in 2014 (Derived from table 3).
4. Take up rates by local authority
(Table 2b in excel tables)In some cases, local authority take-up rates can exceed 100%.
This can occur due to differences between how the early years census data is counted and how the population estimates are calculated. Population estimates for sub-national and individual age groups are subject to a greater degree of uncertainty than national population estimates. Therefore, take-up rates at local authority level should be treated with more caution than national take-up rates. See section 11 for further information.
For 3- and 4-year-olds…
…Calderdale, Solihull and Rutland have the highest take-up rate…
In January 2014, Calderdale (113%), Rutland (109%) and Solihull (109%) are the local authorities with the highest take-up rates of the funded entitlement.
… and Westminster, and Kensington and Chelsea have the lowest take-up rate
In January 2014, Westminster (77%), and Kensington and Chelsea (79%) are the local authorities with the lowest take-up rates of the funded entitlement.
London region has lowest take-up rates
In January 2014, take-up rates in London region are a lot lower than the national average; London has a take-up rate of 92% for 3- and 4-year-olds compared to the national value of 97%.
East Midlands and Yorkshire and the Humber have highest take up rates
In January 2014, take-up rates in East Midlands (99%) and Yorkshire and the Humber (99%) have the highest take-up rates.
The department has identified factors, other than the accuracy of sub-national ONS population estimates, which can affect take-up rates. These are:
Deprivation: Research suggests take-up from families in the most deprived quartile is very low when compared to take-up in the least deprived quartile which is much higher.
Ethnicity: Research from the Childcare and Early Years parents’ survey tells us that children of Black African, Pakistani and Bangladeshi mothers were substantially less likely to receive funded early years provision than children whose mothers were white.
Figure C: Local authorities in the London region are amongst the lowest take-up rates
5. Children in PVI providers employing staff with QTS/EYPS
qualifications
(Tables 13 to 14 in excel tables)There is a range of evidence from the UK and other countries that demonstrates the quality of staff is crucial in delivering high quality early education. Measuring the number of providers with qualified staff and the number of children in providers with qualified staff is therefore important.
The vast majority of school type settings employ qualified teachers, but this is not always the case in PVI providers. This section looks at the number of children in PVI providers who employ staff with EYPS or QTS qualifications.
Definition: QTS and EYPS
Qualified teacher status (QTS) is the accreditation that enables you to teach in state-maintained and special schools in England and Wales.
Early Years Professional Status (EYPS) is a professional accreditation endorsed by the government for graduate practitioners who have demonstrated a set of professional standards.
50% of 2-year-olds are in Private, Voluntary and Independent (PVI) providers with staff with QTS/EYPS
In January 2014, of the 2-year-old children benefitting from some funded early education at PVI providers, 41,630 (50%) did so at settings with staff with QTS/EYPS. (Table 13)
37,270 (45%) did so at settings with staff with QTS/EYPS who work
directly with 2-year-olds. (Table 13)
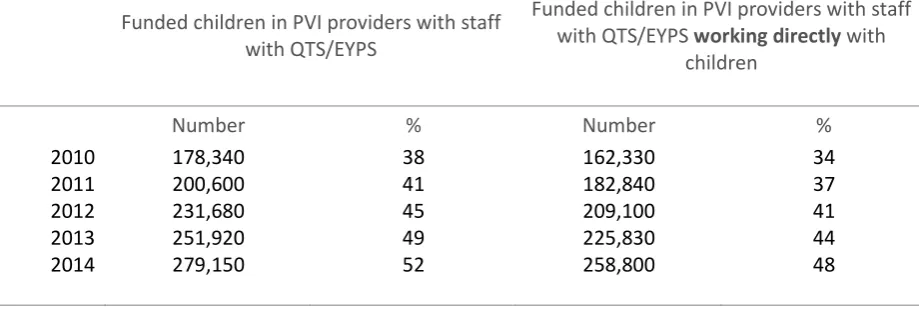
Table D: More 3- and 4-year-olds are accessing early years education delivered by qualified
staff (Table 14)
Number of 3- and 4-year-olds benefitting from PVIs with staff with QTS/EYPS, 2010 to 2014
Funded children in PVI providers with staff with QTS/EYPS
Funded children in PVI providers with staff with QTS/EYPS working directly with
children
Number % Number %
2010 178,340 38 162,330 34
2011 200,600 41 182,840 37
2012 231,680 45 209,100 41
2013 251,920 49 225,830 44
[image:8.595.69.529.613.769.2]52% of 3- and 4-year-olds are in Private, Voluntary and Independent (PVI) providers with staff with QTS/EYPS
In January 2014, of the 3- and 4-year-old children benefitting from some funded early education at PVI providers, 279,150 (52%) did so at settings with staff with QTS/EYPS. This proportion is up 3 percentage points from last year and up 14 percentage points from 2010 (38%).
258,800 (48%) did so at settings with staff with QTS/EYPS who work
directly with 3- and 4-year-olds. This proportion is up 4 percentage
points since last year (44%) and up 14 percentage points from 2010 (34%).
6. PVI providers employing staff with QTS/EYPS qualifications
(Tables 11 to 12 in excel tables)This section looks at the number of PVI providers who employ staff with EYPS or QTS. This enables the Department to monitor whether there is an increase in highly qualified staff delivering early education over time.
44% of PVIs delivering funded places for 2-year-olds have QTS/EYPS qualified staff.
In January 2014, of the PVIs delivering funded places for 2-year-olds 6,000 (44%) have QTS/EYPS qualified staff.
For 3- and 4-year-olds, the number and proportion of PVIs with QTS/EYPS qualified staff has increased
In January 2014, of the PVIs delivering funded places for 3- and 4-year-olds 10,260 (45%) have QTS/EYPS qualified staff. The proportion who have QTS/EYPS qualified staff is up 1 percentage point from 2013 (44%) and up 10 percentage points from 2010 (38%).
Not all PVIs with QTS/EYPS qualified staff have their qualified staff working directly with children so we report this separately.
40% of PVIs delivering funded places for 2-year-olds have QTS/EYPS qualified staff working directly with children.
For 3- and 4-year-olds, the number and proportion of PVIs with QTS/EYPS qualified staff working directly with children has increased
In January 2014, of the 22,764 PVIs delivering funded places for 3- and 4-year-olds 9,460 (42%) have QTS/EYPS qualified staff working
directly with 3- and 4-year-olds. This proportion is up 3 percentage
points from 2013 (39%) from 2013 and up 10 percentage points from 2010 (32%). (Table 12)
7. Numbers benefitting taking maximum hours
(Tables 7 to 8 in excel tables)Children taking up their maximum hours are children receiving 13 hours or more per week. In some cases, where there is provider capacity and sufficient parental demand, local authorities can use their flexibility to enable parents to take up their child’s early education place in patterns of hours that “stretch” their child’s 38 weeks of entitlement over more weeks of the year. Therefore, children may appear to be taking up fewer than the maximum hours during the week the census was taken.
83% of 2-year-olds are taking up their
maximum entitlement
For January 2014, 71,860 2-year-olds in all settings are taking up the maximum number of hours. This represents 83% of all 2-year-olds in all settings (Table 7a)
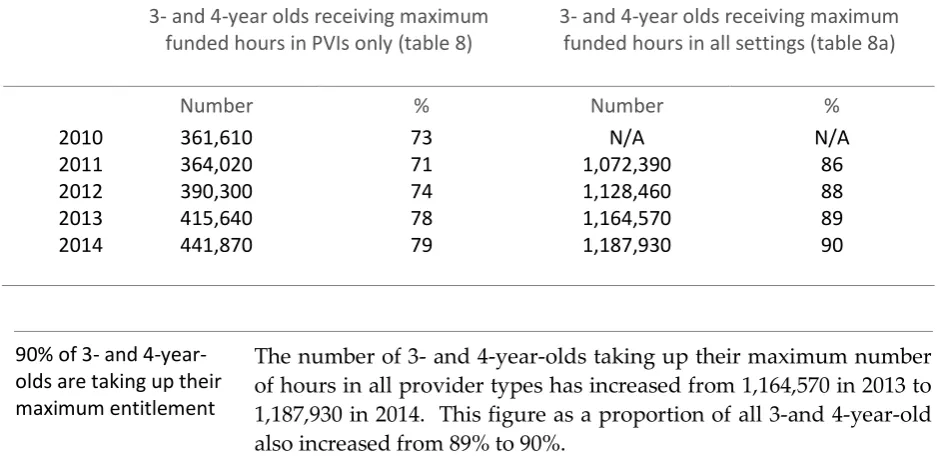
Table E: Number and proportion of 3- and 4-year-olds taking up the maximum number of
funded hours continues to increase
3- and 4-year olds receiving maximum funded hours in PVIs only (table 8)
3- and 4-year olds receiving maximum funded hours in all settings (table 8a)
Number % Number %
2010 361,610 73 N/A N/A
2011 364,020 71 1,072,390 86
2012 390,300 74 1,128,460 88
2013 415,640 78 1,164,570 89
2014 441,870 79 1,187,930 90
90% of 3- and 4-year-olds are taking up their maximum entitlement
[image:10.595.65.534.501.737.2]8. Numbers benefitting by Ofsted inspection rating
(Tables 15 and 15a in excel tables)Matching Ofsted inspections data to the Early Years and School Census, enables local authorities to see whether they are getting value for money and monitor the quality of early years settings receiving government funding to deliver early education places over time.
85% of 2-year-olds in good or outstanding settings
In January 2014, excluding those providers not yet inspected or where there was no match to Ofsted, the number of 2-year-olds benefitting from some funded early education at a setting with an Ofsted rating of good or outstanding were 61,870 or 85% of the total number of children benefitting.
1,470 (2%) of children attended settings that had an Ofsted rating of inadequate. (Table 15)
84% of 3- and 4-year-olds in good or outstanding settings
In January 2014, excluding those providers not yet inspected or where there was no match to Ofsted, the number of 3- and 4-year-olds benefitting from some funded early education at a setting with an Ofsted rating of good or outstanding were 988,980 or 84% of the total number of children benefitting. This is up 4 percentage points on last year (80%).
23,510 (2%) of children attended settings that had an Ofsted rating of inadequate. This is the same as last year. (Table 15a)
9. Part-time equivalent places filled
(Tables 5 to 6 in excel tables)Definition: Part-time equivalent places (PTE)
This is the number of complete 15 hour places filled (for example: a child taking 7 hours entitlement and different child taking 8 hours entitlement would equate to 1 part-time equivalent place filled)
They are called part time equivalent so as not to be confused with the compulsory school age full time equivalent which is 25 hours.
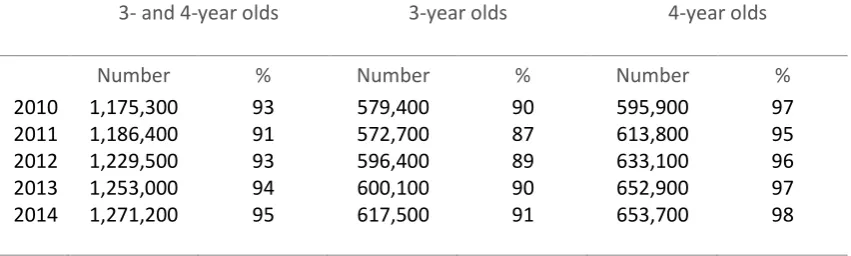
Table F: Part time equivalent places have increased for 3- and 4-year-olds
Part-time equivalent number of funded early education places taken up, 2010 to 2014 (Table 6)
3- and 4-year olds 3-year olds 4-year olds
Number % Number % Number %
2010 1,175,300 93 579,400 90 595,900 97
2011 1,186,400 91 572,700 87 613,800 95
2012 1,229,500 93 596,400 89 633,100 96
2013 1,253,000 94 600,100 90 652,900 97
2014 1,271,200 95 617,500 91 653,700 98
3- and 4-year-old PTEs have increased…
In January 2014, the part-time equivalent number of funded early education places taken up by 3- and 4-year-olds was 1,271,200, or 95% of 3- and 4-year-old children. The proportion is up from last year when the figure was 94%.
…for 3-year-olds… In January 2014, the part-time equivalent number of funded early education places taken up by year-olds was 617,500 or 91% of 3-year-old children. The proportion is up 1 percentage point from last year.
..and 4-year-olds In January 2014, the part-time equivalent number of funded early education places taken up by year-olds was 653,700, or 98% of 4-year-old children. This is up 1 percentage point from last year.
Figures for January 2010 are not directly comparable with 2011 onwards because January 2010 was during a transitional year when funded entitlement increased from 12.5 hours to 15 hours per week. By January 2010, around 25% of children were entitled to 15 hours per week. The January 2010 PTE figure was calculated on a 12.5 hours per week basis, so the 2010 figure is somewhat inflated because of this. This change in policy could be wholly or partly responsible for the change in the PTE as a proportion of the population figure.
11. Number of children in early education places (both funded and
non-funded)
(Tables 1 to 4 in excel tables)Definition: Early education places
[image:13.595.78.533.304.436.2]This section gives the total number of places funded and non-funded across all provider types including schools. This counts the number of places, so there will be some double counting e.g. a child using two different providers will be counted twice.
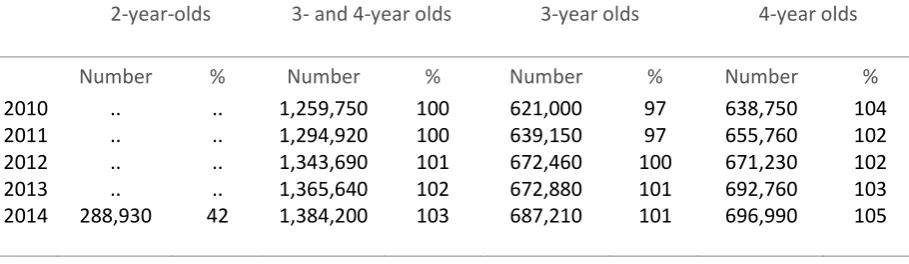
Table G: Number of early education places taken up has increased
Numbers taking up early education places and as percentage of population, 2010-2014
2-year-olds 3- and 4-year olds 3-year olds 4-year olds
Number % Number % Number % Number %
2010 .. .. 1,259,750 100 621,000 97 638,750 104
2011 .. .. 1,294,920 100 639,150 97 655,760 102
2012 .. .. 1,343,690 101 672,460 100 671,230 102
2013 .. .. 1,365,640 102 672,880 101 692,760 103
2014 288,930 42 1,384,200 103 687,210 101 696,990 105
The number of places as a proportion of ONS population estimates can exceed 100% because this counts the number of places so a child using two different providers will be counted twice. Therefore, an increase in both the number and the percentage of population could be caused by more children taking up places, or by an increase in the number of children using more than one provider.
There are 288,930 2-year-olds in early education places…
In January 2014, the number of children taking up funded and non-funded early education places was 288,930 or 42% of the 2-year-old population. (Table 1)
… and 1,384,200 3-and 4-year-olds in early education places…
In January 2014, the number of early education places taken up by 3-and 4-year-olds was 1,384,200 or 103% of the 3-3-and 4-year-old population. This is up 1 percentage point from last year and 3 percentage points from 5 years ago. (Table 2)
… or 687,210 3-year-olds and 696,990 4-year-olds in early education place
10. List of tables
The following tables are available in excel format on the Department’s statistics website:
Childcare and Early Years Statistics.
Numbers Benefitting from Funded EY Education 1 Number of 2-year-old children taking up or benefitting from funded early education places by type of provider
1a Number of 2-year-olds taking up or benefitting from funded early education places by type of provider and local authority
2 Number of 3- and 4-year-old children taking up or benefitting from funded early education places by type of provider
2a Number of 3- and 4-year-olds taking up or benefitting from funded early education places by type of provider and local authority
2b Percentage of 3- and 4-year-old children benefitting from funded early education places by local authority
3 Number of 3-year-old children taking up or benefitting from funded early education places by type of provider
3a Number of 3-year-olds taking up or benefitting from funded early education places by type of provider and local authority
4 Number of 4-year-old children taking up or benefitting from funded early education places by type of provider
4a Number of 4-year-olds taking up or benefitting from funded early education places by type of provider and local authority
Part Time Equivalent
5 Part time equivalent number of funded early education places filled by 2-year-olds by type of provider
5a Part time equivalent number of funded early education places filled by 2-year-olds by type of provider and local authority 6 Part time equivalent number of funded
early education places filled by 3- and 4-year-olds by type of provider and age
6a Part time equivalent number of funded early education places filled by 3- and 4-year-olds by type of provider and local authority
6b Part time equivalent number of funded early education places filled by 3-year-olds by type of provider and local authority 6c Part time equivalent number of funded
early education places filled by 4-year-olds by type of provider and local authority
Funded Hours
7 Number of 2-year-olds in funded early education in private, voluntary and independent providers by banded number of funded hours and local authority
7a Number of 2-year-olds in funded early education in private, voluntary and independent providers, and in maintained nursery, primary, secondary and special schools by banded number of funded hours and local authority
8 Number of 3- and 4-year-olds in funded early education in private, voluntary and independent providers, by banded number of funded hours and local authority
8a Number of 3- and 4-year-olds in funded early education, in private, voluntary and independent providers, and in maintained nursery, primary, secondary and special schools by banded number of funded hours and local authority
PVI Provider Types
9 Number of 2-year-olds in funded early education, in private, voluntary and independent providers, and in maintained nursery, primary, secondary and special schools by type of provider
10 Number of providers delivering funded early education to 2-year-olds by type of provider and local authority
10a Number of providers delivering funded early education to 3- and 4-year-olds by type of provider and local authority
PVI Provider Staff Qualifications
11 Number and percentage of private, voluntary and independent providers with staff with QTS/EYPS and with staff with QTS/EYPS working directly with 2-year-olds, by category of provider
11a Number and percentage of private, voluntary and independent providers with staff with QTS/EYPS and with staff with QTS/EYPS who work directly with 2-year-olds, by category of provider and local authority
12 Number and percentage of private, voluntary and independent providers with staff with QTS/EYPS and providers with staff with QTS/EYPS working directly with 3- and 4-year-olds, by category of provider
12a Number and percentage of private, voluntary and independent providers with staff with QTS/EYPS and with staff with QTS/EYPS who work directly with 3- and 4-year-olds, by category of provider and local authority
13 Number and percentage of 2-year-old children benefitting from funded early education at private, voluntary and independent providers with staff with QTS/EYPS and at settings with staff with QTS/EYPS working directly with 2-year-olds, by category of provider
13a Number and percentage of 2-year-old children benefitting from funded early education at private, voluntary and independent providers with staff with QTS/EYPS and at settings with staff with
QTS/EYPS working directly with 2-year-olds, by category of provider and local authority 14 Number and percentage of 3- and
4-year-old children benefitting from funded early education at private, voluntary and independent providers with staff with QTS1/EYPS and at settings with staff with QTS/EYPS working directly with 3- and 4-year-olds, by category of provider
14a Number and percentage of 3- and 4-year-old children benefitting from funded early education at private, voluntary and independent providers with staff with QTS/EYPS and at settings with staff with QTS/EYPS working directly with 3- and 4-year-olds, by category of provider and local authority
OFSTED Inspection Ratings
15 Actual number and percentage of 2-year-old children benefitting from funded early education in private, voluntary and independent providers, and in maintained nursery, primary, secondary and special schools, by Ofsted inspection rating and local authority
15a Actual number and percentage of 3- and 4-year-old children benefitting from funded early education in private, voluntary and independent providers, and in maintained nursery, primary, secondary and special schools, by Ofsted inspection rating and local authority
2-year-old Basis for Funding
16 The basis on which a 2-year-old has been funded for an early education place.
10. List of tables
(cont.)
When reviewing the tables, please note the following:
We preserve confidentiality
The Code of Practice for Official Statistics requires we take reasonable steps to ensure that our published or disseminated statistics protect confidentiality.
So we round numbers We suppress cell counts and totals below 3. Because of this rounding, totals in text and in tables may not always equal the sum of their component parts. Similarly, differences quoted in text may not always be the same as differences shown in tables. This suppression is consistent with the Departmental statistical policy.
And adopt symbols to help identify this
Symbols are used in the tables as follows: ‘x’ – below 3 (i.e. 1 or 2)
‘0’ – the original figure submitted was zero
‘..’ – data not available
‘-‘ – represents less than 0.5%
11. Background on the data
Overview of the data collection and the data validation process
The source for this publication is the Early Years Census and School Census. All schools and all Private, Voluntary, and Independent (PVI) providers receiving government funding are required to make (through their local authority) a child-level return. These collections are on a statutory basis through legislation which helps ensure complete and accurate information being returned.
Guidance on the census is available on gov.uk. The technical specifications explain what data are collected and what validation is in place and includes the business rationale for the collection.
Notes on specific data quality issues
The policy on funded 2-year-olds is still bedding in
eligibility criteria to be introduced nationally in September 2014. We are not able to determine from the census returns how many children this may cover.
We don’t have robust estimates of the eligible population for 2-year-olds
We are not aware of any reliable data source that could tell us the whole number of eligible 2-year-olds. From 2015 we propose to provide take-up rates as a percentage of the local eligible population. We propose using data from the Department for Work and Pensions’ (DWP) to estimate of the number of 2-year-olds living in households claiming the relevant benefits. We would welcome user’s views on whether or not this is an appropriate estimate or if there are other data sources we should consider.
Some LAs could not confirm the reasons for funding their 2-year-olds in schools
Lewisham, Barnet, Redbridge, Sunderland, North Yorkshire, and Nottingham local authorities did not confirm if their funded 2-year-olds were funded on the basis of low income, high levels of SEN, or looked after. For these 290 children we have assumed they meet at least one of the criteria and categorised them as “Reason not Declared” in table 16.
Not all 2-,3- and 4-year-olds in early education are covered
Only those providers with children receiving some funded early education are required to make an Early Years Census return. For this reason, the Early Years census and therefore the Provision for Children publication does not provide a count of all children aged 2, 3 or 4 in Private, Voluntary, and Independent providers. There is no data source which would provide this information.
3- and 4-year-old ONS population estimates are only an estimate
The population estimates are derived from mid-year estimates and projections provided by the Office for National Statistics. They are subject to a margin of error and should be considered to be approximations and are not directly comparable to the early years census data. (Visit the ONS website for more information and population estimates).
… and these estimates only include long-term migrants
That is, a person who changes their permanent residence for more than a year. The early years census includes all children, even if they are defined as being short-term migrants. Therefore take up percentages could be overestimated as a result.
… and are revised following a national census
… and sub-national population estimates are subject to a greater degree of error
Population estimates at lower geographic levels, such as local authority, are subject to a greater degree of error. In some cases, local authority take-up rates can exceed 100%. Therefore, take-up rates at local authority level should be treated with more caution than national take-up rates. The sources used in the calculation of take-up rates for 3- and 4-year-olds are consistent over time; allowing users to see any change in local authority level take-up rates over time.
What the data is used for?
We are familiar with the use of these statistics within the Department for Education and by the UK Government. These uses include:
Funding The data is a crucial evidence base for many funding calculations including the Dedicated Schools Grant.
Producing cost estimates
It is also used to estimate the costs of new policies; including the early years pupil premium
Policy development The data is also used to monitor and develop departmental policies and plans, including underpinning projections of future demand for places.
Parents and local authorities
Parents may use this information when assessing the quality of provision in their area and enable local authorities to measure their performance against similar authorities.
However, we are less familiar with the use of these statistics made by other organisations and external parties. We have carried out external consultation through our Research and Statistics website and through our user group of known contacts to try and ascertain users of these statistics and to try and better understand how the statistics are being used. Based on the responses received we are aware of the following users and uses made of these statistics:
Students and lecturers in the Early Childhood Studies field to keep abreast of changes and challenges in Early Years policy and practices and to support coursework.
The Scottish Government to make UK-wide comparisons.
The London School of Economics for various analyses on the early education sector.
Department for Work and Pensions for numbers of children in early education.
Previous consultations have been carried out seeking comments on the format and contents of the publication. The general nature of the response was that the statistics were useful in their current format and no strong suggestions were received as to improvements or additions to the statistics.
We will continue to engage with users to ensure that the publication best meets their needs and welcome feedback or suggestions from any new or previously unknown users which we will take on board.
National Statistics
The United Kingdom Statistics Authority has designated these statistics as National Statistics, in accordance with the Statistics and Registration Service Act 2007, signifying compliance with the Code of Practice for Official Statistics.
Designation can be broadly interpreted to mean that the statistics:
meet identified user needs;
are well explained and readily accessible;
are produced according to sound methods; and
are managed impartially and objectively in the public interest.
Once statistics have been designated as National Statistics it is a statutory requirement that the Code of Practice shall continue to be observed.
12. Want more information?
Want previously published figures?
It’s still available via SFR links. For the latest data, visit Childcare and Early Years Statistics
Want statistics for Wales?
This publication only covers England. For information for Wales, Scotland and Northern Ireland, contact the departments below or access their statistics at the following links:
Wales: The ‘Care and Social Services Inspectorate Wales’ published information on numbers of regulated settings and related activity, including children's day care (under 8s provision or early years) as part of their 2011-12 Annual Report which is available at:
Want statistics for Scotland?
Scotland: A Pre-School Education Census is carried out annually to monitor the number of pre-school education providers, the number of children receiving pre-school education and the number of
staff/teachers. The latest publication (from the September 2012 census) can be found at:
Summary Statistics for Schools in Scotland, No.4 : 2013 Edition
Want statistics for Northern Ireland?
Northern Ireland: Statistics detailed in 'Children Social Care Statistical Tables for Northern Ireland 2011/12' were published on 26th October 2012 is available at:
Children Order Statistics for Northern Ireland
Early education statutory guidance for local authorities
This statutory guidance from the Department for Education is for English local authorities on their duties under sections 6, 7, 11 and 13 of the Childcare Act 2006.
Statutory guidance for local authorities
Early years census collection guidance
Information for preparing and completing the annual early years census, including the scope of the return, technical specifications and what data needs to be submitted to the Department for Education by local authorities.
Early years census collection guidance
School census collection guidance
Information for preparing and completing the school census, including the scope of the return, technical specifications and what data needs to be submitted to the Department for Education.
13. Got a query? Like to give feedback?
We would like to know more about our users and would encourage and welcome any feedback on how the data is used. Comments on any issues relating to this publication are also welcomed and encouraged. If you would like to be involved in future user engagement consultations then please do get in touch. Any enquiries should be addressed to the following:
If from the media Press Office News Desk, Department for Education, Sanctuary Buildings, Great Smith Street, London SW1P 3BT. 020 7925 6789
If non-media Adam Whitaker
© Crown copyright 2014
You may re-use this information (excluding logos) free of charge in any format or medium, under the terms of the Open Government Licence. To view this licence, visit Open Government Licence or e-mail:
Where we have identified any third party copyright information you will need to obtain permission from the copyright holders concerned.
Any enquiries regarding this publication should be sent to us at Press Office News Desk, Department for Education, Sanctuary Buildings, Great Smith Street, London SW1P 3BT.