SFR 06/2014
Childcare and early
years survey of
parents 2012-2013
January 2014
Contents
Executive summary ... 12
Key findings ... 12
Methodology ... 14
Use of childcare and early years provision ... 15
Packages of childcare for pre-school children ... 16
Packages of childcare for school-age children ... 17
Paying for childcare ... 18
Factors affecting decisions about childcare ... 19
Parents’ views of their childcare and early years provision ... 20
Use of childcare during school holidays ... 21
Mothers, childcare and work ... 23
1 Introduction ... 25
1.1 Aims of the study ... 25
1.2 Policy background ... 25
1.3 Times series of the Childcare and Early Years Survey of Parents ... 28
1.4 Overview of the study design ... 29
1.5 The report ... 32
1.6 Acknowledgements ... 35
2 Use of childcare and early years provision ... 36
2.1 Introduction ... 36
2.2 Use of childcare: trends over time ... 36
2.3 National estimates of the use of childcare ... 39
2.4 Use of childcare, by children’s age, ethnicity and SEN ... 39
2.5 Use of childcare by families’ circumstance ... 44
2.6 Use of childcare by area characteristics ... 48
2.7 Key characteristics associated with the use of childcare ... 51
2.8 Hours of childcare used ... 53
2.9 Take-up of the entitlement to government funded early education by 3- to 4-year-old children ... 59
2.10 Summary ... 65
3 Packages of childcare for pre-school children ... 68
3.1 Introduction ... 68
3.2 Use of childcare packages by age of pre-school child ... 70
3.3 Number of providers used for pre-school children ... 71
3.4 Patterns of childcare use for pre-school children ... 72
3.5 Use of childcare packages for pre-school children at the family level ... 78
3.6 Reasons for using childcare providers for pre-school children ... 79
3.7 Summary ... 82
4 Packages of childcare for school-age children ... 84
4.1 Introduction ... 84
4.2 Use of childcare by age of school-age children ... 85
4.3 Number of providers used for school-age children ... 86
4.4 Patterns of childcare use for school-age children ... 87
4.5 Use of childcare packages for school-age children at family level ... 90
4.6 Reasons for using childcare providers for school-age children ... 92
4.7 Summary ... 95
5 Paying for childcare ... 97
5.1 Introduction ... 97
5.2 Family payments for childcare ... 97
5.4 How many families reported receiving tax credits? ... 113
5.5 How much tax credit were families receiving? ... 114
5.6 Difficulties with childcare costs ... 115
5.7 Summary ... 117
6 Factors affecting decisions about childcare ... 119
6.1 Introduction ... 119
6.2 Access to information about childcare ... 119
6.3 Perceptions of provision in the local area ... 126
6.4 Demand for childcare outside of school hours ... 133
6.5 Reasons for not using any childcare in the last year ... 135
6.6 Reasons for not using nursery education for children aged 0 to 2 years ... 138
6.7 Parents of disabled children ... 139
6.8 Perceptions of flexibility ... 142
6.9 Summary ... 150
7 Parents’ views of their childcare and early years provision ... 152
7.1 Introduction ... 152
7.2 Reasons for choosing formal childcare providers ... 153
7.3 Parents’ views on the skills encouraged by their main formal provider ... 159
7.4 Parents’ views on the feedback their provider offers ... 164
7.5 Home learning activities for children aged 2 to 5 ... 168
7.6 Early Years Foundation Stage (EYFS) ... 176
7.7 Other services available at childcare providers ... 181
7.8 Summary ... 184
8 Use of childcare during school holidays ... 186
8.1 Introduction ... 186
8.2 Families’ use of childcare during school holidays ... 186
8.3 Type of childcare during school holidays ... 189
8.4 Reasons for using holiday childcare ... 196
8.5 Paying for holiday childcare ... 199
8.6 Availability of holiday childcare ... 201
8.7 Parents’ views of childcare used during school holidays ... 205
8.8 Families who did not use holiday childcare ... 208
8.9 Summary ... 209
9 Mothers, childcare and work ... 212
9.1 Introduction ... 212
9.2 Overview of work patterns ... 212
9.3 Transition into work ... 218
9.4 Transition from part-time to full-time work ... 219
9.5 Influences on mothers’ decisions to go out to work ... 220
9.6 Ideal working arrangements ... 231
9.7 Mothers and self-employment ... 233
9.8 Mothers who study ... 233
9.9 Mothers who were not in paid employment ... 234
9.10 Summary ... 237
References ... 239
Appendix A Socio-demographic profile ... 240
Appendix B Technical Appendix ... 249
B.1 Background and history ... 249
B.2 Questionnaire development ... 249
B.3 Sampling ... 252
B.4 Contacting respondents ... 254
B.6 The interview... 255
B.7 Fieldwork response rates ... 255
B.8 Coding and editing of data ... 257
B.9 Analysis and significance testing ... 257
B.10Provider checks ... 257
B.11Weighting ... 260
B.12Socio-economic classification ... 265
Table 2.1:Use of childcare providers, 2011-2012 ... 38
Table 2.2: National estimates of use of childcare ... 39
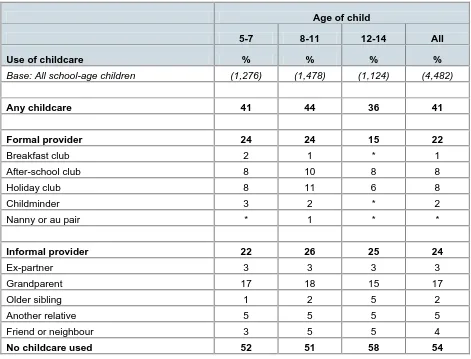
Table 2.3: Use of childcare providers, by age of child ... 41
Table 2.4: Use of childcare, by child characteristics ... 43
Table 2.5: Use of childcare, by family annual income ... 47
Table 2.6: Use of childcare, by region ... 49
Table 2.7: Use of childcare, by rurality ... 51
Table 2.8: Hours of childcare used per week, by age of child ... 54
Table 2.9: Hours of childcare used per week, by provider type ... 55
Table 2.10: Receipt of the entitlement to government funded early education, by age of child ... 60
Table 2.11: Receipt of the entitlement to government funded early education, by family type and work status ... 61
Table 2.12: Reasons for receiving less than 15 government funded hours, by age of child ... 63
Table 2.13: Number of days per week over which 3- to 4-year-olds received their entitlement to government funded early education, by age of child ... 64
Table 2.14: Use of childcare providers for 3- to 4-year-olds receiving their entitlement to government funded early education, by age of child ... 65
Table 3.1: Use of childcare packages for pre-school children, by age of child ... 70
Table 3.2: Number of providers, by age of child ... 71
Table 3.3: Number of providers, by package of childcare ... 72
Table 3.4: Patterns of childcare use, by age of child ... 73
Table 3.5: Patterns of childcare use, by package of childcare ... 74
Table 3.6: Patterns of childcare use, by family type and work status ... 75
Table 3.7: Patterns of childcare use of 0- to 2-year-olds and 3- to 4-year-olds by family type and work status ... 76
Table 3.8: Patterns of childcare use by family annual income and number of children .... 77
Table 3.9: Reasons for using childcare providers, by package of childcare... 81
Table 3.10: Patterns of childcare use, by reasons for using childcare providers ... 82
Table 4.1: Use of childcare packages for school-age children, by age of child ... 86
Table 4.2: Number of providers, by age of child ... 87
Table 4.3: Number of providers, by package of childcare ... 87
Table 4.4: Patterns of childcare use, by age of child ... 88
Table 4.5: Patterns of childcare use, by package of childcare ... 90
Table 4.6: Reasons for using childcare providers, by package of childcare... 94
Table 4.7: Patterns of childcare use, by reasons for using childcare providers ... 95
Table 5.1: Family payment for childcare, by provider type ... 99
Table 5.2: Services paid for, by type of provider paid ... 101
Table 5.3: Weekly payment for childcare, by provider type ... 104
Table 5.4: Amount family paid per hour, by provider type ... 106
Table 5.5: Financial help from others, by family characteristics ... 111
Table 5.6: Employer assistance with childcare costs ... 113
Table 5.7: Receipt of Child Tax Credit and Working Tax Credit, 2004-2012 ... 114
Table 5.8: Working families’ receipt of Working Tax Credit ... 114
Table 6.1: Sources of information about childcare used in last year, by childcare use .. 121
Table 6.2: Helpfulness of main childcare information sources ... 122
Table 6.3: Level of information about childcare in local area, 2004-2012 ... 125
Table 6.4: Parents’ reasons for not using before/ after-school clubs ... 134
Table 6.6: Availability of informal childcare ... 137 Table 6.7: Changes that would facilitate formal childcare use ... 138 Table 6.8: Reasons for not using nursery education for children aged 0 to 2, by family type and work status ... 139 Table 6.9: Reasons for not using nursery education for children aged 0 to 2, by childcare use ... 139 Table 6.10: Views on available provision for children with an illness/ disability ... 141 Table 6.11: Parents’ views on training for childcare for children with illness/ disability .. 142 Table 6.12: The extent to which parents’ perceive their childcare arrangements as flexible ... 143 Table 6.13: Times where parents would like childcare provision improving in order to meet their needs ... 145 Table 6.14: Changes to childcare provision that would make it better suited to parents’ needs ... 147 Table 6.15: Types of formal childcare provision that parents wanted to use/ use more of ... 149 Table 7.1 Reasons for choosing main formal provider for pre-school children, by age of child ... 154 Table 7.2: Reasons for choosing main formal provider for pre-school children by provider type ... 155 Table 7.3: Reasons for choosing main formal provider for pre-school children, by family type and work status ... 156 Table 7.4: Reasons for choosing formal provider for school-age children, by age of child ... 157 Table 7.5: Reasons for choosing main formal provider for school-age children, by
provider type ... 158 Table 7.6: Reasons for choosing main formal provider for school-age children, by family type and work status ... 159 Table 7.7: Academic skills encouraged at main provider for pre-school children, by
provider type [1] ... 160 Table 7.8: How often children brought home books from provider to look at/ read with their parent ... 161 Table 7.9: How often children brought home books from provider to look at/ read with their parent, by provider type ... 161 Table 7.10: Social skills that parents believed were encouraged at their main formal provider, by age of child ... 162 Table 7.11: Social skills encouraged at main provider for pre-school children, by provider type[1] ... 163 Table 7.12: Social skills encouraged at main provider for school-aged children, by
Table 7.19: Factors which would increase time spent on learning and play activities, by
family type and work status ... 172
Table 7.20: Sources of information/ideas used about learning and play activities ... 174
Table 7.21: People/organisations contacted about child’s learning and development ... 176
Table 7.22: Level of knowledge about the Early Years Foundation Stage ... 177
Table 7.23: Whether formal childcare provider has spoken to parent or provided them with information about the Early Years Foundation Stage ... 177
Table 7.24: To what extent attending a formal childcare provider helped the child with the following skills, by provider type ... 180
Table 7.25: Volume of information received from formal provider about child’s learning and development ... 181
Table 7.26: Additional services available to parents at their main formal provider, by provider type ... 182
Table 7.27: Additional services used by parents at their main formal provider, by provider type ... 183
Table 7.28: Additional services parents would like to use at their main formal provider (if not currently available), by provider type ... 184
Table 8.1: Use of childcare during school holidays, 2008-2012 ... 187
Table 8.2: Use of childcare during school holidays, by respondent work status ... 187
Table 8.3: Use of childcare during school holidays compared with use of childcare during term time ... 188
Table 8.4: Use of childcare in term time and school holidays ... 190
Table 8.5: Use of holiday childcare providers, by age of child ... 191
Table 8.6: Use of holiday childcare, by child characteristics ... 192
Table 8.7: Use of childcare during school holidays by family characteristics ... 193
Table 8.8: Use of childcare during school holidays, by area characteristics ... 195
Table 8.9: Parents' reasons for using formal providers of holiday childcare, by provider type ... 197
Table 8.10: Parents’ reasons for using informal providers of holiday childcare, by provider type ... 198
Table 8.11: Whether payment made for holiday childcare, by provider type ... 199
Table 8.12: Relative use and payment of holiday childcare, by provider type ... 200
Table 8.13: Amount paid for holiday childcare per day, by provider type ... 200
Table 8.14: Hours of holiday childcare used per day, by provider type ... 201
Table 8.15: Reasons for difficulties with arranging holiday childcare ... 203
Table 8.16: Reasons for difficulties with arranging holiday childcare, by rurality ... 203
Table 8.17: Formal provider available for enough time during school holiday, by provider type ... 204
Table 8.18: Views of parents about childcare during school holidays, by use of holiday childcare ... 206
Table 8.19: Views of working parents on holiday childcare hours, by use of holiday childcare ... 207
Table 8.20: Reasons for not using holiday childcare ... 209
Table 9.1: Maternal employment, by family type ... 213
Table 9.2: Atypical working hours, by family type ... 215
Table 9.3: Atypical working hours, by mothers’ work status ... 215
Table 9.4: Family employment, by family type ... 217
Table 9.5: Atypical working hours, by family type ... 218
Table 9.6: Influences for entering paid work, by family type ... 219
Table 9.7: Reasons for moving from part-time to full-time work, by family type ... 220
Table 9.9: Influences on mothers’ decisions to go out to work, by family type ... 224
Table 9.10: Influences on mothers’ decisions to go out to work, by mothers’ highest qualification ... 226
Table 9.11: Influences on mothers’ decisions to go out to work, by mothers’ socio-economic classification ... 230
Table 9.12: Views on ideal working arrangements, by family type ... 232
Table 9.13: Childcare arrangements that help mothers to study, by family type ... 234
Table 9.14: Reasons for not working, by family type ... 236
Appendices tables:
Table A.1: Age of respondent, by family type ... 240Table A.2: Marital status ... 241
Table A.3: Qualifications, by family type ... 241
Table A.4: Number of children in the household, by family type ... 242
Table A.5: Number of pre-school and school-age children in the family, by family type 242 Table A.6: Family annual income by family type ... 243
Table A.7: Family work status ... 243
Table A.8: Tenure status, by family type ... 244
Table A.9: Age of selected child, by family type ... 245
Table A.10: Ethnicity of selected child, by family type ... 246
Table A.11: Special educational needs or disabilities of selected child, by family type .. 247
Table A.12: Region ... 247
Table A.13: Area deprivation according to the Index of Multiple Deprivation ... 248
Table A.14: Rurality ... 248
Table B.1: Survey response figures ... 256
Table B.2: Fieldwork response figures ... 256
Table B.3: Classification of providers before and after provider checks ... 259
Table B.4: Classification of providers before and after provider checks. Parents’ classifications (bold) and final classifications (not bold) ... 260
Table B.5: Comparison of recipient-level population figures to weighted sample ... 263
Table B.6: Comparison of child-level population figures to weighted sample ... 263
Table B.7: Effective sample size and weighting efficiency ... 265
Table B.8: Confidence intervals for key estimates ... 265
Table C2.1: Use of childcare, by family characteristics ... 267
Table C2.2: Use of childcare providers by two-year-olds, 2011-2012 ... 268
Table C2.3: Use of childcare, by family type and work status, 2011-2012 ... 269
Table C2.4: Use of childcare, by disability of selected child ... 269
Table C2.5: Use of childcare, by family socio-economic classification and detailed family work status ... 270
Table C2.6: Use of childcare providers, by family type and work status ... 271
Table C2.7: Use of childcare, by area deprivation ... 271
Table C2.8: Use of childcare, by area deprivation, 2011-2012 ... 272
Table C2.9: Logistic regression models for use of formal childcare ... 273
Table C2.10: Logistic regression models for use of informal childcare ... 274
Table C2.11: Hours of childcare used per week, by provider type and age ... 275
Table C2.12: Hours of any childcare used per week, by detailed family work status ... 275
Table C2.13: Hours of formal childcare used per week, by detailed family working status ... 276
Table C2.14: Hours of informal childcare used per week, by detailed family working status ... 276
Table C2.16: Number of government funded hours per week, by age of child ... 278
Table C2.17: Logistic regression models for hours of formal childcare used ... 279
Table C2.18: Logistic regression models for hours of informal childcare used ... 280
Table C2.19: Whether parents satisfied with the number of government funded hours, by age of child ... 281
Table C3.1: Number of providers, by specific centre-based provider types ... 281
Table C3.2: Number of providers, by informal provider types ... 281
Table C3.3: Patterns of childcare use, by age of child and package of childcare ... 282
Table C3.4: Hours of centre-based childcare received, by specific centre-based provider types ... 282
Table C3.5: Hours of informal childcare received, by informal provider types ... 282
Table C3.6: Whether pre-school children attended more than one provider on the same day, by age of child ... 283
Table C3.7: Childcare packages for families with pre-school children only, by number of children ... 283
Table C3.8: Reason combinations given for using childcare providers, by age of child . 283 Table C3.9: Reasons for using childcare providers, by age of child ... 284
Table C3.10: Reasons for using centre-based providers, by specific centre-based provider types ... 284
Table C4.1: Use of childcare providers, by age of child and package of childcare ... 284
Table C4.2: Use of childcare providers, by age of child and package of childcare ... 285
Table C4.3: Hours of informal childcare received, by specific informal provider types .. 286
Table C4.4: Reason combinations given for using childcare providers, by age of child . 286 Table C4.5: Childcare packages for families with school-age children only, by number of children ... 286
Table C4.6: Childcare packages for families with pre-school and school-age children, by number of children ... 287
Table C4.7: Reasons for using childcare providers, by age of child 2011-2012 ... 288
Table C4.8: Reasons for using informal providers, by specific informal provider type ... 289
Table C5.1: Weekly payment for childcare, by service paid for ... 289
Table C5.2: Weekly payment for childcare, by family characteristics ... 290
Table C5.3: Weekly payment for childcare, by area characteristics ... 291
Table C5.4: Difficulty paying for childcare, by family characteristics ... 292
Table C5.5: Difficulty paying for childcare, by weekly family payment (quintiles) ... 293
Table C6.1: Main information sources, by family characteristics ... 294
Table C6.2: Main information sources, by family characteristics ... 295
Table C6.3: Awareness and use of Family Information Services, 2004-2012 ... 296
Table C6.4: Level of information about childcare, by family characteristics ... 297
Table C6.5: Logistic regression model for amount of information about local childcare 299 Table C6.6: Logistic regression model for having a view on the availability of formal childcare places ... 301
Table C6.7: Logistic regression model for availability of formal childcare places ... 303
Table C6.8: Logistic regression model for quality of local childcare ... 305
Table C6.9: Logistic regression model for affordability of local childcare ... 307
Table C6.10: Perceptions of availability of local childcare places, 2004-2012 ... 307
Table C6.11: Perceptions of local childcare availability, by family characteristics ... 308
Table C6.12: Perceptions of local childcare availability, by area characteristics ... 309
Table C6.13: Perceptions of local childcare quality, 2004-2012 ... 309
Table C6.14: Perceptions of local childcare quality, by family characteristics ... 310
Table C6.15: Perceptions of local childcare quality, by area characteristics ... 311
Table C6.16: Perceptions of local childcare affordability, 2004-2012 ... 311
Table C6.18: Perceptions of local childcare affordability, by family characteristics ... 313 Table C6.19: Logistic regression model for flexibility of local childcare ... 315 Table C6.20: Perceptions of local childcare affordability, by area characteristics ... 315 Table C6.21: Extent to which parents have problems finding childcare that is flexible enough to meet their needs, by family annual income and working arrangements ... 316 Table C6.22: Extent to which parents have problems finding childcare that is flexible enough to meet their needs, by region and rurality ... 317 Table C6.23: The extent to which parents are able to find term time childcare that fits in with their or their partner’s working hours, by family annual income and working
arrangements ... 318 Table C6.24: Extent to which parents are able to find term time childcare that fits in with their or their partner’s working hours, by region and rurality ... 319 Table C6.25: Times where parents would like childcare provision improving in order to meet their needs, by area characteristics ... 320 Table C6.26: Changes to childcare provision that would make it better suited to parents’ needs, by Region ... 321 Table C6.27: Changes to childcare provision that would make it better suited to parents’ needs, by rurality ... 322 Table C6.28: Types of formal childcare provision that parents would like to use/use more of, by Region ... 323 Table C6.29: Types of formal childcare provision that parents would like to use/use more of, by rurality ... 324 Table C7.1: How often providers give parents information about the activities their
children have taken part in, by age of child ... 325 Table C7.2: Factors which parents believe would increase time spent on learning and play activities, by area deprivation ... 325 Table C7.3: Sources of information/ideas used about learning and play activities, by area deprivation ... 326 Table C7.4: People/organisations contacted about child’s learning and development, by area deprivation ... 327 Table C8.1: Parents’ reasons for using holiday childcare, by type of holiday childcare used ... 327 Table C8.2: Parents’ reasons for using holiday childcare, by type of holiday childcare used, 2009-2012 ... 328 Table C8.3: Ease/difficulty of arranging holiday childcare, by age of child, 2011-2012 . 329 Table C8.4: Ease/difficulty of arranging holiday childcare, by family work status and annual income ... 330 Table C8.5: Reasons for difficulties with arranging holiday childcare, by family type .... 330 Table C8.6: Views of parents about childcare during school holiday, by family work status ... 331 Table C9.1: Changes in maternal employment, 1999-2012 ... 332 Table C9.2: Whether usually working atypical hours caused problems with childcare, by family type ... 332 Table C9.3: Childcare arrangements that helped mothers to go out to work, by mothers’ highest qualification ... 333 Table C9.4: Childcare arrangements that helped mothers to go out to work, by mothers’ socio-economic classification ... 335 Table C9.5: Views on ideal working arrangements, by mothers’ highest qualification ... 336 Table C9.6: Views on ideal working arrangements, by mothers’ socio-economic
Figure 2.1: Use of childcare, by family type and work status ... 45
Figure.2.2: Use of childcare, by area deprivation ... 50
Figure 2.3: Median hours of childcare use per week, by family type and detailed work status ... 56
Figure 2.4: Whether parents satisfied with the number of government funded hours ... 62
Figure 3.1: Whether pre-school children attended more than one provider on the same day, by age of child ... 78
Figure 3.2: Reasons for using childcare providers, by age of child ... 80
Figure 4.1: Reasons for using childcare providers, by age of child ... 93
Figure 5.1: What families were paying provider for ... 100
Figure 5.2: Median weekly payment for childcare, by family work status ... 106
Figure 5.3: Median weekly payment for childcare, by region ... 108
Figure 5.4: Difficulty paying for childcare ... 116
Figure 5.5: Difficulty paying for childcare, by family work status ... 117
Figure 6.1: Awareness and use of Families Information Services ... 124
Figure 6.2: Perceptions of availability of local childcare places, 2004 - 2011 ... 128
Figure 6.3: Perceptions of quality of local childcare places, 2004 - 2012 ... 130
Figure 6.4: Perceptions of affordability of local childcare places, 2004 - 2012... 132
Figure 8.1: Parents’ reasons for using holiday childcare, by type of holiday childcare use ... 196
Figure 8.2: Ease/difficulty of arranging childcare in the school holidays ... 202
Figure 9.1: Changes in maternal employment 1999-2012 ... 213
Executive summary
This report provides the main findings of the 2012-2013 survey in the Childcare and Early Years Survey of Parents series. The survey was funded by the Department for Education (DfE), and carried out by Ipsos MORI. The study has two key objectives. The first is to provide salient, up-to-date information on parents’ use of childcare and early years provision, and their views and experiences. The second is to continue the time series – which has now been running for over ten years – on issues covered throughout the survey series. With respect to both of these objectives, the study aims to provide information to help monitor the progress of policies and public attitudes in the area of childcare and early years education.
The report describes in detail what childcare is used by different types of families,
changes in take-up over the years, parents’ reasons for using or not using childcare and for choosing particular providers, and parents’ views on the providers they used and on childcare provision in their local area in general.
Key findings
Use of childcare and early years provision
78% of all families in England with children aged 0 to 14 had used some form of childcare during their most recent term-time week. This equated to 4,194,000 families or 6,090,000 children. The majority of families (63%) had used formal childcare and early years provision, whereas 39 per cent had used informal childcare (provided by friends and family). A significant minority (26%) had used both formal and informal childcare. These proportions are in line with findings from 2011.
The proportion of all children (rather than families, as reported above) receiving formal childcare was 53 per cent. Formal childcare increased from 38 per cent to 44 per cent in the most deprived areas, rose from 48 per cent to 54 per cent in areas in the middle of the deprivation distribution, and fell from 67 per cent to 60 per cent in the least deprived areas.
After looking at a range of characteristics, those independently associated with the use of formal childcare for those aged 0-14 included:
age of child: parents with children aged 3 to 4 were most likely to use formal childcare;
family annual income: a higher family annual income was associated with a higher likelihood of using formal childcare; and
Nearly nine in ten (89%) parents of 3- and 4-year-olds said they received government funded early education in line with 2011 (88%). The figures by age were 79% for 3-year-olds and 98% for 4-year-olds. Among the minority who said they were not in receipt, just under two in five (37%) were not aware of the
universal scheme. Official statistics from the Department for Education Early Years Census and Schools Census show that receipt of government funded early
education was 96 per cent among 3- and 4-year-olds in 2013.
Around three in five (62%) pre-school children (aged 0-4) received childcare for economic reasons (for instance, to enable parents to work, look for work, or study), with child-related reasons being almost as common (57%) (for instance, attending for their educational or social development, or because the child liked attending). Respondents could provide as many reasons as they liked.
Just under half (46%) of families with school-aged children (aged 5-14) used childcare during school holidays. The majority (63%) of parents of school age children reported that it was very easy or easy to arrange childcare during the holiday periods.
Perceptions of childcare and early years provision
The majority of all parents (58%) rated the overall quality of local childcare provision as very of fairly good. Regarding availability, 42 per cent of parents felt the number of local childcare places was ‘about right’ (26% were unsure and 30% said there were not enough places). The proportion of parents reporting good quality childcare and good availability were both in line with 2011.
Thirty-nine per cent of parents said they had too little information about childcare in their local area. Three in ten (31%) parents were aware of Family Information Services, with 12 per cent of all parents having used the service.
The majority (76%) of parents with children aged 2 to 5 had heard of the Early Years Foundation Stage (EYFS) curriculum, representing no change on 2011. Most parents felt they spent enough time with their children on learning and play
activities; however, a third (34%) of parents said they would like to do more with their children.
Paying for childcare
The overall median weekly amount paid by families to childcare providers was £25. This amount varied widely depending on the number of hours of childcare used and different types of provider. There has been a significant increase in the mean weekly payment made by families between 2011 and 2012 survey (from £47 per week to £54 per week). This is not a measure of the provider’s standard fees; it could be that families have simply used more hours between the survey
On perceptions of cost opinions were divided, 32 per cent of parents rated the affordability of local childcare as very or fairly good, with 29 per cent unsure and 39 per cent saying it was very or fairly poor.
However, almost half of parents (49%) said it was easy or very easy to meet their childcare costs with a substantial minority (27%) of families finding it difficult or very difficult to pay (33% said it was neither easy nor difficult). The proportion of non-working lone parents finding it difficult to pay for childcare has significantly increased from 35 per cent in 2011 to 48 per cent in 2012.
Among parents who have not used any childcare in the past year, the main reason given was that they would rather look after their children themselves (71%), while the cost of childcare was cited by significantly fewer parents (13%).
Mothers, work and childcare
The proportion of mothers in employment has significantly increased from 60 per cent in 2011 to 64 per cent in 2012. The Labour Force Survey shows a smaller increase. The proportion of mothers working full time specifically has also significantly increased since the 2011 survey from 25 per cent to 29 per cent. Half of mothers said that having reliable childcare was the most helpful
arrangement which would help them to go out to work.
Over half (54%) of non-working mothers agreed that they would prefer to go out to work if they could arrange good quality childcare which was convenient, reliable and affordable.
Methodology
6,393 parents in England with children under 15 were interviewed for the study between November 2012 and June 2013. The sample of parents was ultimately derived using Child Benefit records which, given its almost universal take-up, provides a
comprehensive sampling frame for families with dependent children.
To maintain comparability with earlier surveys in the series, we limited the children’s age range to under 15. In order to have sufficient numbers of children attending early years provision to enable separate analysis of this group, the proportion of 2- to 4-year-olds was boosted by increasing their probability of selection.
Interviews were conducted face-to-face in parents’ homes and lasted around three-quarters of an hour, as in 2011. Following the model of previous surveys in the series, the study used a very inclusive definition of childcare and early years provision. Parents were asked to include any time that their child was not with resident parents, or their current partner, or at school. Hence this covered informal childcare, such as
children, the definition of childcare covered time they spent attending before- and after-school activities.
Among all those selected and eligible for interview (in other words excluding families who did not have a child aged under 15) 59 per cent of parents were interviewed, similar to the response rate of 58 per cent in 2011. For further details on response see Appendix B.
Use of childcare and early years provision
Families’ use of both formal and informal childcare during term time has remained stable between 2011 and 2012. Overall, 78 per cent of parents used childcare during term time, with 64 per cent using formal provision, 40 per cent using informal provision, and 27 per cent using both formal and informal provision. The survey indicates that in England, approximately 6.1 million children across 4.2 million families received childcare in 2012, with 4.7 million children receiving formal provision, and 2.8 million children receiving informal provision.
Children’s age was strongly associated both with their likelihood of receiving childcare, and with which providers they used. Receipt of childcare overall, as well as receipt of formal childcare, was highest among children aged 3 to 4 (reflecting their entitlement to government funded early education). Receipt of childcare overall was lowest among 0- to 2-year-olds and 12- to 14-year-olds, due primarily to their low take-up of formal childcare. Take-up of informal childcare was highest among children aged 0 to 2.
While pre-school children used a wide range of formal providers (including reception classes, nursery classes, playgroups, nursery schools, and day nurseries), the great majority of formal provision among school-age children came from after-school clubs and activities. Grandparents were the most commonly used informal provider, with their use higher among younger than older children. Older siblings, conversely, were most
commonly used to care for older rather than for younger children.
Children’s ethnic background was associated with their likelihood of receiving childcare, with children from mixed White and Asian backgrounds, White British backgrounds, and mixed White and Black backgrounds most likely to receive childcare, and children from Asian Pakistani and Bangladeshi backgrounds least likely to. Children in couple families were more likely to receive formal childcare than those in lone-parent families, but were less likely to receive informal childcare. Children in working families (and relatedly, in families with higher incomes), were more likely to use formal childcare than children in non-working families (and children in families with lower incomes); these relationships held once other factors had been controlled for.
Children in London were less likely to receive childcare overall, with receipt of informal childcare being particularly low in London. Receipt of formal childcare was highest in the South West, while receipt of informal childcare was highest in the North East.
Children receiving childcare spent 10.0 hours in childcare per week on average, which did not differ significantly from the 9.0 hours recorded in the 2011 survey. Pre-school children spent around five times longer in formal childcare than did school-age children, attributable to school-age children spending much of their time at school, while for pre-school children, early years education constitutes formal childcare provision. Children aged 3 to 4 received 15.0 hours of government funded early education per week on average.
The amount of time children spent at providers varied substantially by provider type. With respect to formal provision, reception classes and day nurseries were attended for the longest each week (31.3 hours and 18.0 hours respectively), while children spent the least amount of time at breakfast clubs and after-school clubs and activities (2.5 hours each). Turning to informal provision, non-resident parents provided the most hours of care per week (15.4 hours for children in their care). Children received far fewer hours of care from other informal providers (between 3.0 and 6.0 hours per week).
Among eligible 3- to 4-year-olds, around nine in ten (89%) were reported to be in receipt of government funded early education in 2012, unchanged since 2011 (88%). Take-up varied by family type and work status, and by region. Children in couple families in which both parents were working were most likely to receive government funded early
education, while children in non-working lone-parent families were least likely to. By region, take-up was highest in the South West, South East, and North East, and lowest in London and the West Midlands.
Among parents not using the entitlement to government funded early education, just under two in five were not aware of the scheme.
Packages of childcare for pre-school children
The survey examined parents’ use of different types and packages of childcare for their pre-school children during term time. Just under three in four pre-school children (73%) used some type of childcare, leaving 27 per cent not in receipt of any childcare.
children were more likely than their older counterparts to receive informal care only (20% and 3% respectively).
Pre-school children spent an average of 6.2 hours per day in childcare, and 21.0 hours per week. Older pre-school children spent longer in childcare per week than younger ones (23.8 and 18.0 hours respectively), again reflecting the entitlement to government funded early years education among this age group. Pre-school children from families with higher annual incomes spent more time in childcare than those from families with lower annual incomes (27.0 hours per week for children in families earning £45,000 or more, compared with between 16.0 and 18.0 hours per week for children in families earning up to £30,000 per year).
Around three in five (62%) pre-school children who received childcare did so for
economic reasons (for instance, to enable parents to work, look for work, or study). The next most common reason for pre-school children to receive childcare (57%) was for child-related reasons (for instance, for their educational or social development, or because the child liked going there). A quarter (25%) of pre-school children receiving childcare did so for reasons relating to parental time (for instance, so that parents could do domestic activities, socialise or look after other children).
Younger pre-school children were more likely than their older counterparts to receive childcare for economic reasons (70% compared with 54% respectively), but were less likely to receive childcare for child-related reasons (38% compared with 73%
respectively).
Across all pre-school children, centre-based childcare was most likely to be chosen for child-related reasons, followed by economic reasons, while informal care was most likely to be chosen for economic reasons, followed by child-related reasons.
Packages of childcare for school-age children
The survey also examined parents’ use of different packages and forms of childcare for their school-age children, during term time and outside of school hours.
Around two in three (66%) school-age children received some type of childcare, leaving 34 per cent not in receipt of any childcare. Almost one in four (23%) school-age children received formal out-of-school care (breakfast or after-school clubs) only, 14 per cent received informal childcare only, and a further 14 per cent received a combination of out-of-school and informal childcare. No other package of childcare accounted for more than two per cent of children.
than both their younger and older school-age counterparts to attend formal out-of-school childcare, either on its own or in combination with informal care.
Of school-age children who received informal care only, the great majority (80%) attended just one provider, compared with 68 per cent among children receiving out-of-school childcare only.
School-age children spent on average 2.0 hours per day in childcare, substantially less than pre-school children (6.2), likely due to many children attending school full time. On average school-age children spent 6.0 hours in childcare per week. Those receiving a combination of out-of-school and informal care received the most hours of care per week (8.7), followed by those receiving informal care only (6.8). Those receiving out-of-school care only attended for far fewer hours per week (2.8).
School-age children were most likely to receive care for child-related reasons (for example for educational or social development, or because the child liked going there) (72%). Almost half (47%) attended for economic reasons (for example to enable parents to work or look for work) and 17 per cent attended for reasons relating to parental time (for example so that parents could do domestic activities, socialise, or look after other children).
The proportion of parents reporting that they used providers for child-related reasons increased significantly between 2011 and 2012 for all age groups (from 59% to 69% for 5- to 7-year-olds, from 58% to 72% for 8- to 11-year-olds and from 63% to 78% for 12- to 14-year-olds). The proportion of parents saying they used childcare providers for
economic reasons rose significantly between 2011 and 2012 for the two younger age groups (from 49% to 55% for 5- to 7-year-olds and from 44% to 49% for 8- to 11-year-olds).
Paying for childcare
A major finding from earlier years of the Childcare and Early Years Survey of Parents series was that while most, if not all, parents appear to be able to talk confidently about money they paid out ‘of their own pocket’ for childcare costs, they were less clear about the details of the financial help they received from others or through tax credits. This trend is once again evident in the current survey findings.
The overall median weekly amount paid by families to childcare providers was £25, although the amount varied widely depending on the provider type used. There has been a significant increase in the mean weekly payment paid by families since 2011 (from £47 per week to £54 per week in 2012). This is not a measure of the provider’s standard fees; it could be that families have simply used more hours between the survey years (these cost statistics are subject to a number of caveats, see page 102).
More than a quarter (27%) of families found it difficult or very difficult to meet their
childcare costs (no significant change from 2011), and just under half (49%) reported that they found it easy or very easy to pay for childcare. Working lone parents were more likely than couples where one or both parents were employed to find it difficult to pay for childcare (37% compared with 23%). The proportion of non-working lone parents finding it difficult to pay for childcare has significantly increased from 35 per cent in 2011 to 48 per cent in 2012. Low income families (with annual incomes under £10,000) were also more likely than those with higher family incomes (£45,000 and above) to have difficulties meeting their childcare costs (46% compared with 17%).
Seventeen per cent of families using childcare reported they had received financial help from others, including the local education authority, social services, their employer, or ex-partner. This is likely to be an underestimate of the scale of the contributions from other sources, as many parents seem not to consider their early education place to be ‘paid for’. Parents using formal childcare most commonly reported getting financial assistance from their employer (10%), followed by their local education authority (8%). Help from employers was primarily in the form of childcare vouchers paid for by salary sacrifice.
Factors affecting decisions about childcare
Almost seven in ten (69%) parents accessed at least one source of information about childcare in the last year. Parents were most likely to receive information about childcare via their friends or relatives or at their child’s school.
Parents who used formal childcare were more likely to access information about
childcare than parents who only used informal childcare or did not use a provider at all. Thirty-nine per cent of parents said they had too little information about childcare in their local area. Three in ten (31%) parents were aware of Family Information Services, with 12% having used the service.
Generally, parents were positive about childcare being flexible enough to meet their needs with only one in five (22%) parents reporting problems.
Of families with school-age children who had not used a before- or after-school club in the reference week, 58 per cent said their child’s school did offer before-school provision and two-thirds (66%) said the school offered after-school provision before or after 6pm. The main reasons for not using both before- and after-school clubs, where these were available, were more likely to be related to the parents’ or their child’s choice or
preference rather than to constraints deriving from the childcare provider or elsewhere. Among parents who had not used any childcare in the past year, the main reason given by 71 per cent of parents was that they would rather look after their children themselves. The cost of childcare (13%) was cited by significantly fewer parents. Looking specifically at parents of children aged 0 to 2, the most common reason for not using nursery
education in the reference week was that parents felt that their child was too young (55%).
Over half (52%) of parents of children with a disability said they found it easy to travel to the nearest childcare provider who could accommodate their child’s condition. However, fewer parents agreed that there are providers in their area who can cater for their child’s condition (39%), that the hours available fitted with their commitments (35%) or that it was easy to find suitable childcare in the area (30%). Of those who used a provider, just over three in five (61%) said that staff were trained in how to deal with their child’s condition.
Making childcare more affordable (38%), followed by more childcare being available during the school holidays (20%), receiving more information about what childcare is available (19%) and longer provider opening hours (16%) were the most common changes to childcare that parents said would suit their needs better.
When asked whether there were types of formal childcare that they would like to use or use more, the majority (56%) of parents said they were happy with their current use of formal childcare. However, one in five stated after-school clubs or activities (22%) or holiday clubs or schemes (19%) would be the formal providers they would like to use or use more of in the future.
Parents’ views of their childcare and early years provision
The vast majority of parents reported that their main formal childcare provider encouraged their child to develop a range of academic and social skills. The most commonly encouraged academic skills (asked of parents of pre-school children only) were enjoying books and recognising letters, words, numbers or shapes. Turning to social skills, playing with other children and good behaviour were the most commonly encouraged skills. Reception classes were most likely to be seen as encouraging both academic and social skills, while childminders were the least likely.
Parents received feedback about their child’s progress from their provider mainly through talking to staff; other methods of feedback, such as pictures, drawings and other work by the child, parents meetings, or written reports were far less common. Parents of school-age children were considerably less likely than parents of pre-school children to be kept informed about their child’s progress, suggesting that pre-school providers were better at giving parents feedback through the methods covered in this survey.
Most parents felt they spent enough time with their children on learning and play
activities; however, a third of parents said they would like to do more with their children. The survey measured parents’ involvement with their child’s learning and development through seven types of early home learning activities. The most frequent home learning activity that parents engaged their children in was looking at books or reading stories, followed by playing at recognising letters, words, numbers or shapes, reciting nursery rhymes or songs, and playing indoor or outdoor games. Relatively fewer parents used a computer with their child; however, there was a significant rise in the proportion of parents using a computer with their child every day, or on most days (36% in 2012, compared with 25% in 2011).
Informal social networks, such as friends or relatives and other parents, were significantly more likely to be used as sources of information for parents about learning and play activities than were official sources, such as FIS, local authorities or other national organisations.
The majority (76%) of parents with children aged 2 to 5 had heard of the EYFS, and of these parents, the vast majority had either spoken to, or received information from their formal childcare provider about the framework.
Forty-two per cent of parents with pre-school children reported that their main formal childcare provider offered additional services for parents. Take-up of these services, however, was low with between one and five per cent of parents using any of the
available services. More than half (54%) of parents said that they had no need for these services.
Use of childcare during school holidays
The use of childcare during school holidays varied both by parents’ working status and their work patterns. Parents who worked were more likely than non-working parents to use formal and informal holiday childcare. Parents whose employment allowed them to only work during term time were substantially less likely than other working parents to use childcare during the holiday periods.
The likelihood of families using childcare during the school holidays was related to their likelihood of using childcare in term time: just over half (52%) of families with school-age children who used term-time childcare also used childcare during the holidays. In
contrast, 74 per cent of families who did not use childcare during term time also did not use childcare in the holidays.
School-aged children were far more likely to have received formal childcare during term time than during the school holidays (53% compared with 22% respectively), and were slightly more likely to have used informal childcare during the term time than during holiday periods (30%, compared with 24%). Grandparents were by far the most
commonly used informal provider during both term time and school holidays (18% and 17% respectively).
The most common reason stated by parents for using holiday childcare was economic (63%), such as allowing the parent to go to work. Child-related reasons, for example using providers that helped the child’s development, or that children enjoyed spending time with, were also important (55%) and these figures are consistent with findings in 2011. The motivations for using certain providers varied considerably: on the whole, reasons related to children’s development took priority when using after-school schemes and holiday clubs, whereas economic factors were the most commonly mentioned in relation to childminders. In contrast, the most frequently cited reasons for using informal childcare provision were economic; the exception being ex-partners, who were more often used for child-related reasons.
The average cost of childcare during the holidays varied by provider type: parents paid £18.30 per day for after-school clubs, £24.42 per day for holiday clubs, and £32.73 per day for childminders. Children spent longer amounts of time per day with childminders, which suggests that the price differences may reflect different periods of use.
There was no significant difference in the mean number of hours per day families used holiday clubs for between 2011 and 2012. However, there was a significant increase in the number of hours per day parents employed childminders for (from a mean of 6.73 hours in 2011 to a mean of 7.64 in 2012).
parents: 25 per cent of working lone parents found arranging holiday childcare difficult or very difficult.
When parents were asked directly to rate the affordability of childcare during the school holidays, 32 per cent agreed that they had difficulty finding childcare they could afford. A small proportion of parents were unhappy with the quality of childcare available to them during the school holidays (14%), and experienced problems finding holiday childcare which was sufficiently flexible (21%).
Just over half (53%) of families did not use any childcare during the holidays. This was most commonly due to them not requiring it; for instance, they preferred to look after children themselves (50%), did not need to be away from their children (22%), or they/their partner was at home during the holidays (21%).
Mothers, childcare and work
The proportion of mothers in employment has significantly increased from 60 per cent in 2011 to 64 per cent in 2012, in line with recent findings from the Labour Force Survey. The proportion of mothers working full time specifically has also significantly increased since the 2011 survey from 25 per cent to 29 per cent.
Household working patterns differed depending on family type. More than half (54%) of mothers were part of couple families where either both parents were in full-time
employment or one parent in full-time employment with the other working part time for 16 to 29 hours per week (27% each). Worklessness was significantly higher among lone mothers at 44 per cent (compared with 7% of couple families).
Twenty-nine per cent of mothers were working atypical hours, defined as working before 8am or after 6pm at least three days a week or every Saturday or Sunday. However, the proportion increased to 51 per cent when looking just at working mothers. The most common atypical patterns were to work after 6pm or before 8am at least three days a week (14% and 13% respectively) and 35 per cent and 33 per cent of working mothers respectively reported that this caused difficulties with their childcare arrangements. A smaller proportion of parents reported that working every Saturday (21%) or Sunday (14%) caused problems.
Among mothers who had started work within the last two years, the most common
reason for this change was that they had found a job that enabled them to combine work with looking after their children (28%).
Over one-third (37%) of working mothers said they would prefer to stay at home and look after the children if they could afford it, while fifty-seven per cent said they would like to work fewer hours and spend more time looking after their children if they could afford it. Over one in five (23%) working mothers said they would like to increase their working hours if they could arrange good quality childcare which was convenient, reliable and affordable.
The same proportions of mothers were self-employed (10%) and studying or training (11%) as in the 2011 survey. However, the number of mothers not in work has
1 Introduction
1.1 Aims of the study
This report provides the main findings of the 2012-2013 survey in the Childcare and Early Years Survey of Parents series. The survey was funded by the Department for Education (DfE), and carried out by Ipsos MORI. The study has two key objectives. The first is to provide salient, up-to-date information on parents’ use of childcare and early years provision, and their views and experiences. The second is to continue the time series statistics – which have now been running for over ten years – on issues covered
throughout the survey series. With respect to both of these objectives, the study aims to provide information to help monitor effectively the progress of policies in the area of childcare and early years education.
1.2 Policy background
The childcare system in England is a mixed economy, with services provided by the public, private, voluntary and independent sectors. It is a well-regulated sector and most providers must register with and be inspected by the regulator Ofsted.
Since the 1998 National Childcare Strategy (DfE, 1998), key government policies and programmes have focused on how to increase the availability of early education and childcare services, improve the quality of provision and make services more affordable to parents. This trend has continued since the formation of the Coalition government in 2010. In addressing the recommendations of three independent policy reviews for government, the policy document Supporting Families in the Foundation Years (DfE 2011)1 outlined plans to reform the Early Years Foundation Stage; retain a national network of Sure Start Children’s Centres and consult on a new core purpose; extend government funded early education to around 40 per cent of 2-year-olds; revise statutory guidance to increase the flexibility of government funded early education for 3- and 4-year-olds; and promote quality and diversity across the early education and childcare sector.2
1
Department for Education (2011) Supporting Families in the Foundation Years Department for Education, Department of Health: London.
2
HM Government (2010) Preventing Poor Children Becoming Poor Adults. The report of the Independent Review on Poverty and Life Chances by Frank Field. Cabinet Office: London.
HM Government (2011) Early Intervention: The Next Steps and Early Intervention: Smart Investment, Massive Savings. Two Independent Reports by Graham Allen MP. Cabinet Office: London.
Department for Education (2011) The Early Years: Foundations for life, health and learning. An
Childcare services for children aged up to 5 years (which includes the first year of school – known as reception class) must comply with the requirements of the Early Years
Foundation Stage (EYFS). This framework was introduced in 2008 and specifies the ways in which children’s learning and development should be supported, and a series of milestones which children can expect to reach by particular ages. The Early Years Foundation Stage Profile is completed at age five, which assesses whether the child has achieved a good level of emotional, cognitive and physical development. The EYFS also specifies requirements concerning the welfare of children and the staffing for settings. All registered settings are inspected by Ofsted against how well they meet the requirements of the EYFS. A new, streamlined framework was introduced September 2012, following on from an independent review by Dame Clare Tickell which reported in March 2011. The revised framework includes key features of the original, but reduces the number of Early Learning Goals which children are assessed against It also aims to reduce burdens, including unnecessary regulation and paperwork, so professionals have more time to concentrate on supporting children.
Since September 2010, all 3- and 4-year-old children have been entitled to 570 hours of government funded early education a year, accessed over a minimum of 38 weeks of the year (equating to 15 hours a week). In addition to this, the government has introduced government funded early education for the least advantaged 2-year-olds to reach around 20 per cent of the cohort from September 2013 and around 40 per cent from September 2014. Currently, all 2-year-olds who meet the criteria for free school meals (from families on out of work benefits or on low incomes and who receive Working Tax Credits) and looked after children will be entitled to a place.
Other government support for childcare includes the means-tested childcare element of Working Tax Credit, through which parents working 16 hours or more per week can claim up to 70 per cent of their childcare costs up to maximum limits. Starting in 2013, a single benefit payment called Universal Credit will be rolled out across the country, and this will replace Working Tax Credit, including the childcare element. The government announced that a further £200 million will be invested in childcare support in Universal Credit so that families working less than 16 hours per week can for the first time claim help with their childcare costs.
Working parents can benefit from significant savings of up to £933 per year by using childcare vouchers to pay for their childcare; here employers participating in the scheme enable payment directly from parents’ salaries before tax and National Insurance is deducted.
key drivers of high quality provision and better outcomes at age 5 (Sylva et al).3. The Coalition government commissioned an independent review, led by Professor Cathy Nutbrown, to consider how best to strengthen qualifications and career pathways in the foundation years. Professor Nutbrown published her report in June 20124, which was addressed by the government in More Great Childcare (see below).
In June 2012, the Prime Minister announced a joint Department for Education and Department for Work and Pensions Commission on childcare to look at how to reduce the costs of childcare and burdens on childcare providers in England. Two documents, More Great Childcare (January 2013) and More Affordable Childcare (July 2013), were published as a result, detailing the policy priorities of the Coalition government.5 More Great Childcare set out how the government would achieve a more dynamic childcare market delivering high quality early education. It incorporated the government’s response to Professor Cathy Nutbrown’s independent review. It identified the following major delivery objectives:
raising the status and quality of the workforce through the introduction of the Early Years Teacher qualification for graduates and Early Years Educator qualification for staff without graduate status;
enabling high quality providers to offer more high quality places with great flexibility to invest in high calibre staff;
improving the regulatory regime through ending duplication of inspection,
assigning Ofsted sole responsibility and reforming the Early Years inspections that they undertake; and
giving more choice to parents by establishing childminder agencies, encouraging schools to offer places to younger children, and enabling more traditional nursery classes by encouraging private and voluntary nurseries to use existing flexibilities allowing graduates to lead classes of 13 children per adult.
More Affordable Childcare set out plans to tackle the cost of childcare for parents. It identified three major delivery objectives:
helping families pay for childcare though an additional £200 million of support for lower income families as part of Universal Credit from April 2016 (equivalent to providing 85% of costs for families where both parents in a couple, or a lone parent, are taxpayers); a new tax-free Childcare offer for working families (not
3
Department for Education (2004) The Effective Provision of Pre-School Education (EPPE) Project: Final Report. A Longitudinal Study Funded by the DfE 1997-2004 by Sylva et al. DfE Publications: Nottingham. 4
Nutbrown, C. (2012) Foundations for Quality: The independent review of early education and childcare qualifications.
5
Department for Education (2013) More Great Childcare: raising quality and giving parents more choice
Department for Education: London. Department for Education (2013) More Affordable Childcare
receiving tax credits or Universal Credit) that aims to contribute 20 per cent of working parents’ childcare costs up £6,000 per child per year, and offering funded places to around 40 per cent of the most disadvantaged 2-year-olds by September 2014;
increasing the amount of affordable provision by bringing forward a new simplified childcare registration system, enabling more freedom for schools to set their opening times and dates and allowing school buildings to be used more by childcare organisations; and
giving parents the right information so they can make informed choices about childcare. This will be done by acting on recommendations of independent research that will identify what parents need to make the best decision, and by supporting their accessing of more informal care.
Children’s centres continue to be an important part of the local early years landscape; they offer integrated services including information, health, parenting support, and childcare for children up to the age of five. Their core purpose, revised in 2012, is to improve child development, school readiness, parenting aspirations and skills, and child and family health and life chances with a particular focus on the most disadvantaged families.
1.3 Times series of the Childcare and Early Years Survey of
Parents
The current study is the seventh in the Childcare and Early Years Survey of Parents, which began in 2004. As explained in the report of the 2009 survey (Smith et al 2010), the time series stretches back further than 2004, as the current series is the merger of two survey series that preceded it.
As discussed by Smith et al, changes to the questionnaire over time mean that in many instances it is not possible to provide direct comparisons that extend to the beginning of the time series. Most of the comparisons in this report examine changes in the results between the 2011 and 2012 surveys, although statistics from earlier surveys in the series are compared where possible. Where statistically significant increases or decreases have been identified between the 2011 and 2012 survey, efforts have been made, using
evidence, to explain the changes.
On occasion, statistics from the 2011 and 2012 surveys cannot be compared owing to changes in the way the questionnaire was administered and/or the data were
1.4 Overview of the study design
The sample
6,393 parents in England with children under 15 were interviewed for the study between November 2012 and June 2013. The sample of parents was ultimately derived using Child Benefit records, which given its almost universal take-up, provides a
comprehensive sampling frame for families with dependent children.
The sample design was changed in 2010 so that a sample of children was selected from the Child Benefit records, rather than a sample of Child Benefit recipients (in other words parents) as in previous surveys in the series. This change was made to reduce the level of corrective weighting necessary compared with previous surveys in the series, hence resulting in more precise survey estimates.
To maintain comparability with earlier surveys in the series, we limited the children’s age range to under 15. The number of 2- to 4-year-olds was boosted to ensure sufficient numbers attending early years provision were included in the sample. This was necessary to provide separate analysis for this group.
Among all those selected and eligible for interview (e.g. excluding families who did not have a child aged under 15), 59 per cent of parents were interviewed, similar to the response rate of 58 per cent in 2011. For further details on the sample achieved see Appendix A. For further details on the response rate see Appendix B.
The interviews
Interviews were conducted face-to-face in parents’ homes and lasted around three-quarters of an hour, as in 2011. The main respondent to the survey was always a parent or guardian with main or shared responsibility for childcare decisions and tended to be the mother of the children (see Appendix A for the gender breakdown of respondents). In addition, any partners at home during the interview were asked personally about their employment and other socio-economic and demographic characteristics. Where this was not possible, the main respondent was asked to provide proxy information about their partner.
The interview was similar to that in 2011 and focused on families’ use of both childcare and early years provision. Because of the constraint of interview length, detailed
As childcare arrangements may vary between school term-time and school holidays, most of the questions focused on a reference term-time week (which was the most recent term-time week). A separate set of questions was asked about the use of childcare
during the school holidays by parents of school-age children (these questions had been added in 2008).
The interview broadly covered the following topic areas:
For all families:
use of childcare and early years provision in the reference term-time week, school holidays (if applicable) and last year;
payments made for childcare and early years provision (for providers used in the last week), and use of tax credits and subsidies;
sources of information about, and attitudes towards, childcare and early years provision in the local area; and
if applicable, reasons for not using childcare.
For one randomly selected child:
a detailed record of child attendance in the reference week; and reasons for using and views of the main formal provider.
Classification details:
household composition;
parents’ education and work details; and provider details.
Full details of the study design and implementation can be found in Appendix B.
Defining childcare
The study uses a very inclusive definition of childcare and early years provision. Parents were asked to include any time that the child was not with a resident parent or a resident parent’s current partner, or at school. In order to remind parents to include all possible people or organisations that may have looked after their children, they were shown the following list:
Formal providers: nursery school
nursery class attached to a primary or infants’ school reception class at a primary or infants’ school
day nursery
playgroup or pre-school childminder
nanny or au pair
baby-sitter who came to home breakfast club
after-school clubs and activities holiday club/scheme
Informal providers:
my ex-husband/wife/partner/the child’s other parent who does not live in this household
the child’s grandparent(s) the child’s older brother/sister another relative
a friend or neighbour
Other:
other nursery education provider other childcare provider
Definitions of main formal providers for pre-school children
A short definition for each of the main formal providers for pre-school children is included below. The definitions were not provided to parents in the survey but these are included in this report to help the reader differentiate between the most common categories.
nursery school – this is a school in its own right, with most children aged 3-5 years. Sessions normally run for 2 ½ to 3 hours in the morning and/or afternoon; nursery class attached to a primary or infant