Vulnerability technical spend report
JULY 2019
Estimating Children’s Services
spending on vulnerable
0 Author: Max Stanford and Martin Lennon.
Edited by Leon Feinstein. Children’s Commissioner’s Office
Address for correspondence: info.request@childrenscommissioner.gov.uk
Acknowledgements
1
Contents
Executive summary ...2
How many children are getting what help? ...4
Introduction ...10
Background ...10
Aims ...11
Findings from work with local authorities ...13
Methodology ...19
Methodology for mapping spend ...23
Methodology for estimating the number of children supported by category ...25
Data assessment ...25
Sample ...30
Mapping limitations ...33
Overall findings ...34
Number of children supported ...35
Profile of spend and the number of children supported...37
Spend per child ...39
Profile of spend and numbers of children by programme categories ...42
Findings on specific categories of support ...45
Children’s social care and preventative, pre-statutory support ...45
Children with Special Educational Needs or Disabilities (SEND) ...50
Conclusions ...54
Key findings ...54
Implications and recommendations for financial and strategic oversight of children’s services ...56
2
Executive summary
This report provides new estimates of how much is spent on children in specific categories of need and vulnerability across a sample of local authority children’s services departments.
The Children’s Commissioner’s Office visited over a dozen LAs between November 2018 and February 2019 to gather evidence from Directors of Children’s Services, elected council members, heads of finance and programme managers on local pressures on children’s services budgets, specifically budgets for high needs and early intervention. The Children’s Commissioner Office then worked closely with nine local authorities to develop a methodology to allocate financial data and produce a set of estimates.
The work does not provide a nationally representative picture of demand and spend intended to benefit children in England. The aim was to get a better understanding of the current cost pressures facing councils and then work with local authority children’s services to co-create a common framework and methodology for mapping the level of support and spend on children and to work with a small sample of LAs to use this framework to obtain comparable data.
In the absence of a full national dataset on where money goes this study provides an important contribution to the debate on the efficiency, effectiveness and fairness of current funding.
What services are provided to children?
The Children’s Commissioner worked with the nine authorities to develop a method of categorising spend in relation to intended beneficiaries across the full-range of activity within children’s services. There are national data collections relating to certain parts of these services, but there is no national dataset that captures the full range of support provided to children. For example there is no data captured on children’s social care help to families not within the statutory system, nor does existing data distinguish levels of need or spend within the data on children with special educational needs or for looked after children.
3
[image:5.595.42.558.58.508.2]What is spent to support different children’s needs?
Figure 1 – Average annual children’s services gross expenditure by categories of support for the nine LAs that mapped their spend with 2017/18 budget data.
High cost LAC,
£3,600,000, 2% high cost EHCP, £8,000,000, 4%
LAC , £29,900,000, 17%
UASC, £1,800,000, 1% CPP, £4,200,000, 2%
EHCP, £35,200,000, 20%
Youth offending, £1,700,000, 1% Permanency,
£11,100,000, 6% CIN, £7,300,000, 4%
Troubled Families, £1,600,000, 1% Early Help, £5,300,000, 3% SEN support, £4,700,000,
3% Behavioural support,
£4,900,000, 3% Targeted early years,
£7,500,000, 4% Mental health & well-being, £2,100,000, 1% Targeted youth work,
£2,100,000, 1%
School-related support, £12,600,000, 7%
Universal early years , £24,300,000, 14% Universal youth work,
£1,200,000, 1% Unapportioned staffing ,
£1,300,000, 1%
4
How many children are getting what help?
[image:6.595.69.513.119.540.2]The second stage of this work was to identify how many children were being supported by each of these categories of support. This is shown in Figure 2 below.
Figure 2 - Average number children supported in each category across the nine LAs in 2017-18. Note school related support is not to scale given it supports a much higher number of children.
Unsurprisingly, the largest groups of children are accessing the ‘universal support’. These are very broad services – such as school improvement and admissions – which children may not notice in their lives. Some elements of these services are more specific and important for some children, such as school transport and childcare provision. The universal early years support mostly consist of the free childcare for all 4- and 3- year olds, for which local authorities receive specific funding.
This work shows that very few children are accessing what we have termed ‘targeted support’, represented by the blue bars in the graph above. This level of support captures a range of diverse support that is aimed at definite groups or type of need. This includes ‘behavioural support’ such as provision for children excluded from school, and ‘targeted early years’ support which centres on early education for disadvantaged two year olds. As well as targeted youth support for children Not in Employment, Education or Training (NEETs) as well as early access mental health support.
15 110 610 50 540 2,900 190 2,800 1,400 3,000 4,000 8,600 380 2,000 520 560 74,100 10,000 5,100
- 2,000 4,000 6,000 8,000 10,000
High cost LAC
high cost EHCP
LAC UASC CPP EHCP Youth offending Permanency CIN Troubled Families Early Help SEN support targeted behavioural
targeted early years
Mental health & well-being
targeted youth
school related
Universal early years
Universal youth
5 A much greater proportion of children are accessing what we have termed ‘pre-statutory support’, shown in green in the graph above. This level of support captures a range of diverse support that is aimed at definite groups or type of need but for children and families who have not been assessed to have crossed statutory thresholds. This includes the Troubled Families Programme of keyworkers to families. It also includes the broader ‘Early Help’ offer provided by local authorities to families. This ranges from parenting classes, to long-term key worker support for families with chronic issues and lots in-between. How this is set-up varies considerably between local areas. The other area of pre-statutory support is special educational needs help in schools for children not on an education health and care plan. This could be interventions from an educational psychologist or speech or language therapist, or other support provided by the local authority.
Figure 3 below shows the children accessing services as a proportion of all children within a local authority.
[image:7.595.71.537.284.657.2]What proportion of children get different support?
Figure 3 - Average number and proportion of supported children for each level of support by the nine LAs in 2017/18
As the graph demonstrates, the group of services we have termed ‘pre-statutory support’ are those supporting the most children who are receiving distinct services. Yet most of this support is hidden or opaque in national data collection. The S251 spending data does not attempt to estimate the number of children supported in any category of spend, but even within spending data early help support could be captured in several different budget
Acute high cost EHCP & LAC, 130 , 0%
Acute needs (LAC, UASC), 660 , 1%
High needs (CPP, EHCP, YO), 3,600 , 3%
Permanency , 2,800 , 3% Complex needs (CIN), 1,400 , 1%
Pre-statutory (TF, EH, SEN), 15,500 , 13%
Targeted support, 3,500 , 3%
6 lines. Therefore, there is no consistent and clear data on spending on pre-statutory support. A general exception is the area of Troubled Families for which data is collected by the Ministry of Housing and Local Government on recipients.
Visits to initial engagement with local authorities identified a widespread expectation that these pre-statutory and targeted support would be substantially reduced over the next few years due to funding pressures. All Government funding for the Troubled Families programme ends in 2020.
What is the relationship between spend and provision?
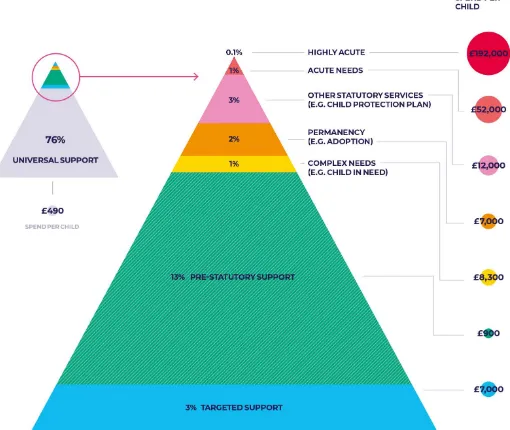
[image:8.595.44.554.245.675.2]These estimates were then used to link spend and the number of children supported for the different categories of need. This is shown in the graphic overleaf.
7
What are the key findings from this work?
From this work a set of key findings were developed, set out below.
Non-statutory services account for over a third of spend, but make up nine in ten children supported by children’s services. Many more children are getting some type of service than measured in current national statistics. We do not have a complete picture of how many children are getting different types of help for their needs.
The report estimated that all non-statutory support (adding together pre-statutory, targeted and universal support) makes up the vast majority (93%) of all children supported by children’s services – an average of just over 108,000 annually per local authority. Yet this support makes up 37% of spend, calculated at over £66 million per council annually. In contrast, all statutory support (including acute, high and complex needs as well as permanency) supports an average of 7%, around 8,600 children annually.
Local authority children’s services spend is spread across a range of different types of support for children and that there is a wide range of support being given to children across all levels of need.
However:
a) There is no national data on the entire number of children supported by children’s services. With no data on the number of children supported by various levels of spend; and
b) There are large cohorts of children who are accessing support that is not currently recognised in national data collections, for which little is known about the number of children benefiting from support, spend on these or any data on the effectiveness or impact for children.
A few cost pressures are placing a disproportionate financial strain on local authorities.
The majority (58%) of spend – an average of over £100 million a year per LA – goes to children supported by statutory support. This made up an average of 7% of all children supported by children’s services, around 8,600 children annually per LA. This is neither surprising nor problematic. Both the High Needs and Children’s social care budget are dedicated to children with additional needs or vulnerability.
LAs highlighted that the concentration on a very few children was causing acute financial strain. Children with highly acute needs1 made up 0.1% of the total number of all children supported. Spending to support these children made up an average of 7% of all children’s services spending - almost £12 million or £192,000 per child annually. When broken down this was:
> 15 children on average per LA costing £260,000 per year for looked after children in high cost2
residential placements.
> 130 children on average per LA average of £87,000 per year for a child with an EHCP in high cost3
specialist provision.
It is not surprising that those with greater needs will require greater resources. However, the degree of concentration on services for a few children is a cause for concern because of the impact on other services, particularly recognising that there is little data on the experiences or outcomes of these few children.
1 Which includes looked after children in high cost residential placements and children with an EHCP in high cost specialist
provision.
2 We defined high cost children’s social care as over £4,000 per week on in-house or private placements.
8 A substantial number of children receiving pre-statutory and targeted support are at high risk of losing out on these critical levels of support in the future
LAs voiced concern that pre-statutory support had been substantially cut and would see further reductions in the future as a result of increasing pressure within statutory services. This supported previous findings on the 60% reduction in spend on targeted early years and youth services.4
Therefore, we estimated the number of children who are receiving these forms of pre-statutory and targeted support. These figures provide a rough estimate of the number of children who are at risk of losing out of services due to spending pressures, as an average across our sample local authorities.
Pre-statutory support included:
a) Troubled Families programme, the funding of which is due to end in March 2020. An average of 3,000 children per local authority were receiving support at £1,600 per child annually.
b) ‘Early Help’ – a broad term referring to support given to families outside of the context of statutory interventions. Our work identified an average of 4,000 children per local authority were receiving support at £3,500 per child annually.
c) SEN support. An average of 8,600 children per local were receiving support at £700 per child annually. Targeted support included:
a) Targeted behavioural support, such children supported when excluded from school. This supported an average of 380 children per local authority who were receiving support at £24,000 per child annually. b) Mental health and well-being support, which supported an average of 520 children per local authority
who were receiving support at £24,000 per child annually.
c) Targeted youth work, which made up an average of 560 children per local authority who were receiving support at £4,900 per child annually.
What are the implications of this work?
The research in this reports highlights two deficiencies in collective oversight of children’s services: 1) No attempt is made to estimate the level of demand for children’s services in terms of:
a. The true number of vulnerable children in England likely to require help. The Department for Education’s Child in Need review,5 and the Children’s Commissioners’ Vulnerability Framework6 both demonstrate the large population of children who require help;
b. How reductions in funding to housing, welfare and other Government services could impact on demand for statutory services. This has been accepted by Ministers7 but the data to identify these are weak;
c. How reductions in other forms of children’s services support impact on demand, with no clarity nationally on the number of children accessing early years support, early help services for families or youth services.
4 Institute for Fiscal Studies (2018) Public Spending on Children in England: 2000 to 2020. Available at:
https://www.childrenscommissioner.gov.uk/wp-content/uploads/2018/06/Public-Spending-on-Children-in-England-CCO-JUNE-2018.pdf
5 Department of Education (2019) Review of children in need. Available at:
https://www.gov.uk/government/publications/review-of-children-in-need/review-of-children-in-need
6 Children’s Commissioner (2018) Children’s Commissioner’s annual study of childhood vulnerability in England. Available at:
https://www.childrenscommissioner.gov.uk/publication/childrens-commissioner-vulnerability-report-2018/
7 In evidence to the HCLG Select Committee Inquiry into Children’s Services. Available at:
9 2) There is no framework of measurement of outcomes for children’s services. This means both that there
is no way to consistently assess impacts and benefits for children and families, and that the system has failed to incentivise provision in the long-term interests of children.
By developing a methodology for doing this analysis in a standard way across agencies working with children these authorities have also developed a tool that might be much more widely applied. Gaps in knowledge between local authorities and agencies in health, for example, mean that there is very little clarity on how children move between the different systems.
This suggests that improving the specification of financial data to be clearly linked to specific groups of children and making better connection between this and data on children could substantially improve policy and practice knowledge about trends in need and the fit and value of services. There is a need for long-term improvements to the data, building on the methods used set out in this report.
10
Introduction
Background
There is currently no accurate local or national level data on how much is spent on children with specific vulnerabilities and needs. Instead, available data is fragmented and based on funding allocations for specific services or programmes.8 This is a substantial problem as it limits any ability to understand the relationship between levels of spend and levels of need.
It is particularly concerning given that the latest Children’s Commissioner’s Annual Vulnerability report indicates there are 2.3 million children in England living in families with substantial complex needs, and that of these, 1.6 million children have no established, recognised form of additional support. This includes 830,000 children who are not even known to services.9 These vulnerable children are viewed by the Children’s Commissioner as “invisible” in so far as they do not receive statutory services, but have a need for support for which there is no evidence that it is currently provided.
The Department for Education’s ‘Child in Need’ review, showed that at least 1.6 million children in England needed statutory social care services over the 6 years to March 2018.10 This constitutes 10% of the state school population. The review showed that many of these children have a long but inconsistent relationship with children’s services. Moreover, educational outcomes tended to be poor both while they were receiving children’s services and long after. Only 17% of children who have ever been identified as a Child in Need pass maths and English GCSEs.11
At the same time, a number of councils have in the past year entered emergency financial measures citing cost pressures within children’s services. In the financial year 2017/18, 91% of local authorities (LAs) overspent on their children’s services budget, to a total of £892m, more than 10% of the total budget for children’s services.12 Work from the Local Government Association and the Housing, Communities and Local Government Select Committee both found that children’s services requires a £3.1 billion real terms increase in funding by 2025 to be sustainable.13
Reports from the National Audit Office and the Public Accounts Committee were critical of the Department for Education’s lack of understanding as to what was being spent by local authorities’ on children’s social care, and what determined this spend.14 This reflects a wider challenge, also identified by NAO that “government has lacked clear and sustained strategic leadership on data.”15
8 For example, children receiving the 3 and 4 year old early education entitlement or the numbers of children with an Education
Health and Care Plan (EHCP)
9 The vulnerability report also provides a framework that includes a set of 70 categories, or types of aggregate vulnerabilities, risks
and needs of children in England under the age of 18 which the Office uses to monitor and report to Parliament on trends in the vulnerability of children in England. Available at: https://www.childrenscommissioner.gov.uk/vulnerability-in-numbers/
10 Department of Education (2019) Review of children in need. Available at:
https://www.gov.uk/government/publications/review-of-children-in-need/review-of-children-in-need
11 Department of Education (2019). Children in need of help and protection, CIN review: final data and analysis. Available at:
https://assets.publishing.service.gov.uk/government/uploads/system/uploads/attachment_data/file/809108/CIN_review_final_ analysis_publication.pdf
12 National Audit Office (2019). Pressures on children’s social care. Available at:
https://www.nao.org.uk/report/pressures-on-childrens-social-care/
13 House of Commons: Housing, Communities and Local Government Committee (2019). Funding of local authorities’ children’s
services. Fourteenth Report of Session 2017–19. Available at:
https://publications.parliament.uk/pa/cm201719/cmselect/cmcomloc/1638/1638.pdf; Local Government Association, Children's care cash crisis. Available at: https://www.local.gov.uk/about/news/childrens-care-cash-crisis-nine-10-councils-pushed-red
14 National Audit Office (2019). Pressures on children’s social care. Available at:
https://www.nao.org.uk/report/pressures-on-childrens-social-care/
15 National Audit Office (2019). ‘Challenges in using data across government’. Available at
11 To identify how much is being spent on children nationally the Children’s Commissioner with the Institute for Fiscal Studies published Spending on Children in England: 2000 to 2020, which provided new estimates of total spending by the government on children in England.16 It found that in 2017/18 total spending – including benefits, education spending, services for vulnerable children and healthcare – was over £120 billion or over £10,000 per child under the age of 18. It also found a number of worrying trends between 2009/10 and 2016/17. Mainstream and acute services such as age 4-16 education and provision for children in care had been protected at the expense of targeted and pre-statutory services, such as family support and safeguarding removing vital safety nets for some very vulnerable children. In addition, spending on early and preventative interventions such as Sure Start and young people’s services, had been cut by around 60% in real terms. The report highlighted a lack of data on spending, particularly in relation to these targeted, preventative services well as national health spending.
While there has been widespread concern over cuts to children’s services, there is limited information on how the various levels of funding from government departments to support children, especially vulnerable children, is spent at a local level. Data is patchy on what different types of support children receive and how different councils fund this support. This is particularly the case for services being provided by councils to children or families not reaching the statutory level of support. This includes council’s ‘Early Help’ offer which is used to support to families and children with a range of services from parenting classes to domestic abuse and substance abuse. It also includes youth work and mental health services as well as support to children with an identified Special Educational Need or Disabilities (SEND) who does not have an Education, Health and Care Plan (EHCP). The fragmented nature of support for vulnerable children – operated by multiple agencies with different reporting systems – means there is a significant gap in data on the degree to which spend meets the needs of vulnerable children. This is of particular concern at a time of increasing spending pressures on local agencies. If the needs of vulnerable children are to be met adequately, the Children’s Commissioner believes there must be an ability to identify the demands on, and reasons for spend by, local agencies nationally – ultimately going beyond only local authority children’s services. In addition, the inability to make the link between spend and children means that there is little data on the impact of spending to support children, although this gap is not addressed in this report.
Aims
In response to the issues outlined above, the Children’s Commissioner set out to work with local authorities to look at three issues:
1) What services are currently being provided to vulnerable children;
2) What is spent on each of these services, and to what degree is their alignment between the needs of children and the spend by local authorities; and
3) What are the major determinants of spending?
In thinking about these questions, Children’s Commissioner considered the full breadth of children’s needs, conscious of the fact that the Children Act 1989 and the Children and Families Act 2014 entitle children to a broad range of support. Yet, as outlined above, only small aspects of this support is currently captured.
This report describes a first attempt by the Children’s Commissioner to work with councils to map spend in relation to children’s needs in terms of the number of children with different forms or risks of vulnerability supported at a local level. The work does not provide a nationally representative picture of demand and spend on children in England. The aim was to work with local authority children’s services to co-create a common
16 Institute for Fiscal Studies (2018) Public Spending on Children in England: 2000 to 2020. Available at:
12 framework and methodology for mapping the level of support and spend on children and to work with a small sample of LAs to use this framework to obtain comparable data.
The Children’s Commissioner set about this by first visiting over a dozen LAs between November 2018 and February 2019 to gather evidence from Directors of Children’s Services (DCS), elected council members, heads of finance and programme managers to discuss local pressures on children’s services and specifically their high needs and early intervention budgets. Findings from these visits are set out in Chapter 2. They were also used to inform a methodology (Chapter 3) for developing consistent data on which vulnerable children receive support and the amount spend on that support. Findings from the visits were also used to interpret findings from the spend mapping work which is detailed in Chapter 4 and 5. Both of which are used to inform conclusions and policy implications of this work in Chapter 6.
The work was aimed at informing government and local agency decision making. It was specifically intended to provide evidence to inform the Children’s Commissioner proposals for better investment in vulnerable children to government as part of the upcoming spending review as well as other work such as funding formulae reforms and policy development for the end of the Troubled Families Programme. The work was also intended to develop a methodology for future mapping that might be carried out with a wider group of local and national agencies. When reading this report it should be emphasised that:
> Spend on children includes much more than spending by local authority children’s services. However,
given the current concerns about funding gaps for children’s services the Children’s Commissioner saw the need to understand the main drivers of spending pressures on children’s services and to identify what support, and which children, are most likely to be affected by these spending pressures.
> The report may on occasion use terminology, acronyms and shorthand, which could be seen to conflate
13
Findings from work with local authorities
Following discussions with a range of local authorities, the Children’s Commissioner contacted all councils in England seeking information regarding local pressures on children’s services and specifically their high needs and early intervention budgets. From this, the Children’s Commissioner developed a set of aims – laid out in Chapter 1. To begin to address these over a dozen LAs were visited between November 2018 and February 2019 to gather evidence from Directors of Children’s Services, elected council members, heads of finance and programme managers.
Increasing financial pressures
All local authorities visited were under extreme cost pressures, which were expected to intensify. In line with findings from the Local Government Association and the Housing, Communities and Local Government Select Committee, all councils felt they were unable to continue current levels of provision, including their statutory obligations in the near future.17 For most authorities this point was coming soon, and would be reached by the early 2020s. But, before that was a critical point where vital non-statutory services (early help and family support services) would have to be cut. Several local authorities felt that cutting these services could precipitate a rapid decline in the local authorities’ ability to manage their caseload, as more families would end up requiring statutory support. This point for local authorities was generally within two years, and for many would be the year 2020/21, if funding for the current Troubled Families Programme is not renewed.
Councils felt pressure in different ways
While all local authorities identified immediate cost pressures, these manifested in different ways. Local authorities which were felt to be financial and administratively ‘well run’, with good Ofsted inspection frameworks, were struggling to maintain services. These authorities were generally very proactive in keeping costs down enabling them to offer a comprehensive service. But maintaining this level of service was increasingly difficult, and they were on the brink of cuts which they thought would spiral as it would increase pressure elsewhere. Several of these local authorities have been identified in previous research as having some of the lowest cost base in England, yet they were unequivocal that this did not mean they were in a sustainable position. This supports National Audit Office findings that there is no correlation between Ofsted rating and current level of overspend.18 This work also supports this in finding no evidence that spending pressure could be mitigated purely by more efficient management of children’s services.
That does not mean that local authorities which were deemed to require improvement did not face additional cost pressures. While established local authorities were facing pressures to maintain their broader range of services, local authorities needing to make immediate improvements, faced a trifold of cost pressures:
> A legacy of poor-management had left these authorities with a high cost base.
> A need to invest in their core-offer to improve their ability to safeguard children. Often these resulted in
a short-term reliance of agency staff, further inflating costs.
> The need to expand the range of non-statutory services offered, both to reduce the number of children
entering the statutory social care system, and to enable children and families to be ‘stepped-down’ from statutory services and continue to access some consistent support.
17 House of Commons: Housing, Communities and Local Government Committee (2019). Funding of local authorities’ children’s
services. Fourteenth Report of Session 2017–19. Available at: https://publications.parliament.uk/pa/cm201719/cmselect/cmcomloc/1638/1638.pdf; Local Government Association, Children's
care cash crisis. Available at: https://www.local.gov.uk/about/news/childrens-care-cash-crisis-nine-10-councils-pushed-red
18 National Audit Office (2019). Pressures on children’s social care. Available at:
14 Increased demand
All local authorities had encountered an increased demand for services, with most seeing a significant increase in the number of looked after children. This is borne out by national figures which show the number of children in care rising steadily since 2007.19
Discussions with councils suggested three universal factors behind this increase:
> A retrenchment from other agencies providing services to children or their parents, largely from the
voluntary sector but also police, NHS and schools. Council’s felt that when other services are not available, children’s services become the catch-all.
> A greater awareness of the harms experienced by teenagers. Previously, children’s services was
primarily seen as a service for newborns and infants. The child sexual abuse scandals changed the approach to vulnerable adolescents. There was both increased awareness of threats to children outside the home and a different level of expectation as to how agencies should respond.
> Because children’s services are supporting more adolescents, they are also supporting more children
with very complex needs, including high-levels of self-harming and substance abuse. These issues are not nearly so common with younger children in the care system.
It was believed that the underlying drivers of these pressures were within the wider population and included: deprivation, domestic violence and substance misuse.
Additionally, some local authorities were addressing specific issues causing demand to rise such as:
> Families with complex needs being moved into the area largely from London. Sometimes this was done
explicitly by another local authorities, sometimes families moved autonomously in response to changes in the benefits system such as the benefit cap or housing costs.
> The need to accommodate unaccompanied asylum seeking children. Some local authorities were
experiencing significant increases in the number of children needing support, particularly relative to their in-school population; and
> Home-school transport, which varied considerably due to geography.
Acute and high needs cost pressures
High-cost residential placements
All local authorities reported to that the most acute financial pressure is coming from the need to find specialist residential placements for children with significant additional needs. They stated these placements typically cost more than £4,000 a week and are usually for adolescents in residential homes who are self-harming and/or display violent behaviour. Often it was stated that these children will have significant mental health and/or learning difficulties and an increasing number appear to be children who need high levels of protection from external threats such as sexual or criminal exploitation and are at a high risk of going missing.
Councils saw the costs of placements as high due to them being specialist, requiring high staff ratios and significant therapeutic intervention. Yet councils highlighted that the quality of these interventions was hard to assess.
19 Department for Education (2018) Children looked after in England including adoption: 2017 to 2018. Available at:
15 Local authorities stated these costs are greatly exacerbated because of a shortage of placements stating that it was not uncommon to have multiple, and sometimes dozens, of authorities bidding for one placement. Several councils reported that spend on placements for children in care has increased by as much as a third over the past two years.
Specialist children’s homes cover a diverse range of placements, meeting very different needs. For this reason the homes themselves are highly specialised, making it very hard for a single local authority to forecast which placements they are likely to require. Councils suggested a need for better national and regional mapping and planning.
The shortage of placements also has a huge detrimental impact on children. The most consistent frustration from councils was a belief that the high costs incurred for residential placements were not delivering better outcomes for children. This did not mean that high-cost intensive placements could not be effective. There was widespread agreement on the need to increase the capacity of residential placements, and reform commissioning arrangements.
Other significant cost pressures
Some councils identified all
> Recruitment – this was particularly acute for social workers, but also for other professionals working
with vulnerable children including speech and language therapists and educational psychologists.
> Independent fostering agencies (IFAs) – were particularly putting up costs in some areas. The difficulty
for local authorities with a high reliance on IFAs was that having developed this market pattern, it was very difficult to reverse the pattern. Councils with very high use of in-house felt this was the result of a sustained effort over at least a decade.
High Needs
Visits to local authorities identified a dual pressure along with the pressures from the children in care budget, which was increases on the ‘high needs’ budget, that is, the support given to children with special educational needs and disabilities (SEND). The pressures identified were of a broadly similar nature: increased demand, particularly for more intensive support, including special schools and residential placements. Local authorities reported both increased demands for an education, health and care plan (EHCP) and a greater complexity of need for children on these plans. This in turn was placing great strain on the support delivered ‘pre-statutory’ to children with SEND without an EHCP, including the delivery of services to children pre-school age, and in-school support, such as behavioural and speech, language and communication support.
Pre-statutory, ‘Early Help’ support and Troubled Families Programme
While some councils believed that too much money was being spent on high-cost ineffective provision; all local authority stated they could identify ‘Early-Help’ services providing relatively low-cost and effective support. Yet there was significant frustration that these services at been cut – as shown nationally20 – and were at risk from further funding cuts.
20 Institute for Fiscal Studies (2018) Public Spending on Children in England: 2000 to 2020. Available at:
16 Early help support was structured in many different ways. Most local authorities offered graduated support, starting with open-access support, such as parenting programmes, usually accessed either through schools or community centres, normally through to a more intensive intervention such as domestic or substance abuse, often working in parallel to the Troubled Families Programme.
While there was significant variation and innovation between different areas. Broadly three elements were encountered:
> Firstly, it was vital to understand that the term ‘early help’, does not mean it is necessarily the first step
in children’s interaction with children’s services. Numerous local authorities emphasised the importance of early help as a ‘step-down’ down for families who have been within statutory services. Many areas also identified early-help as a long-term service for families with chronic issues, who simply could not cope without support. Because of this it was possible to have families within ‘early help’ who had more complex issues than some families where children were on Child Protection Plans.
> Secondly, all areas identified the Troubled Families Programme as a key element of the early help offer.
Most embed it within their early help offer and adapted it to suit local needs. This did not mean they did not need to supplement the programme with additional resources, but it did mean there was a mutual reliance between the two meaning cuts to one would undermine the viability of the other.
> Thirdly, this support was where local authorities were most likely to be working in partnership with
other agencies in supporting families. Several relied on the voluntary sector, other statutory agencies and even schools to deliver key parts of the work. Yet there was a lot of variation on what was provided by these agencies. For example, domestic violence interventions were sometimes paid for by adult services, the NHS, or children’s services.
A strong theme was the belief in the effectiveness of early help. While the Public Accounts Committee21 have strongly criticised the Department for Education for failing to properly understand the impact of early help, many local authorities felt they could demonstrate the effectiveness on the likelihood of families for accessing more intensive services.
Many councils also pointed out that these services were not just about safeguarding and preventing escalation into more intense, statutory services but were also critical to supporting families’ and a child’s wellbeing and development. They felt these interventions helped address underlying issues, rather than symptoms, and were delivered in such a way that enabled practitioners to develop positive relationships.
While local authorities were very positive about the impact of local early help and could point to a clear evidence base informing some of these interventions, for example the effectiveness of parenting programmes in supporting broader outcomes. As the Early Intervention Foundation has found,22 councils were not systematically monitoring or evaluating these interventions and none were doing it at a systemic level. The fact that nationally, there is no data collected on the spending on ‘early-help’ support; the number of children and families accessing them or their outcomes was a critical factor limiting this.
As a result, a key focus of the mapping work detailed in Chapter 3 was an attempt to identify the number of children supported by these services and what is spent on them.
21 Public Accounts Committee (2019) Transforming Children’s Services. Available at:
https://www.parliament.uk/business/committees/committees-a-z/commons-select/public-accounts-committee/news-parliament-2017/transforming-childrens-services-report-published-17-19/
22 Early Intervention Foundation (2019) Evaluating early help: A guide to evaluation of complex local early help systems. Available
17
What local authorities wanted
Local authorities who participated in this research were universally feeling the most acute cost pressures within statutory services, which they expected to continue to require more money over the next few years. The pressure was most acute in relation to looked after children who required specialist residential placements and children with EHCP in specialist provision. Yet all councils wanted to invest additional resources into pre-statutory and targeted support. Exactly what this looked like depended on the local area, but the issues most commonly identified were:
An expansion of family support to enable:
This included:
> More consistent support for families. A recurrent theme was the need to provide long-term help for
families with chronic issues. Councils believed that the current system, especially statutory services, incentivised short-term interventions for what were normally long-term issues. Consistent work, based on co-operative relationship between family and support worker, was believed to be needed to bring better outcomes for the children and family.
> Help to more families. All local authorities were aware of a cohort of children living in family situations
which were chaotic to a degree to which they were impeding the child’s development, but not posing a sufficient immediate threat to the child to warrant interventions. Given the resources, most local areas felt there was effective work which could be done to the benefit of these children.
Youth services
All areas had cut their youth service, some entirely. This is in line with a 60% cut in youth services nationally.23 This left children’s services with little contact with teenagers below statutory thresholds, and often without the tools to help influence these children’s lives. This particularly impacted on marginalised and isolated children who were in risky situations, but not in so much risk as to require a statutory intervention. Yet the absence of such support for children at low-risk, made it harder to work with children at high-risk. Most councils felt that if they were to re-build their youth service, they would not replicate the service previously put in place. But that effectively building up a new service would enable significant innovation.
Greater work with partners
In particular:
> Investment in the voluntary sector. As pressure within statutory services had increased, most areas (not
just children’s services) had reduced their funding for the voluntary sector. Most authorities were looking at ways to provide non-monetary support to the voluntary sector. It was widely acknowledge that the voluntary sector could be better placed to engage with some children and families, but it was also vital that they worked with the authority, shared risk and received challenge.
> More support for schools – the support schools was giving to children and families varied within and
between areas. That said, many local authorities believed they had good partnership working with
23 Spending on young people’s services has fallen by about 60% in real terms between 2009–10 and 2016–17. Institute for Fiscal
18 schools, particularly within the early help service. In some cases this extended to schools co-ordinating teams around the child. Engagement through schools was thought to drive self-referrals and
19
Methodology
Nine councils worked with the Children’s Commissioner to co-create a methodology to map the number of children with different forms or risks of vulnerability supported by their children’s services alongside the spend on these children identified in local authority financial data. Development of the methodology also included sector input from other local authorities, academics, government departments and expert stakeholders24 who advised on the challenges of understanding and measuring spending on vulnerable children and its relationship to levels of need.
We worked closely with our partner local authorities children’s services heads of finance, senior accountants, finance and information managers to develop a methodology using the data available. We established conventions that provided consistency on issues that could be approached in a range of ways. In future work the methodology will be revisited to assess a wide range of options but for this initial work it was important to establish a coherent and achievable framework.
Developing a framework for mapping
Using the Children’s Commissioner vulnerability framework of 71 types of vulnerability, need or risk25 a framework was co-developed with LAs to generate a tractable set of categories that could be used in the mapping exercise. This is shown in Figure 1 in terms of levels of support (represented by separate coloured headings) and within them categories of support (represented by the groups detailed beside each coloured heading and outlined in detail below). These categories were used in the mapping exercise. LAs estimated the total spend and the number of children supported within each category.
24 Many of whom are named in the acknowledgements of this report.
25 Children’s Commissioner (2018) Children’s Commissioner’s annual study of childhood vulnerability in England. Available at:
20 Mapping framework
[image:22.595.44.582.56.387.2]Level of support Categories of support included in each level of support
Figure 4 – mapping framework. Acronyms: Child Protection Plans (CPP); Educational Health and Care Plans (EHCP); Special Guardianship Orders (SGOs); Special Educational Needs (SEN).
Figure 1 is a visual presentation of a conceptual framework for categorising children in terms of need and nature of support. It was developed with LAs with the intention that it could be used consistently across councils participating in the work. Categories in the framework are in some respects different to those used by national and local government agencies. This was a deliberate attempt to emphasise the mapping of support for children with specific needs rather than services and programmes. Nevertheless, some categories are defined in this way. For example, the Troubled Families’ Programme.
There are a number of important limitations to recognise in understanding the mapping framework. It must be acknowledged that:
> It is not an exhaustive list of children’s needs, vulnerabilities and risks;
> In order to create tractable categories which could be used in the mapping, assumptions and
simplifications have been made on the nature and type of children’s needs and vulnerabilities. This was not intended to simplify or disregard the differences and complexities in children’s needs but to help create a consistent approach to mapping support by children’s services;
> Spend on children includes much more than spending by local authorities’ children’s services;
> Children can be in multiple categories at any one time and children move in, out and between different
categories and even levels at various different time points. Families might have children in multiple categories or levels;
• Looked after children in high cost residential placements and children with an ECHP in high cost specialist provision
•Looked after children including unaccompanied asylum-seeking children under the care of local authorities Acute
needs
• Statutory services to support children with CPP and an EHCP as well as young offenders.
High needs
•Children supported in a 'permanent' home: SGOs, care leavers and ongoing adoption.
Support for permanency
•To support 'Children in Need' who have reached a statutory threshold
Complex needs
• Including council 'Early Help' services, Troubled Families programme and children with SEN support.
Pre-statutory support
• Including behavioural, mental health and well-being and targeted early years and youth support.
Targeted Support
• Including school related and universal early years and youth support
Universal Support Highly acute
21
> The thresholds are different for different categories of support and are not entirely spend based. For
example, some categories include young people for whom councils have a statutory responsibility up to the age of 25 (such as children with an EHCP and care leavers), whereas in other categories the
responsibility is only to the age of 18; and
> Support was only included where it was given by children’s services with the aim of supporting children.
Some family level interventions that are not funded by children’s services may have been omitted.
Levels and categories of support
This section sets out a description – and in some instance rationale – for each level of support (represented by underlined headings) and within them definitions of the categories of support (bolded sub-heading) used in the mapping and throughout this report.
Highly acute
All LAs reported that the most acute financial pressure on children’s services budget was from specialist, residential placements for children in care with significant additional needs. Councils noted that these are often for children who are self-harming and or display violent behaviour who also have significant mental health and/or learning difficulties. An increasing number appear to be for children who need high levels of protection from external threats such as sexual or criminal exploitation; many of whom are at a high risk of going missing. Spend to support these children was high due to these being specialist placements, requiring high staff ratios and significant therapeutic intervention. They stated these costs are greatly exacerbated because of a shortage of placements and it is not uncommon to have multiple, and sometimes dozens, of authorities bidding for one placement.
Therefore, this category is separated out from the wider category of ‘looked after children’ and defined as:
> Looked after children in high cost residential placements: Children in care where the council spends
over £4,000 a week on in-house public or private placements; usually outside of the local authority. A spend threshold was given to create consistency across the LAs. However, it is acknowledged that spend will be impacted on by cost variations across the country.
Councils also highlighted the rising financial pressures on their high needs budget to support children with an Education Health and Care Plan (EHCP) needing specialist provision. Therefore, this category of children was separated out and defined as:
> Children with an EHCP in high cost specialist provision: children having a identified SEND with an EHCP
aged up to 25 (in line with LAs statutory responsibility) where the council spends over £1,000 a term-time week (38 weeks a year) for specialist provision. Again, a spend threshold was given to create consistency across the LAs; but it is acknowledged that spend will be impacted on by cost variations across the country.
Acute needs
> Looked after children: Children in care up to the age of 25 in line with LAs statutory responsibility who
are in placements in a children's home, are in semi-independent living or foster care up. This excludes looked after children in high cost residential placements.
> Unaccompanied asylum-seeking children: children or young people up to the age of 25 who have been
given unaccompanied asylum-seeking child status. This category was separated from looked after children due to the different statutory responsibilities and funding streams.
22 Statutory services to support children which includes the categories of:
> Children with an Education Health and Care Plans (EHCP): children or young people up to the age of 25
(in line with LA statutory responsibilities) who have an EHCP. This category excludes those in the SEND high cost specialist provision.
> Children with a Child Protection Plan (CPP): children or young people with Child Protection Plans (CPP).
> Young offenders: children or young people who have been convicted of a crime and for whom the LA
has statutory responsibility. Support for permanency
> Permanency: Children and young people who are being supported in a ‘permanent’ home that is not
with their birth parents.. This includes children who have been adopted; care leavers many of whom remain with foster parents through ‘staying-put’ arrangements and children who move into a ‘special guardianship order’(SGO) with their foster family, but to whom the local authority continues to make payments in lieu of a fostering allowance.
Complex needs
> Children in Need (CiN): children or young people who have been identified as a ‘Child in Need’ under
section 17 of the Children Act 1989 and on the Child in Need register. Pre-statutory support
The framework also captures support that is given to children who did not reach the statutory threshold for statutory services but to whom support is given for a similar type of need to the statutory support, namely:
> Early Help support: children or young people who have been supported by council’s ‘Early Help’ offer to
families. This includes a diverse array of services and interventions for families varies considerably between local areas. These range from parenting classes to long-term key worker support for families with chronic issues as domestic violence, substance abuse and could include services such as PAUSE. It could also include where families have been through a Multi-Agency Safeguarding Hub (MASH) or a Front Door assessment but have not been identified as a needing statutory support.
> Troubled Families Programme: children or young people who have been supported by the Troubled
Families Programme.
> SEN support: children or young people who have been identified as having a SEND but do not have an
EHCP. Targeted support
This level of support captures a range of diverse support that is aimed at definite groups or type of need but for children and families who have not been assessed to have crossed statutory thresholds.
These are grouped into four distinct categories based on types of need and the support provided to children:
> Targeted behavioural support: children in Pupil Referral Units and other behaviour,
attendance/exclusions related services. The category also includes children supported through Discretionary Learner Support and post-16 participation.
23 includes the two-year-old free early education and childcare entitlement. It also includes three and four year olds receiving support from the early years pupil premium as well as any support for pre-school children which was not directly funded through SEN support such as speech and language therapy. For some councils this included specific interventions or programmes via Sure Start and Children’s Centres that were not universal.
> Mental health and well-being support: support for children and young people for mental health issues.
This is mainly Tier 1 and 2 support rather than more acute CAHMS support which is usually NHS funded. It does however include spend by children’s services on jointly commissioned (with the NHS) mental health and well-being support. In addition, it includes well-being or pupil support as well as respite services for families and any support for young carers.
> Targeted youth support: targeted youth interventions or programmes including those for children ‘Not
in Employment, Education or Training’ (NEETs). This category also includes children supported by youth offending or prevention services and who have not been convicted, i.e. distinct from the young
offenders category. Universal support
This level of support captures the diverse range of universal support for all children. These are grouped into three broad categories based on children’s age or setting and the type of support provided:
> Universal school related support: support to schools by children’s services outside of the core function
schools performed on which children’s services have discretion, for example support for home to school transport, admissions, or music provision.
> Universal early years support: support for children prior to schooling such as the free early education
and care universal 15 hours entitlement (and 30 hours for working parents) for 3 and 4 year olds. It also included spend on universal elements of Sure Start and Children’s Centres.
> Universal youth support: support for all children of school age such as youth centres and out of school
or holiday activities and support.
Methodology for mapping spend
The nine local authority children’s services iteratively devised a protocol (summarised in this section) as well as a template for mapping the number of children in each group and what is spent on this group using finance data. Spend data allocation
Spend data was provided by local authorities via a list of all children’s services 2017/18 actual spend26 broken down by budget lines. Finance leads worked with service managers and business intelligence colleagues throughout their children’s services departments to allocate and apportion these budget lines to appropriate categories of support for children based on their judgement about local provision.
2017/18 budget actuals were used as the latest and most complete source of finance data available that had been audited and verified within local authorities.
26 Which included year end gross expenditure (split by: employee Related; Premises Related Expenses; Transport Related
24 Out of scope
All children’s services spending allocated to children for which children’s services had discretion on how funds were spent was in scope. There were two main types of children’s services spend that was considered out of scope and excluded from the spending estimates:
1) Spending beyond the remit of children’s services, for example, adult physical and sensory support or adult learning, which in some instances was funded from children’s services budgets.
2) Services for which children’s services did not have discretion over spend. This included:
i. Core spending by schools allocated to LAs from the Dedicated Schools Grant (DSG) and on Private Finance Initiative spending where children’s services did not have any influence over the allocation of this spending. Where children’s services did have discretion on DSG spending, these were made explicitly in scope. These included spending to support schools such as educational welfare services, Pupil Referral Units (PRUs) and home to school transport. ii. Public health spending where children’s services did not have discretion on spending, such as
health visitors. As with schools funding, only public health spend which directly funded children’s services programmes or services were children’s services had discretion on funding was included as in scope.
iii. Other non-discretionary items such as for children in families with no recourse to public funds or pensions and legacy redundancies.
Overheads
As the objective of the mapping was to get as much clarity as possible on the quantum of children’s services spend for each of the categories of children, all budget lines in scope (for which children’s services has discretion on spending) were allocated. This meant that some of the budget lines which would in other methodologies have been placed in overheads, were allocated to the associated category of children they supported. The remainder was apportioned to overheads, for funding over which children’s services did have discretion on spend but for which LAs were not able to allocate to a specific category of children. This was mainly formed of core corporate service spend such as human resources, information technology, legal, research and corporate systems change. This remaining unallocated spend on overheads was included in the total spend calculations as a separate category.
It is important to note that this does not provide a method for estimating true overheads relative to overall spend and instead is a method for obtaining the most accurate level of spend to support children in each category in the framework, which was the concern of this work.
Staffing spend
Spending on staff was allocated in one of two ways, both of which were included in the total spend calculations. 1) Frontline staff budget lines, for example social workers and family support workers were allocated to
associated categories of support for children by LAs. This included for example spending on
professional development, training and supervision. This was broken out into distinct categories if this was related to staff who clearly supported children with different level of support, based on discussions with children’s services managers who ran the services and staff in business intelligence. It was
25 accurate estimation of the level of spend in each category of support.
2) Spend on children’s services staff who were not part of frontline services were apportioned to the relevant support based on the same method as for frontline staff. LAs devised a list of staff spend that could not be assigned. This included safeguarding boards, heads of social care, commissioning and performance teams as well as chief social workers. To ensure consistency these were apportioned in an ‘unapportioned staffing’ spend category, included in the total spend allocations as a separate category as with overheads.
Gross/net expenditure and income/grants
The aim of this work was to estimate total children’s services spend on children based on their needs regardless of the source. Therefore, gross expenditure is used throughout as the main unit of financial data analysis. Information on income was collected and used to calculate net expenditure (gross expenditure minus income). We also estimated net expenditure inclusive of grants but minus income from internal charges and other local income. Findings on “net expenditure” and “net expenditure inclusive of grants” can be found in Annex 1 Table 16.
Methodology for estimating the number of children supported by category
In order to estimate the number of children supported in each category, council finance leads worked with service managers and business intelligence colleagues throughout their children’s services departments to obtain the most accurate local data source on the number of children. This was done for each category of children supported in financial year 2017/18 and corresponding to the age of the statutory remit of the support.27
It is important to note here that:
> Children can be in multiple categories at any one time and that children move into, out of and
between different categories and levels. Therefore, a degree of double counting, particularly between universal support and other categories of support, is inevitable.
> Steps were taken to ensure a consistent approach by having categories as distinct as possible from
each other. However, categories that included different sources of data either used: a) the numbers supported were added together where they were distinct from each other or b) the category with the largest number of children supported was used. For example, for early years this could be all those receiving the free early years entitlement in 2017/18. This will ultimately have led to some inconsistency, particular with poorer sources of data and could have resulted in an under- or over-estimation of the numbers of children within these categories.
> There will be some differences in the number of children supported between LAs due to the way
support is delivered. For example, universal youth support in some councils will only include youth centres, whereas in others it will also include support for holiday activities, youth parliaments, Duke of Edinburgh activities.
Data assessment
Local authorities used the most accurate source of data available to them to map the number of children within each category of support. To assess whether the source of data was an adequate representation of the number of children in each category a set of criteria was devised and data sources assessed by councils and the Children’s Commissioner.
27 For example, children’s services have a statutory requirement for children with an EHCP, unaccompanied asylum seeking
26 As shown in Table 1, the highest data sources were rated as ones which used data which represented all children on a full-time equivalent basis across the financial year (2017/18) that had received support as defined by the category in the framework. Data which represented support for children across the full financial year would be one level below with data which gave the number of children supported at one point in the 2017/18 financial year– a ‘snapshot’, usually a census date or at the end of the financial year – was categorised at a lower level. Data which was for a full financial year or a calendar year, but not for 2017/18 financial year was categorised as ‘adequate’ and data from a snapshot which was not 2017/18 was rated as ‘poor’.
Table 1- Assessment criteria for data on the numbers of children supported
Assessment level Threshold for assessment count28 % of total
Very good Full-time equivalent for 2017/18 financial year (FY) 14 8%
Good Data across 2017/18 FY 42 25%
Moderate Snapshot (either end of the FY or a census date) 72 42%
Adequate Data for a FY or calendar year of a different period 23 13%
Poor Activity data from a snapshot or constructed from other sources from a different time period 2 1%
NO DATA no level of data could be found for the category 18 11%
It should be noted that this assessment of data is not the same as data accuracy because errors of a different kind will result from the difficulties of allocating spend to specific groups of children. Future work will need to look at this in more detail.
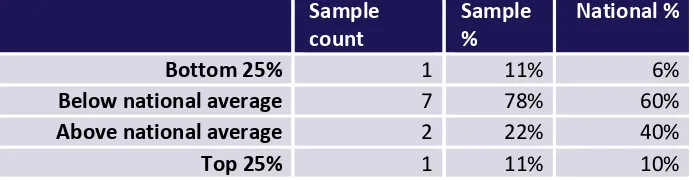
Overall, given that the data is from a wide range of sources, the level of data obtained rated as relatively good in terms of the observable characteristics in Table 1, although far from perfect. As shown in Table 1, added together, three quarters of the data was assessed as at or above a level of ‘moderate’, having data for 2017/18. A quarter of the data was assessed as below the level of ‘moderate’. Within this 13% was assessed as ‘adequate' (being across a year but of a different time period, usually 2018/19) and 11% where there was no data supplied by the local authority.
Table 2 sets out the assessed rating for each category across the sample of nine LAs. It shows that:
> Most LAs in the sample have a very good level of data on children the number of children in the social
care system, particularly in the more high needs categories such as children in care, unaccompanied asylum seeking children, children with a CPP and children supported in their ‘permanency’. This was understandable given the obligations on councils to report many of these to the Department for Education with many of these being linked to funding. This is also the case for children with an EHCP in high cost specialist provision, believed to be due to the small numbers of children in this group receiving very specialist support.
> Data on children with high needs support such as children having an EHCP, young offenders and
children identified as having SEN support is of a lower level but still assessed as ‘moderate’. Again, this was believed to be due to obligations on reporting to central government.
> Data on children supported by council’s ‘Early Help’ services, within the Troubled Families Programme
and children identified as a ‘Child in Need’ is much more irregular. This was believed to be because there was no census taken of these numbers with early help being made up of many services and
27 children could be receiving multiple numbers of these interventions.
> Data on early years and behavioural, and school related support is generally moderate, mainly due to
school and early years data returns which are linked to Department for Education funding. However, there is a large amount of missing data on the number of children supported by other targeted support such as mental health and well-being support and youth support. It was believed that this could partly be because of the multiple types of interventions and services in these categories, as well as the fact that many were often jointly commissioned with other agencies with reporting data in some instances not being held by children’s services.
> Universal youth support had the highest degree of missing data on the number of children supported.