Aust. 3. Soil Res., 1993, 31, 931-47
The Distribution of Sodic Soils
in Tasmania
R. B. Doyle and F.
M.
HabrakenDepartment of Primary Industry and Fisheries, P.O. Box 46, Kings Meadows, Tas. 7249.
Abstract
It is estimated that sodic soils (ESP>G) occupy a t least 23% of Tasmania's land area based on the present limited soil data set. Sodic soils are mostly restricted to lower rainfall areas (<800 mm/y) of eastern Tasmania, occurring primarily in the Launceston Tertiary Basin, the Derwent, Coal, Jordan and Huon River Valleys and on Flinders Island.
In Tasmania, sodic soils have formed predominantly from Triassic and Permian mudstones and sandstones, Tertiary clays and unconsolidated Quaternary deposits. However, profiles with sodic features have also developed above granite, Jurassic dolerite and Tertiary basalt. Sodic soils most commonly occur on lowland plains, river terraces and in valley floors.
In Tasmania, sodic soils are characterized morphologically by:
(i) abrupt separation of a sandy, bleached A2 horizon from a moderately sodic (ESP 6-15) clay subsoil;
(ii) coarse prismatic, columnar and/or angular blocky pedality in the subsoil, which may exhibit vertic properties;
(iii) hardsetting sandy A2 horizons in some profile classes;
(iv) fine sandy crack infills and clay-organic coatings on ped faces in the upper B2 horizon; and
(v) thick, sticky and greasy fine clay argillans on ped faces, and clay infills in cracks and other voids in the lower B2 horizon that contribute to reduced porosity and permeability.
Sodic soils in Tasmania have traditionally been utilized for pasture production with occasional cultivation for fodder crops and pasture renewal. Under a pastoral system, few sodicity problems have been recognized as such. However, in the last 10 years there has been increased cropping, particularly for poppies and more recently potatoes. Soil structure decline and drainage problems have become key factors limiting production.
Management problems are mainly due t o poor internal and external drainage, with poor structure in the A2 horizons which liquefy in winter and often set hard in summer. Salinity in associated drainage depressions is a problem gaining increasing recognition.
Keywords: Sodic, ESP (exchangeable sodium percent), hardsetting, dispersion, salinity, duplex soil, bleached A2, permeability.
Introduction
R. B. Doyle and F. M. Habraken
Fig. 1. Published soil survey coverage of Tasmania.
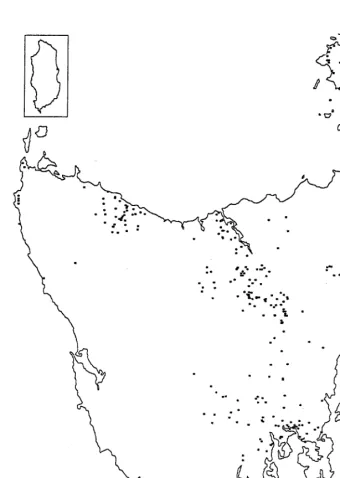
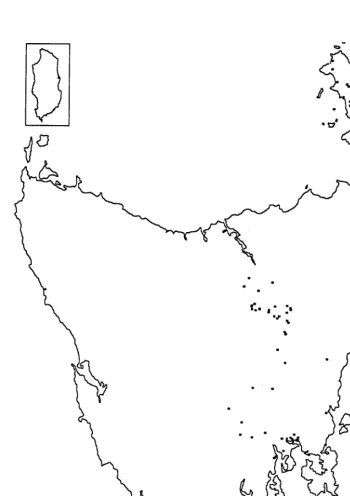
published soil surveys (Fig. 1) and only 306 soil profiles have analytical data (Fig. 3). To gain an understanding of the distribution of sodic soils in Tasmania,
[image:2.479.51.397.83.583.2]The Distribution of Sodic Soils in Tasmania
Various small scale soil maps of the State of Tasmania have been generated (Northcote 1962; Nicolls and Dimmock 1965: Wilson 1990). These maps appear t o be related. All seem to be based on the Northcote soil map of 1962 which was compiled jointly by Nicolls, Dimmock and Northcote. Although this map is a t a scale of 1 : 2000000 and is not able to show the high variability in the soil pattern typical of Tasmania, it is the only State-wide coverage presently available. The interpretations in this paper are based largely on re-interpretations of the Northcote 1: 2000000 map and 306 described soil profiles for which analytical data are available (Fig. 3, 274 CSIRO Division of Soils and 32 Department of Primary Industry and Fisheries).
Morphology and other Characteristics of Tasmanian Sodic Soils
For the analysis in this paper, sodic soils are defined as those with an ESP>6 in the upper B2 horizon or within 50 cm of the surface in profiles without B2 horizons. The majority of these soils are duplex soils with a distinct pale or bleached A2 horizon overlying a clay B2 horizon. The A1 horizons have a weak dry consistency and range from loamy sands to loams but overlie A2 horizons which commonly hardset in summer. Only 10% of analysed soils with sodic B2 horizons had an ESP>6 in the A1 or A2 horizon. Problenls with surface crusting or seedling emergence are rarely reported in Tasmania.
In addition to the duplex soils, some uniform and gradational black earth profiles have an ESP>G in the upper 50 cm. However, more urgent problen~s of flood inundation and salinity face these soils.
Most Tasmanian sodic soils are only mildly sodic. Of the total of 306 analysed profiles, 24% had an ESP>G in the B2 horizon, while only 8% had an ESP>15 in the lower B2 horizon, and less than 3% had an ESP>15 in the upper B2 horizon. Thus, although considerable areas of Tasmania may be affected by sodic soils, the ESP data and the general absence of sodic A horizons suggest that many are only weakly sodic.
Many duplex soils on terrace deposits, especially in the Midlands area, have distinctive sandy infills extending down cracks in the upper B2 horizon. Also in the upper B2 horizon, prominent, very dark brown, humus clay coatings occur, while deeper in the B2 and B3 horizons typically grey but also dark brown vertically elongated clay coatings and infillings follow old root channels, pores, and voids. These clay infills have a sticky and greasy feel and suggest translocation of fine clay is occurring even in medium-heavy clay subsoils.
In sandier materials, such as the Triassic sandstones, thick chocolate-coloured clay cutans coat peds in the B2 horizon and extend into the B3 and C horizons as distinct vertical clay veins.
R. B. Doyle and F. M. Habraken
B2 horizons, with mottling and very light grey or white matrix colours just above the B2 horizon, suggests water ponding and anaerobic conditions for prolonged periods in winter.
On terraces at higher elevations more acid and leached profiles have relatively even acid reaction trend (pH 5 S O (A1)-5.5 (A2)-6.0 (B2)-5.5 (B3)). The ESP is variable but generally greater than 6 and increases with depth in the B2 horizons. These soils have a more friable angular blocky B2 horizon and have been classified by earlier workers as lateritic podzolics, but ESP data suggest many should be classified as solodics and soloths. The oldest and most weathered of these soils, the Woodstock series (Nicolls 1958), commonly has a magnesic (Ca/Mg <0.1) B2 horizon and the clay mineralogy is dominated by kaolin minerals. The B2 horizons of these soils are commonly dispersive by the Emerson (1967) test, falling into classes 2(1)-(3).
Recognition and Classification, Past and Present
Currently Australia has three classification systems in use, namely the Great Soil Group system (Stace et al. 1968), the Factual Key of Northcote (1979) and the new Australian Soil Classification System being developed by Isbell (1992). In these systems, sodic soils have been variously classified. They are grouped as soloths, solodics, solodized solonetz, solonetz (Stace et al. 1968), various hardsetting-bleached A2-duplex soils (Northcote 1979), and most recently as sodosols or sodic subgroups and great groups of other orders (Isbell 1992).
The Northcote and Skene (1972) map of Australian Soils with Saline and Sodic Properties indicates that 24% of Tasmania is covered by areas of sodic soils. These are neutral and acid sodic soils. However, of 274 CSIRO Division of Soils profile descriptions with chemical data, only 9% are classified as sodic soils (soloths 4%, solodics 3% and solodized solonetz 2%). An additional 11%, currently classified as podzolics, humic gleys and black earths, have an ESP>G in the upper B2 horizon or within 50 cm of the surface. Of the 274 analysed CSIRO soils, 14% would now classify as sodosols, sodic kurosols, sodic chromosols or sodosolic hydrosols based on their duplex nature. Of the remainder, 4% classify as sodic vertosols and 2% as various sodic dermosols and kandosols.
The CSIRO Division of Soils data (274 profiles) and recent chemical data for the Coal River (22 profiles) and Lake River (32 profiles) areas suggest that many duplex soils with bleached A2 horizons have been classified as podzolics, rather than sodic soils. This also occurs in a recently published generalized soil map of Tasmania (Wilson 1990) in which sodic soils are absent. Instead, areas where sodic soils are present have been mapped as podzolic soils. This may have shown a bias inherent in the early work of Stephens (1941) where Tasmania was viewed as lying within the Podzol-Podzolic zone of soil formation (Prescott 1931, 1947). It was not until Leamy (1961) that soils were first mapped as sodic units in the dry (<GO0 mm/yr) central Midlands of Tasmania.
The Distribution of Sodic Soils in Tasmania
M E A N A N N U A L RAINFALL (Millimelres)
M E A N A N N U A L E V A P O R A T I O N ( ~ i l l i m e l r e r )
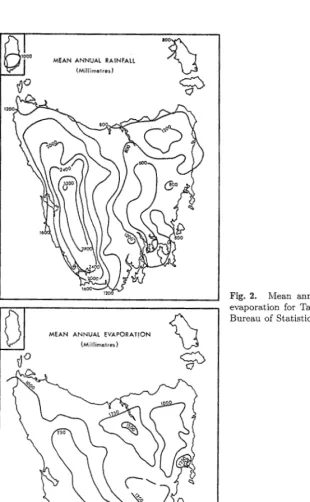
Fig. 2. Mean annual rainfall and evaporation for Tasmania (Australian Bureau of Statistics, 1985).
[image:5.488.44.355.74.577.2]R. B. Doyle and F. M. Habraken
Fig. 3. Location of soil profiles with analytical d a t a in Tasmania.
[image:6.481.48.388.74.552.2]The Distribution of Sodic Soils in Tasmania
Estimated Distribution of Sodic Soils in Tasmania
The key areas of sodic soils are in the eastern half of Tasmania, namely the Launceston Tertiary Basin, the Derwent, Jordan, Huon and Coal River valleys, and on Flinders Island. They are associated with Triassic and Permian sandstones and mudstones on the margins of these areas and on the Tertiary and more recent sediments within them. The mean annual rainfall is generally less than 800 mm/yr and annual evaporation greatly exceeds precipitation (Fig. 2).
On Flinders Island, several of the mapped soil associations are sodic. The Bootjack, Memana, Petibela, Quoin and Emita soil associations cover 34% of the area of the island. If the Quoin association is excluded, the area occupied by sodic soils reduces to 20%.
In the Lake River area, in the central Midlands, of 32 analysed profiles, just under 50% had an ESPY3 in the upper B2 horizon. Following the new Australian soil classification system (Isbell l992), the majority of these soils have been classified as sodosols, sodic kurosols or sodic chromosols and are associated with Tertiary clays, the remainder being sodic vertosols associated with late Quaternary alluvium, and sodosols and sodic dermosols associated with Permian and Triassic mudstones and sandstones. Problems of clay dispersion in B2 horizons, very slow permeability and surface flooding in winter are common on solodized solonetz (sodosolic or sodic hydrosols) of the Brumby soil association (Nicolls 1958). On higher older surfaces, Woodstock soils (Nicolls 1958 and 1960) have acid reaction trends (sodic kurosols) with moderate t o strongly dispersive. slowly permeable B2 horizons.
In the Coal River survey, in south-east Tasmania, Holz (1987) described 24 soil profile classes of which 10 were classified as sodic soils. The majority of these were previously mapped as 'Soils of Alluvial Deposits' (Loveday 1955; Dimmock 1957b) and thus were commonly not recognized as sodic soils.
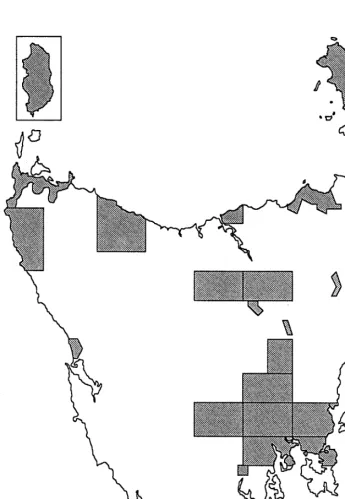
In order to assist the understanding of the distribution of sodic soils in Tasmania, several maps based on comparisons with Atlas of Australian Soils map units (Northcote 1962) and the 306 profiles with chemical data have been produced. It must be remembered that in the Atlas of Australian Soils the dominant soil group(s) named may cover only 60% of the map unit area (Northcote 1962). Hence the Atlas gives the overall picture of dominant soils alone, and it is on the basis of these map units that the interpretations and Figures in this paper have been made. Thus some of the Figures may overestimate the true extent of sodic soils. The first map (Fig. 4) is a plot of all soils with a hardsetting, bleached A2 horizon and a duplex profile. The Atlas (Northcote 1962) map units included are R c l , Rel, S2, Tb9-Tb13, Ubl, Ub9-Ub19, Wa2, Wa3 and Wdl-Wd4. The map is very similar to Northcote and Skene's (1972) map of soils with saline and sodic properties. However, it highlights areas of soils in the southern Midlands, King Island and additional areas on Flinders Island which are actually or potentially sodic. This map also indicates a belt of soils in the north-east of Tasmania which are not highlighted in subsequent maps (Fig. 6 and Fig. 7), possibly due t o lack of data in this area. This map suggests slightly more than 28% of the State's land area may be occupied by sodic soils.
938 R. B. Doyle and F. M. Habraken
Fig. 4. Soils with a bleached A2 horizon and duplex profile form. Map units Rcl, R e l , S2, Tb9-Tbl3, U b l , Ub9-Ubl9, Wa2, Wa3 and Wdl-Wd4 are shaded and cover 28% of Tasmania (Atlas of Australian Soils, Northcote 1962).
evidence of dispersion and slaking has been observed in road cuttings in north eastern Tasmania where Laffan and Grant* have mapped duplex soils with
[image:8.479.50.401.55.587.2]The Distribution of Sodic Soils in Tasmania
compact A2 horizons. The authors have noted problems of tunnel erosion in the north-east of the State on duplex soils associated with Permian and Triassic mudstones and sandstones, while Holz (pers. comm., APPM Tasmania) has noted the presence of strong duplex soils with thixotropic A2 horizons which hardset in summer on south-eastern King Island. While these observations support the existence of sodic soils in these areas, the distribution shown in Fig. 4 probably overestimates their true extent.
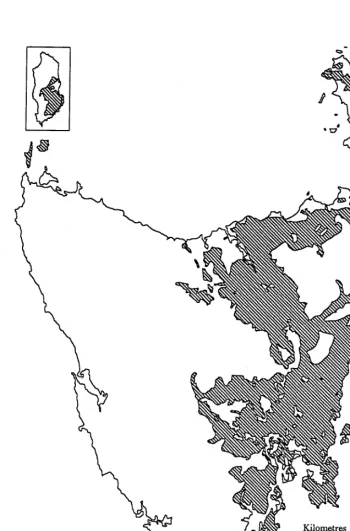
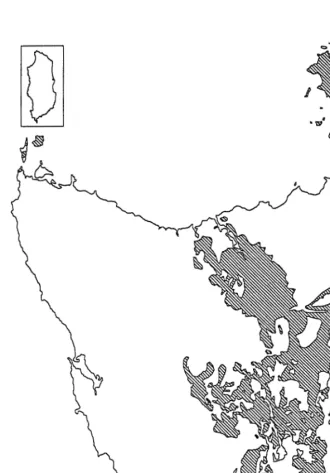
A map was produced to show the location of all profiles with an ESP>G in the upper B2 horizon (Fig. 5). A further map (Fig. 6) was produced by overlaying the 1 : 2000 000 Atlas coverage of Tasmania (Northcote 1962) on Fig. 5 and delineating the aggregate area. The aggregate shaded area is 23% of the State and includes the Atlas map units Abl, Acl, Cb22, E l l , Ke6, Ke7, Mdl, Qal, Rel, UblO-Ubl2, Ub14, Wa2, Was, Wcl, Wdl and Wd2 (see Fig. 6). In Fig. 6, it is noted that both King Island and north-east Tasmania are not shaded as areas with sodic soils; this is probably due to the absence of chemical data (refer to Fig. 3).
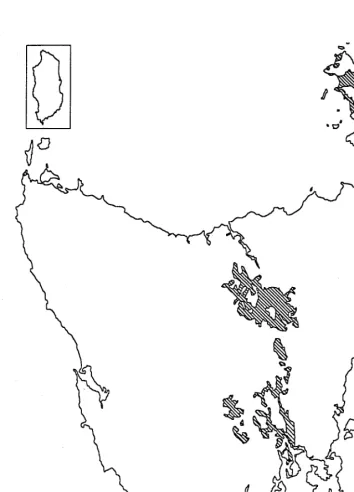
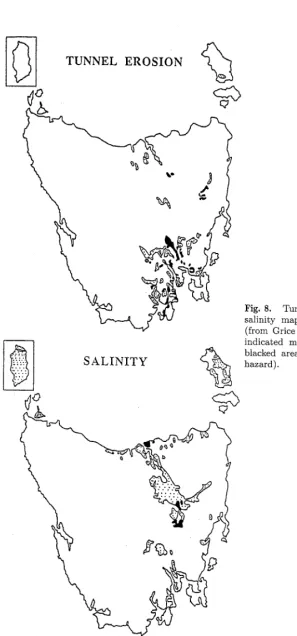
A further development of the map in Fig. 6, based again on Atlas map units, indicates that sodic soils with an ESP>15 in lower B2 horizons cover 18% of the State and have a similar distribution to that shown in Fig. 6. This supports the view that, in many sodic soils in Tasmania, ESP increases gradually with depth. In an attempt to focus on the strongly sodic soils likely to hold significant land management implications, a further selection was undertaken. Fig. 7 shows the area of Atlas map units containing soil profiles with an ESP>15 in the upper B2 horizon. The aggregate shaded area of strongly sodic soils covers 4% of the State and includes Atlas map units E l l , Q a l , Ub12, Ub14, Wdl and Wd2. Interestingly, this map correlates closely with the main areas of salinity and tunnel erosion mapped recently by Grice (1991; Fig. 8).
Although this analysis is approximate and heavily reliant on the Atlas of Australian Soils (1962) and available chemical data, it does give a clearer picture as to the distribution of sodic soils in Tasmania. It represents the best current estimate of the distribution of these soils and suggests areas where further soil analysis should be undertaken. This information provides regional land managers with a focus, Fig. 7 being of prime importance.
Management Problems in Tasmania
Waterlogging, tunnel and gully erosion, and salinity are the key problems associated with sodic soils in Tasmania. Many of these problems stem from the poor structure, very low permeability and dispersive nature of the B2 horizon of these soils.
In Tasmania, heavy textured subsoils which impede root development and water movement are common. Many of these clayey subsoils have probably formed due to dispersion of clay and consequent translocation to the B2 horizons as suggested by field morphology (presence of clay skins, clay veins and dispersive clay).
R. B. Doyle and F. M. Habraken
Fig. 5. Distribution of analysed soil profile with ESP>G in the upper B2 horizon (note: data set limited to 306 soil profiles, see Fig. 3).
[image:10.479.47.398.74.571.2]The Distribution of Sodic Soils in Tasmania
-
D
0 2 0 4 0 M )
Fig. 6. Distribution of Atlas of Australian Soil map units containing analysed soil profile
with an ESP>6 in the upper B2 horizon, map units include Abl, Acl, Cb22, Ell, Ke6, Ke7, Mdl, Qal, Rel, UblO-Ubl2, Ub14, Wa2, Wa3, Wcl, Wdl and Wd2; shaded area is 23% of
Tasmania (after Northcote 1962).
[image:11.484.45.375.72.545.2]R. B. Doyle and F. M. Habraken
Fig. 7. Distribution of AtIas of Australian Soil map units containing soil profiles with a n ESP>15 in the upper B2 horizon. Map units include Ell, Qal, Cb12, Ub14, W d l and Wd2; aggregate shaded area is 4% of Tasmania (after Northcote 1962).
[image:12.481.31.385.73.565.2]The Distribution of Sodic Soils in Tasmania
[image:13.482.51.348.81.716.2]R. B. Doyle and F. M. Habraken
Sheep
Dairy Cattle
Sheep
&Sheep
-
Beef
Dairy
-
Beef Cattle
Sheep
-
Beef Cattle
Intensive Crops/Horticulture
Beef Cattle
C]
Non agricultural areas
[image:14.479.44.393.79.644.2]The Distribution of Sodic Soils in Tasmania
and needs to be undertaken with an understanding of their chemical properties and potential dispersivity.
Stephens (1935) noted soil problen~s related to apple tree growth in the Huon Valley on duplex soils of alluvial tenaces. Waterlogging in winter and drought in summer lead to root destruction and subsequent transpiration overloading, resulting in lesions on the fruit. Stephens commented that attempts to deep rip the soils in winter, to remove excess water, led to further root damage. The hilling of topsoil to form beds for improved drainage and reduced root rot has lowered crop losses. The current practice is to avoid planting orchard trees in sodic duplex soils on flat sites. Instead, new plantings are on the flood plain soils (black earths) immediately adjacent to the rivers, or on sloping sites which have good lateral drainage. Some crop losses are still experienced due to over irrigation of orchards on duplex sodic soils in the Huon and Derwent areas (Boucher, pers. comm., DPIF Tasmania).
A severe problem with many sodic soils is the dispersive nature of the B2 horizons. As a result many sodic soils occurring on hilly landscapes in Tasmania have suffered severe soil erosion. Problems of tunnel and gully erosion have occurred on hill country in north-east Tasmania, and on the north-eastern edge of the Great Western Tiers bordering the Launceston Tertiary Basin (Grice 1991; Richley, pers. comm., DPIF Tasmania). Serious tunnel and gully erosion has occurred in the south-east of the State in the Derwent, Jordan and Coal River Valleys in soils associated with Permian and Triassic mudstones and sandstones (Richley 1992). Surface drainage on some sodic soils in the Coal River Valley has been followed by rill and gully erosion (Richley, pers. comnl., DPIF Tasmania). Farm dam failure is a problem which is often related to the presence of sodic soils with dispersive subsoils. Piping or blow-outs in dam walls is common to these soil materials and chemical ameliorants such as hydrated lime and gypsum have been used to reduce dispersion. Tunnel erosion problen~s associated with sodic soils have exposed buried Telecom optical fibre cable in Tasmania, costing $10000 to restore and stabilize (Richley 1992). A method for minimizing erosion along the cables by using fine sand filters has been adopted, along with on-going monitoring and maintenance (Richley 1992). Erosion associated with local building and roading projects has also been problematic. Areas of tunnel and gully erosion have been stabilized by fencing off. along with deep ripping to break up tunnels, gypsum application and by re-establishment of pastures (Richley, pers. comm., DPIF Tasmania).
Conclusions
R. B. Doyle and F. M. Habraken
Due to the dominance of pastoral enterprises in areas of duplex sodic soils, many of their unfavourable properties have not been fully highlighted. However, moves into increased potato and poppy production have not been without problems. Farmers have attempted to utilize deeper, sandy profiles with better drainage where possible, but these areas are limited. Only a few problems of seedling emergence on finer textured and shallower topsoils have been reported. Orchardists either avoid these soils or mound soils to aid drainage. Problems of tunnel erosion and farm dam failure have been largely confined to hill country duplex sodic soils associated with Permian and Triassic sediments. However, caution is required in the artificial drainage of sodic soils on flatter sites due to the presence of dispersive B2 horizons and associated risk of erosion.
Acknowledgments
The authors wish to thank Lindsay Richley, Mike Laffan, John Beattie and Kathy Noble for discussions on this subject and for reviewing parts of this manuscript and Toni F'urlonge for assistance with some of the figures.
References
Australian Bureau of Statistics (1985). 'Tasmanian Year Book No. 20:1986.' (Valentine Graphics: Melbourne.)
Dimmock, G. M. (1957a). The soils of Flinders Island, Tasmania. CSIRO Aust. Division of Soils, Soil and Land Use Series No. 23.
Dimmock, G. M. (1957b). Reconnaissance soil map of Tasmania, Sheet 75 Brighton. CSIRO Aust. Division of Soils, Divisional Report 2/57.
Division of National Mapping (1982). LAtlas of Australian Resources, Third Series, Volume 3, Agriculture.' (Commonwealth Government Printer: Canberra.)
Emerson, W. W. (1967). A classification of soil aggregates based on their coherence in water. Australzan Journal of Sod Research 5, 47-57.
Grice, M. S. (1991). 'Soil and Land Degradation Assessment of Tasmania.' (Department of Primary Industry and Fisheries, Tasmania.)
Holz, G. K. (1987). Soils of part of the Lower Coal River Valley Tasmania. Department of Agriculture Tasmania.
Isbell, R. F. (1992). A classification system for Australian soils (second approximation). CSIRO Aust. Division of Soils. Townsville.
Leamy, M. (1961). Reconnaissance soil map of Tasmania. Sheet 61 Interlaken (eastern half). CSIRO Aust. Division of Soils, Divisional Report 6/61, Adelaide.
Loveday, J. (1955). Reconnaissance soil map of Tasmania, Sheet 82 Hobart. CSIRO Aust. Division of Soils, Divisional Report 13/55, Adelaide.
Nicolls, K. D. (1958). Reconnaissance soil map of Tasmania, Sheet 47 Longford. CSIRO Aust. Division of Soils, Divisional Report 14/57, Adelaide.
Nicolls, K. D. (1960). Erosion surfaces, river terraces and river capture in the Launceston Tertiary Basin. Pap. Proc. R. Soc. Tas. 94, 1-12.
Nicolls, K. D., and Dimmock, G. M. (1965). Soils. In 'Atlas of Tasmania-With Descriptive Text and Index'. (Lands and Surveys Department, Hobart.)
Northcote, K. H. (1962). Atlas of Australian Soils, Explanatory Data for Sheet 2, Melbourne- Tasmania Area. (CSIRO Aust. Melbourne Uoiversity Press: Melbourne.)
Northcote, K. H. (1979). 'A Factual Key for the Recognition of Australian Soils.' (Rellim Technical Publications: Adelaide.)
Northcote, K. H., and Skene, J. K. M. (1972). Australian soils with saline and sodic properties. CSIRO Aust. Division of Soils, Soil Publ. No. 27.
Prescott, J. A. (1931). The soils of Australia in relation t o vegetation and climate. CSIRO Aust. Bulletin No. 52, Melbourne.
T h e Distribution of Sodic Soils in Tasmania
Richley, L. (1992). Minimising erosion hazard due to installation of a n optical fibre cable through dispersible clay soils. Aust. J , Soil Water Cons., 5, 35-8.
Stace, H. C., Hubble, G. D., Brewer, R., Northcote, K. H., Sleeman, J. R., Mulcahy, M. J., and Hallsworth, E. G. (1968). 'A Handbook of Australian Soils.' (Rellim Technical Publications: Adelaide.)
Stephens, C. G. (1935). The apple growing soils of Tasmania Part 1-A general investigation of the soils. Council for Scientific and Industrial Research, Bulletin No. 92.
Stephens, C. G. (1941). The soils of Tasmania. Council for Scientific and Industrial Research, Bulletin No. 139, Melbourne.
Wilson, R. (1990). Soils and soil erosion. In 'Behind the Scenery'. (Eds A. P. Scanlon, G. J. Fish and M. L. Yaxley.) (Department of Education and the Arts, Tasmania.)