Perceptions, values and behaviour: The case of organic foods
Mette Wier, KVL
Laura Mørch Andersen, AKF,
Katrin Millock, CIRED,
Katherine O’Doherty Jensen, KVL
and
Lars Rosenkvist, KVL
Abstract
1. Introduction
Consumption of organic foods has been increasing throughout Europe, not least in Denmark (Giraud, 2003; Hamm, 2002; Wier and Calverley, 2002). Fifteen years ago, organic food was mainly perceived as offering ‘public good’ attributes such as being environmentally friendly and ensuring animal welfare (Beckmann, 2001). However, there are several indications that current demand is focussed upon ‘private good’ attributes, such as personal health, taste and other quality attributes. It is unclear at present to what extent these differ-ent priorities reflect the questions posed by researchers at differdiffer-ent periods of time, differences in the charac-teristics of early and later adopters of organic food, or the fact that consumer priorities may themselves have changed (cf. Schifferstein & Ophhuis, 1998; O’Doherty Jensen et al. 2001). In addition, increasing concern about food safety, partly driven by the threat of food scandals during the 1990s and later, may play an impor-tant role (cf. Beckmann, 2001; Briz and Al-Hajj, 2003; Mitchell, 1998; Richter et al., 2000, Storstad and Bjørkhaug, 2003). This view is supported by the finding that negative information about a conventional product affects consumers who have only an intermediate level of interest in organic foods (Grankvist el al. 2004), thereby encouraging more consumers to purchase organic products.
The question is to what extent the current high level of demand is primarily sustained by en-vironmental and animal welfare concerns or by food safety and quality concerns. This is a crucial issue inso-far as any assessment of market development rests upon the identification of underlying purchasing motives. If increasing demand is due to increasing food safety concerns, the recurrence of food scandals in conven-tional food production may be a determinant of future growth. Similar scandals in the organic sector might also have a serious impact on the level of demand. If, however, increasing demand is due to increasing envi-ronmental and animal welfare concerns, future growth in the organic sector may be vulnerable to expanding low-input farming in conventional food production. The Danish market for organic foods functions relatively well and does not suffer from serious supply shortages or other barriers to growth, often identified in other markets. For this reason, analysis of the Danish organic market may provide valuable information about prospects for organic food markets in other countries.
The study reported here reveals the underlying motives for purchasing organic foods in Denmark. It is possible to collect and analyse reliable and detailed data on the food purchases of Danish households. Our study distinguishes itself by being based upon household level observations of registered behaviour regarding a large number of organic and conventional foods during 1997-2001, and upon survey data from the same households reporting their stated values, motives and concerns. This combination of data enables us to explore relationships between reported views and actual behaviour. Some of the main barriers to purchasing organic food are identified and, since we had expected that trust would play a key role in this context, we also examine the manner in which trust in labelling and in different types of organic producers, suppliers and products are related to the demand for organic products.
have been published previously. The few exceptions are Armand-Balmat (2002), Brombacher (1992), Glaser and Thompson (1998, 2000) and Jörgensen (2001), who have used sales data from Marketing Research Insti-tutes in Germany, USA and Sweden, respectively. Almost all previous studies on organic foods are based solely on postulated behaviour, i.e. stated willingness to pay (see e.g. Beharrell and MacFie, 1991; Bugge and Wandel, 1995; CMA, 1996; Coopers and Lybrand Deloitte, 1992; Drake and Holm, 1989; Fricke, 1996; Grunert and Kristensen, 1995; Jolly, 1991; Krämer et al., 1998; Misra et al., 1991). However, stated willing-ness to pay may not reflect actual behaviour (Cook 1991; Kramer 1990; Carson et al. 1996; Cummings et al., 1995; Frykblom, 1997; Hansen and Sorensen, 1993).
2. Methods, concepts and data
Consumer utility is derived from consumption of goods, or rather from specific characteristics or quality at-tributes of goods. According to Lancaster (1994), each good can be distinguished by different characteristics in different proportions, i.e. bundles of attributes. Some attributes are product specific (taste, freshness, tex-ture, nutritional benefits, etc) and can only be enjoyed when eating a specific product. Other attributes, how-ever, may be perceived as “general”, in the sense that they are offered by one good as well as another. In the case of organic goods, this may hold for attributes such as animal welfare, environmental attributes and to some extent health attributes. The consumer may wish to reduce environmental loading, for example, by purchasing both bread and apples from environmentally friendly production units.
In the following, we distinguish various types of product attributes or more general values or benefits. First, we distinguish between private and public goods. Private goods can only be consumed by one household (e.g. an organic potato can only be eaten once, in one household). In contrast, public goods can be shared (held in common), such that the utility of their consumption by any one household is independent of (and does not exclude) consumption by other households.
Second, consumers who actually purchase organic foods (buyers) may obtain ‘use values’, such as utility from taste, health and freshness, i.e. private good attributes, which can only be enjoyed by ac-tually consuming (eating) the product. In our study, ‘non-use values’ are defined as public good values re-lated to improved environment and/or animal welfare. Other non-use values, not directly treated in this study, are existence value (utility from knowing organic farming exists), vicarious value (utility from indirect consumption, e.g. reading about or watching a television program on organic farming), bequest value (utility from preserving organic farming for future generations), and altruistic value (utility from knowing other households are achieving utility). Finally, a further type of value is the ‘option price’, i.e. the value of having the possibility of consuming organic foods at some time in the future (Freeman, 1993).
We employ household panel data provided by a market research institute, GfK Denmark, en-compassing more than 2000 households’ purchases of daily necessities during 1997-2001. Approximately 20% of the sample is replaced each year, and the panel is continuously balanced to ensure a representative sample of Danish households. All data are self-reported. Each household fills in a shopping diary, which is collected and checked by GfK Denmark at regular intervals. The households report product characteristics at a detailed level (type, brand, scanner-code, volume, units, price, organic/non-organic), as well as store choice, date and time of purchase. In addition to these data, GfK registers background information regarding household composition, including the age, gender, education, occupation and income of all household mem-bers, as well as geographical location, type and ownership of the home. Further information about this data set is provided by Andersen (2001). For information about the distribution of socio-economic characteristics and representitativeness of the households, see Andersen (2002).
Data regarding purchases are supplemented by survey data obtained by questionnaire (avail-able at www.akf.dk/organicfoods) and addressed to all households in the same GfK panel. Information re-garding attitudes, perceptions, values and food habits were obtained from 1609 households, corresponding to a response rate of 77%. The survey data focussed particularly on product perceptions, the valued attributes of organic foods as declared by respondents. It is the combination of these two sources of information from the same households that make our data set unique.
In the present study, we apply various statistical methods. To test significant differences be-tween user-groups, we apply the Likelihood Ratio test for independence in the cross tabulation of responses to specific questions by buyer/non-buyer status. The test compares the observed distribution with the pected distribution under the assumption that the answers are independent of buyer/non-buyer status. To ex-plain actual purchasing behaviour, we apply econometric household level demand modelling. Each house-hold’s expenditure function is represented by the AIDS-model (Almost Ideal Demand System, introduced by Deaton and Muellbauer, 1980), in which the optimal budget share for each commodity can be found as a function of relative prices and consumer budget (cf. Hansen, 2005). In the present paper, the main focus of analysis is upon household characteristics (stated values and socio-demographic variables). We employ two approaches to this analysis. First, we explain household organic budget share by household characteristics, assuming that all households within a region are offered an identical range of prices on that market. Second, we explain each household’s deviation from the average organic budget share, estimated as part of the AIDS model, by household characteristics. In both cases, we apply the ordinary least squares estimator, since we are dealing with linear single equation models under the assumption of normal residuals. For more informa-tion on statistical methods and modelling, see Hansen (2005) and Wier et al. (2005).
3. The Danish organic food market
back at the 1998-level, as illustrated in Figure 1 (boldest line). Dividing consumers into four groups accord-ing to organic budget share provides additional information on differences between buyer groups. We define heavy users as consumers having an organic budget share (all food types) higher than 10%, medium users as
[image:6.595.72.448.229.461.2]consumers having an organic budget share between 2.5% and 10%, light users as consumers having an or-ganic budget share lower than 2.5%, and finally non-users as consumers who do not purchase oror-ganic foods at all.
Figure 1. Average organic budget share and distribution of user types, 1997-2001
0 10 20 30 40 50 60
1997 1998 1999 2000 2001
Share of all users (%)
0 1 2 3 4 5 6
Organic budget share (%)
Medium users
Heavy users
Non users Average Budget share
Light users
Note: Average organic budget share is calculated quarterly. Share of all users is calculated yearly.
Source: Own calculations based on GfK purchase data 1997-2001
Figure 1 shows that by 2001 almost every second consumer (48%) was a light user and 28% were medium users. Only 10% never purchased organic foods, while 14% had a very high consumption (heavy users). The share of non-users had decreased continuously during the period 1997-2001, while more consumers had become medium and heavy users during that period.
Market anatomy
Organic budget shares vary considerably between product types. The 25 most sold organic products in 2001 are shown in Table 1. The first column shows the average organic budget share by product types. The second column shows the average price premium for organic products compared to conventional variants
Table 1. Average organic shares by user types and product types (%), 2001.
Average organic budget share price pre-mium (Mix cor-rected)* Share of total organic sales
Organic budget shares by user types…
(%)
Total organic sales by user type…
(%) (%) Light user Medium user Heavy user Light user Medium user Heavy user Total Sales
Milk 27.5 1.15 34 4.9 45.4 85.0 9 43 48 100
Oatmeal 24.7 1.15 1 8.8 32.4 67.4 17 38 45 100
Eggs 22.2 1.40 8 6.4 34.7 60.5 15 45 40 100
Carrots 18.8 1.46 3 6.7 22.6 48.4 17 37 46 100
Flour 13.8 1.72 1 1.7 14.8 55.3 6 29 65 100
Fresh pasta 12.1 1.46 0 5.4 13.9 21.0 18 38 44 100
Onions 8.8 1.47 1 2.7 9.1 29.8 15 31 53 100
Rye bread 7.1 1.42 4 2.2 10.0 25.3 17 37 46 100
Butter 6.0 1.39 3 0.3 3.6 38.5 3 15 82 100
Other vegetables 5.8 1.28 6 0.7 2.8 22.6 6 15 79 100
Dry pasta 5.0 1.75 0 1.2 4.2 18.3 12 22 66 100
Yoghurt 4.8 1.13 2 0.8 3.6 24.8 9 23 68 100
White bread 4.4 1.28 5 1.4 6.5 14.4 17 41 43 100
Potatoes 4.4 1.25 2 1.3 5.6 15.3 16 38 47 100
Coffee 4.2 1.29 3 0.3 3.8 27.1 3 25 72 100
Bisquits, Cakes etc. 3.1 1.31 2 1.2 4.2 9.0 22 38 40 100
Cheese 3.0 1.31 5 1.0 3.3 11.3 16 32 51 100
Fruit 2.9 1.53 5 0.5 1.6 12.4 9 17 74 100
Other cereals 2.7 1.13 1 0.7 3.6 8.6 13 35 52 100
Juice 2.2 1.76 1 0.3 2.4 12.1 7 29 64 100
Beef 2.2 1.09 3 0.2 0.9 14.2 5 12 83 100
Other meat 1.9 1.34 2 0.1 1.6 12.0 3 23 75 100
Pork 1.6 1.56 2 0.1 0.5 13.1 3 8 88 100
Frozen vegetables 1.0 2.15 0 0.2 1.1 5.0 14 29 57 100
Other foods 0.8 1.37 6 0.2 0.7 3.6 13 26 61 100
Total 4.4 1.31 100 0.9 5.2 18.1 11 34 56 100
Heavy user 18.1 1.3** 56
Medium user 5.2 1.2** 34
Light users 0.9 1.2** 11
4.4 1.3 100
* Average price premium is corrected for differences in product mix between organic and conventional consumption within this product group. The price premium is estimated for the organic consumer basket. This adjustment is necessary, since a large num-ber of conventional products are not available in an organic variant on the Danish market. However, average price premium is only partly corrected for differences in product mix between organic and conventional consumption within each product group, since some quality differences are not observable in our purchase data set.
**Average price premium is not mix corrected Source: Own calculations based on GfK purchase data
of that product. These price premiums are mix corrected. That is to say, figures are corrected for differences in product mix between organic and conventional consumption within this product group (see table note). The third column shows the share of total organic sales by product type. The following three columns show organic budget shares according to user groups and, finally, the last 4 columns show shares of total organic sales by user groups.
fraction of the total consumption of these organic products. In contrast, medium and light users are responsi-ble for more than half the consumption of organic milk, oats, eggs, carrots, fresh pasta, rye and white bread, as well as potatoes. These groups hold lower organic budget shares than heavy users, but since they also con-stitute a large fraction of all consumers, they contribute considerably to total consumption.
Organic price premiums vary considerably between product types. Highest premiums are ob-served for frozen vegetables, juice, dry pasta and flour – all of which are primarily purchased by heavy users. Lowest premiums are observed for milk, oats, potatoes, and white bread – all of which are primarily pur-chased by light and medium users. Thus, heavy users on average pay higher premiums for organic foods than do medium or light users (see lowest part of the Table).
Interestingly, some differences in the general diet pattern (organic as well as conventional products) can be observed between the four user groups (not shown in Table). Thus, demand for fruit and vegetables increases significantly with organic budget share, and correspondingly, demand for meat de-creases. These differences may reflect a higher level of health concern among organic buyers. There is also some evidence suggesting that heavy users of organic food may finance some of their organic consumption by reducing consumption of expensive foods such as meat (O’Doherty Jensen et al., 2001; Torjusen et al. 2004b).
Stability of household demand
The average organic budget shares for all types of organic foods (aggregated) were relatively stable within each user group during the period 1997-2001. Underlying average aggregated developmental trends, how-ever, shifts in product consumption and considerable differences between user groups can be observed. For example, the reduced overall organic share during 1999 was primarily due to decreasing demand for organic meat, bread and other cereal products, as well as such dairy products as butter, yoghurt and cheese. In con-trast, the consumption of organic milk and coffee had increased, while demand for organic eggs, fruit and vegetables remained relatively stable during the period. Moreover, these changes in consumption can be bro-ken down by changes in the behaviour of specific user groups. For example, increasing consumption of milk is primarily prevalent among light and medium users, while heavy users are mainly responsible for the grow-ing demand for organic coffee.
increasing share of all consumers, and also exhibited a stable overall average organic budget share during 1997-2001.
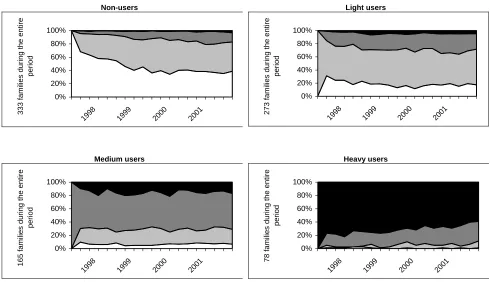
Figure 2 Development in user types depending on base user type
Non-users 0% 20% 40% 60% 80% 100%
1998 1999 2000 200 1
333 families during the entire
period Light users 0% 20% 40% 60% 80% 100%
1998 1999 2000 2001
273 families during the entire
period Medium users 0% 20% 40% 60% 80% 100%
1998 1999 2000 200 1
165 families during the entire
period Heavy users 0% 20% 40% 60% 80% 100%
1998 1999 2000 200 1
78 families during the entire
period
Source: Own calculations based on GfK purchase data, April 1997 to December 2001. Only households that participated during the whole observation period are included.
Similarly, households that were non-users in 1997 increased their demand for organic foods considerably, such that more than half of these households had become light or even medium users by 1999. However, from 1999-2001, no such major changes occurred. In addition, demand increased steadily among households that had been light or medium users in 1997, such that a significant proportion had become new heavy users by 1999. But again, as new households entered the groups of light and medium users, they con-stituted an increasing proportion of all households, and average organic budget shares remained relatively stable for these groups.
Weatherell et al. (2003) suggest that consumers appear to change concerns and attitudes over time – and that consumer choices are capricious, as more pragmatic priorities and trade-offs are prevalent and frequently influence purchasing decisions. This pattern of changing purchasing behaviour is strongly confirmed in our study.
4. Trust: the importance of sales channels and labelling
Table 2 shows the total sales of the 25 main organic products by retail sales channels, revealing that the ma-jority of products in most food groups are sold through supermarkets (58% on average). Discount stores comprise the second largest sales channel, accounting for 25% of all sales. Only 9% are purchased through direct sales channels (farm gate/shops, market stalls, box schemes, etc), while the remaining 8% are pur-chased through other sales channels such as specialty stores (baker, butcher, green grocer, health store), ki-osks, small shops or tank stations.1
Considerable differences can be observed between product types. Some products are almost exclusively sold through supermarkets (including discount stores). This holds for milk, oats, flour, dry and fresh pasta, butter, yoghurt and other cereals. In contrast, eggs, white bread, potatoes, other vegetables, fruits and in particular various types of meat are to a large extent sold through direct sales channels and specialty shops.
There are also some striking differences between user groups (see lower section of Table 2). Heavy users exhibit the highest propensity to purchase organic foods through direct sales channels, doing 14% of their shopping in this way. In fact, 77% of organic goods sold through direct sales channels are pur-chased by heavy users (not shown in Table 2). Nevertheless, heavy users do most of their shopping in su-permarkets and discount stores (57% and 20% of purchases, respectively). Medium users and light users spend approximately two thirds of their organic budget in supermarkets and one third in discount stores.
Thus, supermarkets constitute the major sales channel for organic foods, including a consid-erable share of products sold in discount stores. This factor also appears to constitute an important precondi-tion for achieving a high level of organic sales. A number of studies (Vogtmann, 1988; Haest, 1990; Sylvan-der, 1995; Bugge and Wandel, 1995; CMA, 1996; von Alvensleben and Altmann, 1986; Krämer et al., 1998; Menghi, 1997; Hack, 1995) note that one of the most substantial barriers to market penetration is the diffi-culty of locating and identifying organic products when only few products are regularly on sale in supermar-kets. A considerable number of European markets for organic products suffer from insufficient supplies. However, the distribution of organic products in the EU is increasingly being taken over by conventional supply and distribution channels for sale in supermarkets (Produce Studies, 1998). This is especially true for Sweden, Denmark, Austria, Finland and the UK, in each of which relatively few conventional retail chains and organic food distributors dominate the market (Hamm et al; 2002). Furthermore, in these countries, price premiums are generally low, compared to other countries (Michelsen et al., 1999; Hamm et al., 2002). The indications are that increasing sales volume and increasing sales through supermarkets tend to lower the av-erage price premium (Giraud, 2003; Michelsen et al, 1999). In contrast, other countries such as the Nether-lands, Luxembourg and Germany are characterized by a quite different structure of distribution (Produce
1
Studies, 1998; ITC, 1999; Hamm et al. 2002), Health food stores and direct sales channels have dominated the distribution of organic products for many years in these countries and are still powerful, although their growth is stagnating as compared to the growth of organic products sold through supermarket chains. Higher organic price premiums are also observed in these countries (Giraud, 2003).
Table 2. Average organic shares by product types, sales channels and user types, 2001.
Share (%) of total organic sales sold in…
Supermarkets Discounters Direct sales
Other sales Channels
Total sales
Milk 64 35 0 1 100
Oatmeal 46 53 0 1 100
Eggs 57 31 11 2 100
Carrots 50 45 4 2 100
Flour 64 34 1 1 100
Fresh pasta 56 43 0 1 100
Onions 44 50 5 1 100
Rye bread 51 39 1 10 100
Butter 70 27 1 2 100
Other vegetables 22 6 51 22 100
Dry pasta 78 19 0 2 100
Yoghurt 86 12 1 1 100
White bread 73 8 0 18 100
Potatoes 44 35 18 3 100
Coffee 78 16 0 5 100
Biscuits, cakes etc. 75 10 0 15 100
Cheese 65 20 6 9 100
Fruit 55 14 21 10 100
Other cereals 66 32 0 1 100
Juice 68 14 4 14 100
Beef 20 7 53 20 100
Other meat 16 0 66 18 100
Pork 21 0 71 9 100
Frozen vegetables 91 3 0 6 100
Other foods 64 12 7 17 100
Total 58 25 10 7 100
Heavy users 57 20 14 9 100
Medium users 58 32 5 5 100
Light users 64 29 4 3 100
Source: Own calculations based on GfK purchase data
at a farm gate. This viewpoint is significantly more widespread among organic buyers2,3. Almost one fifth of all respondents, however, state that they have less confidence in such products. Likewise, approximately one fourth state that their confidence is stronger when products are bought at a market stall or delivered directly from the producer, while – on the other hand – as much as one fifth state that they have less confidence in products purchased in this manner. Finally, approximately one fifth of respondents state that their confidence is stronger when products are purchased at a supermarket (significantly fewer organic buyers state this), while barely one in fourteen state that their confidence decreases. These results indicate that consumer confi-dence varies across sales channels, but considerably heterogeneity in this variation is observed between households. Thus, although supermarkets constitute the main sales channel for organic food purchases in Denmark, this cannot be attributed to greater confidence in the sales channel, as such.
Information and labelling
There appear to be two ways in which producers can seek to increase the trustworthiness of products (and consumers can ensure authenticity). The first is by means of direct personal contact between the consumer and producer/seller, making it possible for the consumer to obtain specific points of information about pro-ducers and products. This is possible when foods are purchased at farm gates, market stalls or in specialty stores. The second way is by means of product labels and the provision of information on packaging (Tor-jusen et al., 2004a). Three out of four respondents in our survey state that their confidence in the quality of food products is stronger when information about where and how the product is produced is provided on the packaging. This pattern holds to a greater extent among organic buyers.
For organic goods sold in supermarkets, which are most often sorted and packaged at large-scale indus-trial units, labeling is the only means by which consumers can identify organic goods. Since it is impossible for consumers to check the authenticity of these products, it is necessary to build up a control system with clearly defined rules regarding production methods and labeling of certified organic products (McCluskey, 2000). Earlier consumer studies have indicated that trustworthy labels guaranteeing organic production are very important to consumers, and that clear unmistakable labeling is an important pre-condition for choosing organic products (Trijp et al., 1997; Hack, 1995; Sylvander, 1995).
Our survey results document that the national Danish organic label is well known to Danish consumers, being recognised by 93% of all respondents. In general, people have a good understanding of the organic
2
This is tested using a Likelihood Ratio test for independence in the cross tabulation of responses to the specific ques-tion by buyer/non-buyer status. The test compares the observed distribuques-tion with the expected distribuques-tion under the assumption that the answers are independent of the buyer/non-buyer status. The degrees of freedom are: (number of possible answers - 1)*(number of possible states (2) -1) = number of possible answers - 1. In all cases, significance is at least on the 5% level.
3
rules. Surprisingly, there are almost no significant differences between buyers and non-buyersin regard to their knowledge of the rules behind the organic label. Most respondents (59%) have general confidence in domestic products carrying the Danish organic label, although only 29% have general confidence in foreign products carrying the same label. Trust in organic products that do not carry this label is low – especially for foreign products. Thus, the Danish organic label – being trusted and well known – appears to function as an effective instrument of information provision to consumers, making it possible for them to distinguish or-ganic from conventional products.
Respondents commonly think it important that the rules currently regulating the production and processing of organic foods should be stricter, especially with a view to protecting ground (drinking) wa-ter, the use of additives, pesticides and medicines. Next in line among consumer concerns are the use of gene technology, use of colouring agents in food processing, and animal welfare. Least important are protection of wildlife and nature, use of fertilisers, saving of energy resources and environmentally friendly packaging (in that order). Buyers are significantly more dedicated to raising the demands incurred by rules and regulations, as compared to non-buyers.
However, the majority of respondents (and significantly more among buyers) nevertheless believe that the rules of organic production are good enough to ensure the ‘public good’ attributes of animal welfare and a better environment. Only a few respondents (14-16%) disagree with statements to this effect. In regard to ‘private good’ attributes, 72% believe that organic products are healthier, and 44% also consider this attribute to be of some or even great importance; 64% think organic products taste better, and 36% also consider this characteristic important. Finally, 57% perceive organic foods as being fresher than conventional foods, and 31% consider this important. All of these ‘private good’ attributes are acknowledged by signifi-cantly more buyers than non non-buyers.
consum-ers as signifying more univconsum-ersally benign outcomes, such as generally enhanced food safety. These results thus lend support to the view that demand for organic food products is related to consumer concerns about food safety.
5. Valued attributes: stated values and actual purchasing propensity
In the present study, we identify stated valued attributes in various ways: for organic goods in general, and for four specific organic products (milk, rye bread, potatoes and minced beef).
Most studies show that health considerations play a major role in consumer
preferen-ces for organic foods. Other important attributes are environmental, animal welfare and quality
at-tributes (Beckmann, 2001; CMA, 1996; von Alvensleben, 1998; Meier-Ploeger et al., 1996;
Syl-vander, 1995; Land, 1998; Byrne et al, 1994; Huang, 1996; Huang et al., 1990; Jolly, 1991).
Some-what surprisingly, most respondents in the present study state that improved animal welfare and
en-vironmental protection are the two most important features of organic production. Health attributes
are rated as third most important, while taste and freshness are ranked as least important.
Most respondents who perceive organic products as being healthier believe they are
healthier because of the absence of pesticide and medicine residues. Other (minor) reasons are
ab-sence of synthetic additives, colouring agents and GMOs. Least emphasis is given to the possibility
of organic products having fewer bacteria or having a higher vitamin and mineral content. Thus, the
health attribute appears to be primarily related to the product being free from pesticide and
medi-cine residues (and consequently expected to be healthier). Interestingly, no major differences in
valued product attributes are observable between product types.
When all organic attributes are aggregated either to use-values (defined as private
good attributes only enjoyed when actually eating the product, e.g. such as health, taste, freshness,
etc.), or non-use values (defined as public good attributes enjoyed independently of actually eating
the product, e.g. animal welfare, environmental attributes, etc.;
cf
. section 3), some remarkable
re-sults emerge. Public good values are assigned approximately twice as much weight (importance) on
the Likert scale as private good values (for exact weights and standard deviations, see Wier
et al
.,
2005). Approximately two thirds of total value can be assigned to public good values, leaving one
third assigned to private good values. This result holds across product types, as well as for organic
goods in general. Furthermore, the median and standard deviations indicate virtually identical
dis-tributions, since medians and standard deviations do not vary very much across product types (
cf
.
Before jumping to the conclusion that people primarily purchase organic foods for
en-vironmental and animal welfare concern reasons, we undertook some additional analyses. To find
out what stated values mean for actual willingness to pay on the real market, we combined
informa-tion on stated values for organic goods with actual purchasing behaviour. Of the 1191 households
who responded to the question on values associated with organic goods in general, we have
pur-chase data for 1165 of these respondents for the year 2001. Interestingly, it transpired that
house-holds holding both public and private good values also maintain a high organic budget share on the
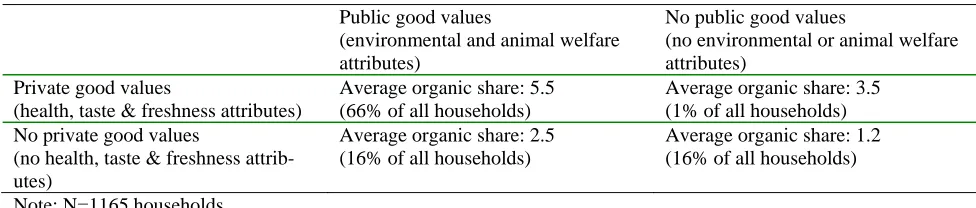
real market. The respondents can be divided into 4 groups, as shown in Table 3. Households
hold-ing both types of values constitute 66% of all households and have an average organic budget share
of 5.5%, households holding only public good values constitute 16% and display an average
or-ganic share of 2.5%, and households holding neither of these value types constitute a further 16%
and spend an average organic share of 1.2%. The fourth group, households holding use-values only,
is negligible (1%). It is noteworthy, that 98% of the households holding private good values also
hold public good values. Thus, consumers can hold public good values without holding private
good values, while the opposite does not hold true. Those who hold private good values with
[image:15.595.50.538.438.542.2]re-spect to organic foods, hold public good values as well.
Table 3. Perceived organic product attributes and average organic budget share, 2001
Public good values
(environmental and animal welfare attributes)
No public good values
(no environmental or animal welfare attributes)
Private good values
(health, taste & freshness attributes)
Average organic share: 5.5 (66% of all households)
Average organic share: 3.5 (1% of all households) No private good values
(no health, taste & freshness attrib-utes)
Average organic share: 2.5 (16% of all households)
Average organic share: 1.2 (16% of all households)
Note: N=1165 households
Source: Own calculations based on own survey data and GfK purchase data
Modelling the effects from stated values on actual purchasing propensity
In order to explore this further, we undertook a regression analysis, using each household’s stated impor-tance (5 points scale) of various use and non-use attributes for organic goods in general to explain the house-hold’s average organic budget share for all food types. More specifically, the model explains average weekly organic budget share for each household during 1997-2001, using stated values (private and public good val-ues), a variable measuring health risk perception in relation to pesticide residues, and main stated purchasing barriers as explanatory variables. These barriers were introduced to the analysis in order to measure the im-portance of lack of interest and lack of trust respectively. Some consumers, who assign values to organic product attributes, may at the same time be unresponsive or uninterested when it comes to actual shopping behaviour, either because they are not really dedicated or because they do not really trust organic goods. Fi-nally, we control for the effect from household characteristics, such as income (approximated by total food expenditure4), urbanisation, age of the oldest person in the household, presence and age of children, and edu-cational level of the most highly educated person in the household.
The estimation results are shown in Appendix A5, revealing that stated private good values have a significant effect on the organic budget share. Very interestingly, the contribution from stated public good values is not significant. The effect of private good values is significant even when controlling for vari-ous hvari-ousehold characteristics, health risk concern and main stated purchasing barriers. We find that lack of trust in control, lack of interest in organic goods (i.e. feeling that there are many other things to spend money on), (stated) lack of knowledge about organic goods, and lack of trust in any health effect from eating or-ganic goods (due to the existence of many other risk factors in everyday life), are all factors that significantly reduce organic shares. Health risk concern about eating foods with pesticide residues increases organic budget share significantly.
Higher disposable household income (approximated by total food expenditure), age and edu-cational level all significantly increase organic budget share, as does the presence of children younger than 15 years old. Very remarkably, the presence of children aged 15 to 20 years (living at home) has the opposite effect: the presence of older children reduces organic shares. This difference indicates that health concern is more prevalent among parents of young children. Urbanisation also influences organic shares significantly. Household organic shares are higher in urban areas, especially in the capital and its surroundings, while the lowest shares are observed in the western areas of rural Denmark.
An important presupposition of this model analysis is that all households are confronted with the same relative prices within a given period, within a given region.6 However, this condition may not be
4
We have applied discrete income brackets as well and the results are not sensitive to alternative income measures.
5
Almost identical results are found when using Logit modelling (Millock et al, 2004), in which we estimate the prob-ability of being in a specific buyer group using same explanatory variables.
6
fulfilled in practice since local prices may differ considerably within each region. This does not undermine the analysis providing that most consumers shop in a large variety of stores, because in that case it can be as-sumed that all households within a region are confronted with a similar range of prices. The vast majority (88%) of all households in the panel have in fact done their shopping in more than 5 stores during 2001, but there may, however, still be significant differences in relative prices between households. In principle, these differences could change the regression results, making several of the explanatory variables insignificant. In order to take account of the importance of relative prices, we also employed another approach. As part of our study, we estimated an AIDS model (see Section 2), using the GfK panel data (for documentation and re-sults, cf. Hansen, 2005). We employ a micro-econometric demand model explaining organic budget shares, in which each household’s deviation from the average demand for organic foods is estimated as household specific constant term (fixed effects), in principle capturing all differences due to variations in socio-economic characteristics and such factors as attitudes and values among households. In the following, we utilize results from the demand modelling to explain the household specific fixed effects with household spe-cific characteristics. Appendix B shows estimation results analogous to the model presented in Appendix A. However, instead of explaining observed household specific organic budget shares, we now explain the household specific deviations from average organic budget shares (i.e. the fixed effects/ household specific constant terms). Thus, we employ the same explanatory variables as before, but now explicitly taking ac-count of the effect of differences in relative prices by using the household specific constant terms. The household specific constant terms take the effects from price variations into account, since they are estimated in a traditional demand system specifically dealing with these price effects. Demand for three major food groups is modelled: dairy products, cereal and bread products, and other foods (including meat, fruit, vegeta-bles, etc.).
The regression results presented in Appendix B reveal that this analysis of household spe-cific constant terms changes the previous results significantly. The main conclusion holds: The households’ stated private good values (assigned to organic goods) increase organic budget shares significantly, while stated public good values have a positive, but insignificant contribution. However, when relative prices are introduced in the model (through regressing on household specific constant terms) as presented in Appendix B, some stated barriers for purchasing organic foods, and most socio-demographic variables, are rendered no longer significant. This may be explained by some of the variation, otherwise explained by a number of characteristics, really being due to variations in relative prices. But it is also important to note that the num-ber of observations included in the analysis presented in Appendix B is much lower than that in Appendix A,
making it much more difficult to estimate significant parameters.7 By and large, each variable has the same influence (positive or negative), but generally not at a significant level.8
Consequently, for (almost) all types of organic food, we can conclude that even though households assign highest values to the non-use attributes, it is the valued use attributes that influence actual purchases. It is worth remarking, however, that public good attributes are widely recognised and valued. Public good attributes are acknowledged by 82% of all respondents and by almost all organic buyers. Thus, it is possible that the recognition of these attributes represents a prerequisite for buying. Consequently, we can conclude that assigning values to the non-use attributes may function as a necessary (but not sufficient) pre-condition for purchasing organic foods. However, assigning values to private good attributes appears to con-stitute both a necessary and a sufficient condition, determining the extent to which organic foods are actually purchased.
Further research is called for in the light of these findings with specific regard to the ade-quacy of the distinction between ‘public’ and ‘private’ attributes, as operationalised in the present study. There is ample evidence that consumers value health, taste, freshness and other quality attributes in connec-tion with most food purchases, whether organic or convenconnec-tional foods are at issue. The specific contribuconnec-tion of ‘public’ good attributes to preferences for organic foods therefore needs to be better understood. More-over, the categorisation of ‘health’ as an attribute that belongs exclusively to the sphere of ‘private’ use val-ues may not be an adequate way of conceptualising the health concerns of consumers. It is noteworthy that the ‘health’ concerns of respondents in the present study focussed upon the use of pesticides and medicines in agricultural production, practices that are closely related to environmental concern on the one hand and to animal welfare concerns on the other. It has been found that environmental and health concerns are closely interconnected in the minds of consumers (Torjusen et al. 2004a), a pattern that has also been identified in a recent study of heavy users of organic food in Denmark (O’Doherty Jensen, 2004).
6. Conclusions
The Danish organic food market is characterised by very high organic market shares. Our purchase data re-veal that this holds true especially for organic dairy products, cereals and vegetables (in that order). Milk has the highest organic share and consumption of organic milk constitutes 27.5% of total milk sales and 34% of total organic sales. Together with organic oats, organic milk has the lowest price premium.
7
Number of observations has decreased since in the modelling presented in Appendix B we apply fewer time series ob-servations (each period is aggregated to 14 weeks, 2001 not included), and fewer households (only households pur-chasing organic dairy products, organic bread and cereal products and other organic foods in the data period) are in-cluded.
8
On average, heavy users purchase more than half of all organic products, but major differ-ences between product types are also observed. Several significant differdiffer-ences in stated values, concerns and perceptions between organic buyers and non-buyers are observed. However, the buyer groups are not homo-geneous, in the sense that large variations are observed within each group. This observation is also supported by the fact that a considerable fraction of households change their behaviour, moving from one buyer group to another, during the observation period.
One out of six respondents do not acknowledge any benefits in regard to organic foods. Fur-thermore, one out of six acknowledge environmental and animal welfare attributes only. However, a large majority – two thirds of all respondents – acknowledge and value organic goods for their environmental and animal welfare attributes (public good attributes), as well as for health, taste and freshness attributes (private good attributes). When combining household level information on stated valued organic product attributes with the actual market behaviour of these same households, it becomes evident that the propensity to pur-chase organic foods increases significantly with the weight assigned to private good values. The weight as-signed to public good values is not significant. That is, households’ acknowledgement of public good values does not explain the actual extent of market participation, as measured by the households’ organic budget share. Nevertheless, since almost all households that purchase organic foods do in fact acknowledge public good values, these values may also represent a prerequisite for buying. The main conclusion, however, is, that even though most households assign values to public good attributes, it is the valued private good attrib-utes that determine the extent to which they actually purchase organic foods.
The variation of organic shares and valued organic product attributes among family types is related to specific household characteristics. For example, higher disposable household income (approxi-mated by total food expenditure), age and educational level all significantly increase the organic budget share, as does the presence of children younger than 15 years. Remarkably, the presence of children aged 15 to 20 years (living at home) has the opposite effect: the presence of older children reduces organic shares. Barriers that significantly influence the propensity to buy organic are lack of trust in control measures, lack of interest in organic goods, and lack of trust in any health effect from eating organic goods (due to the exis-tence of many other risk factors in every day life). Not surprisingly, concern about health risk arising from eating foods that contain pesticide residues increases organic budget share significantly.
con-cerning organic food is labelling, and the well-known and trusted Danish organic label appears to constitute a key element in sustaining this market.
References
Andersen, L.M. (2001): Documentation of household panel data, Working paper no.1, available at
www.akf.dk/organicfoods.
Andersen, L. M. (2002): Consumer evaluation of environmental and animal welfare labelling: An econometric analysis
on panel data using mixed multinomial logit. Working paper no.6, available at www.akf.dk/organicfoods.
Armand-Balmat, C. (2002): Comportement du consommateur et produits biologiques: le consentement á payer pour la
caractéristique biologique. Revue d´économie politique, 112:33-46.
Arthey, D. (1989), “Acceptable Food for the Future - Meeting Consumer Demand”, British Food Journal, Vol.91, No.9, pp.18-21.
Beckmann, S. C. (2001): Danske forbrugere og økologiske fødevarer, Copenhagen Business School, Copenhagen.
Beharrell, B. and J.H. MacFie (1991), “Consumer Attitudes to Organic Foods”, British Food Journal, Vol.93, No.2,
pp.25-30.
Briz, T and M. Al-Hajj (2003): Consumer’s Attitude versus Organic Products. 83rd EAAE seminar, Chania, Crete,
Sep-tember 2003.
Brombacher, J. (1992): Ökonomische Analyse des Einkaufsverhaltens bei einer Ernährung mit Produkten des
Økologi-schen Landbaus (in German). Institut für Agrarpolitik, Universität Hohenheim. Landwirtschaftverlag, Stuttgart.
Bruhn, C. M., Diaz-Knauf, K. Feldman, N, Harwood, J., Ho, G., Ivans, E. Kubin, L., Lamp, C., Marshall, M.
Osaki, S., Stanford, G. Steinbring,, Y., Valdez, I., Williamson, e. and Wunderlich, E. (1992): Consumer food safety
concerns and interest in pesticide related information. The Journal of Food Safety, 12:253-262.
Bugge, A. and M. Wandel (1995), ”Forbrukerholdninger til moderne matvareproduksjon”, Landbruksøkonomisk
Fo-rum, Vol.12, No.1, pp.15-25.
Buzby, J.C. and J. Skees (1994), Consumers Want Reduced Exposure to Pesticides on Food, Food Review, Vol.17,
No.2, pp.19-22.
Buzby, J. C. Skees, J. R. and Ready, R. C. (1995): Using contingent valuation to value food safety: A case study of
grapefruit and pesticide residues. In Caswell, J. A. (ed.:) Valuing food safety and nutrition (pp.219-256).
Boul-der, CO: Westview Press.
Byrne, P. Gempesawll, C. and Toensmeyer, U. (1991): An evaluation of consumer pesticide residue concerns and risk
perceptions. Southern Journal of Agricultural Economics, 23(2).
Byrne, P.J., J.R. Bacon and U.C. Toensmeyer (1994), “Pesticide Residue Concerns and Shopping Location Likelihood”,
Agribusiness, Vol.10, No.6, pp.491-501.
Carson, R., N.E. Flores, K.M. Martin and J.L. Wright (1996), "Contingent Valuation and Revealed Preference
Method-ologies: Comparing the Estimates for Quasi-Public Goods", Land Economics, 72: 80-99.
CMA (1996), Einstellungen und Marktschätzungen aus Verbrauchersicht zu alternativen
Nahrungsmit-teln/Biokost/Ökoprodukten” insbesondere zu Obst und Gemüse. MAFO Memo No 621, Centrale
Marketing-Gesellschaft der deutschen Agrarwirtschaft, Bonn.
Cook, R. (1991), “Consumer Demand for Food Safety-Oriented Marketing Labels: Implications for Sustainable
Agri-culture”, Paper presented at the International Agricultural Economics Association Meeting, Tokyo, Japan,
Coopers and Lybrand Deloitte (1992), Going Organic - The Future for Organic Food and Drink Products in the UK,
Birmingham, UK.
Cummings, R. G. Harrison and E. Rutstrom (1995), "Home-grown values and hypothetical surveys: Is the dichotomous
choice approach incentive compatible", American Economic Review 85, 260-266.
Daly, L. & B. Beharrell (1988), “Health, Diet and the Marketing of Food and Drink - Some Theorethical Problems”,
British Food Journal, Vol.90, No.1, pp.5-9.
Deaton, A. & J. Muellbauer (1980): An Almost Ideal Demand System. American Economic Review 70: 312-326.
Drake, L. and H.Holm (1989), Konsumenternes attityder till alternativt producerat kött - preliminär redovisning av
in-tervju och enkätstudie, Institute of Economics, Uppsala.
Freeman, A. M. (1993): The measurement of environmental and resource values. Theory and methods. Resources for
the future: Washington D.C.
Fricke, A. (1996), „Das Käuferverhalten bei Öko-Produkten. Eine Längsschnittanalyse unter besonderer
Berücksichti-gung des Kohortenkonzepts“. Europäische Hochschulschriften, Reihe V, Volks- und Betriebswirtschaft, Bd.
1960. Peter Lang: Frankfurt.
Frykblom, P. (1997), "Hypothetical question modes and real willingness to pay", Journal of Environmental Economics
and Management 34, 275-287.
GfK Danmark (2001): GfK ConsumerScan. Den økologiske forbruger 2000 (in Danish), Copenhagen.
Giraud, G (2003): Consumer perception and marketing of origin and organic labelled food products in Europe. 83rd
EAAE seminar, Chania, Crete, September 2003.
Glaser, L.K. and G.D. Thompson (1998): Demand for Organic and Conventional Frozen Vegetables. Paper presented at
the American Agricultural Economics Association Annual Meeting, August 8-11, Nashville, Tennessee.
Glaser, L.K. and G.D. Thompson (2000): Demand for Organic and Conventional Beverage Milk. Paper presented at the
Western Agricultural Economics Association Annual Meeting, June 29-July 1, Vancouver, British Columbia.
Gofton, L. & M. Ness (1991), “Twin Trends: Health and Convenience on Food Change or Who Killed the Lazy
Housewife?”, British Food Journal, Vol.93, No.7, pp.17-23.
Govindasamy, R. Italia, J. and Liptak, C (1997): Quality of agricultural produce: consumer preferences and perceptions.
New Jersey Agricultural Experiment Station, Rutgers University.
Grankvist, G. U. Dahlstrabd and A. Biels (2004): The Impact of Environmental Labelling on Consumer Preference:
Negative versus Positive Labels. Journal of Consumer Policy, 27:213-230.
Grunert, S. and K. Kristensen (1995), Den danske forbruger og økologiske fødevarer, Odense University.
Hack, M.D. (1995), “Organically Grown Products: Perception, Preferences and Motives of Dutch Consumers”, Acta
Horticulturae, Vol. 340 Jan., pp. 247-253.
Haest, C. (1990), “From Farmer to Shelf: Trade of Organically Grown Products”, Ecology and Farming, Vol.1 No.1,
pp. 9-11.
Hamm, U., F. Gronefeld, D. Halpin, N. Kristensen, T. Nielsen, M. Bruselius-Jensen, P. Scheperlen-Bøgh, M. Beckie, C.
Foster, P. Midmore, and S. Padel (2002): The organic food market and marketing initiatives in Europe: a
pre-liminary analysis, Institute of Rural Studies, University of Wales, UK.
Hansen, L.G. (2005): Organic crowding out? – A study of Danish organic food demand (in press). SOEM Memo, AKF,
Hansen, J.K. and H. C. Sorensen (1993): The Importance of Price for the Sale of Ecological Products. MAPP working
paper no.13, Aarhus School of Business, Aarhus.
Huang, C.L. (1996), “Consumer Preferences and Attitudes Towards Organically Grown Produce”, European Review of Agricultural Economics, Vol.23 No. 3-4, pp.331-342.
Huang, C.L, S. Misra & S.L. Ott (1990), “Modeling Consumer Risk Perception and Choice Behavior: The Case of
Chemical Residues in Fresh Produce”, in Mayer, R.N (ed.), Enhancing Consumer Choice, Proceedings of the
Second International Conference on Reseach in the Consumer Interest, Snowbird, Utah, USA, August, 1990,
American Council on Consumer Interests, Columbia, Missouri, USA.
Jolly, D.A. (1991), “Differences between Buyers and Nonbuyers of Organic Produce and Willingsness to Pay Organic
Price Premiums”, Journal of Agribusiness, Vol.9 No.1, pp. 97-111.
Jörgensen, C. (2001): Prisbildning och Efterfrågan på Ecologiska Livsmedel (in Swedish). Livsmedelekonomiska
insti-tuttet, Lund.
Kinsey, J. & B. Senauer (1996), “Consumer Trends and Changing Food Retailing Formats”, American Journal of
Agri-cultural Economics, Vol.78 No, 5, pp.1187-1191.
Kjærnes U (ed.) (2001): Eating Patterns. A Day in the Lives of Nordic Peoples. Oslo: National Institute for Consumer
Research, Report No. 7.
Kramer, C. (1990), “Food safety: The Consumer Side of the Environmental Issue”, Southern Journal of Agricultural
Economics, Vol. 22 No 1, pp. 33-40.
Krämer, A., B. Harting & S. Stadtfeld (1998), Siegeszug der “Bio-Lebensmittel” im Handel?, http://www.agp.uni-bonn.de/mafo/staff/oeko3a.htm
Lancaster, K. J.(1994):A New Approach to Consumer Theory, in Thisse,-Jacques-Francois; Norman,-George, eds. The
economics of product differentiation. Volume 1. Elgar Reference Collection. International Library of Critical
Writings in Economics, no. 37. Aldershot, U.K.: Elgar; distributed in the U.S. by Ashgate, Brookfield, Vt.,
1994; 63-88. Previously published: 1966.
Land, B (1998), “Consumers´ Dietary Patterns and Desires for Change”, MAPP Working paper, No.31, Roskilde
Uni-versity, Roskilde.
Lassen J, Madsen K.H. & Sandøe P (2002): ”Ethics and Genetic Engineering – Lessons to be Learned from GM
Foods”, Bioprocess and Biosystems Engineering, Vol. 24, pp. 263-271.
Lassen J. & Jamison A (in press): Science Technology & Human Values.
McCluskey, J. (2000), "A Game Theoretic Approach to Organic Foods: An Analysis of Asymmetric Information and
Policy", Agricultural and Resource Economics Review, 29/1: 1-9.
Meier-Ploeger, A., W. Merkle, I. Mey and F. Wörner (1996), Stärkung des Verbrauchs ökologischer Lebensmittel.
Hes-sisches Ministerium des Innern und für Landwirtschaft, Forsten und Naturschutz, Wiesbaden.
Menghi, A. (1997), Consumer Response to Ecological Milk in Sweden, Swedish Agricultural University, Uppsala.
Michelsen, J. U. Hamm, E. Wynen and E. Roth (1999), The European Market for Organic Products: Growth and De-velopment. Hohenheim University, Stuttgart.
Millock, K, M. Wier and L. M. Andersen (2004): Consumer Values and Willingness to Pay for Organic Foods. 13th
annual EAERE Conference, Budapest, June 2004.
Misra, S. Huang, C.L. and Ott, S.L (1991): Consumer Willingness to pay for pesticide-free fresh produce. Western
Mitchell, V. W. (1998): A role for consumer risk perceptions in grocery retailing.British Food Journal, 171 (4).
O’Doherty Jensen, K. et al., (2001): Økologiske Fødevarer og Mennskets Sundhed [Organic Foods and Human
Health]. Foulum: Danish Research Centre for Organic Farming, Report nr. 14.
O’Doherty Jensen, K (2004): ’Moral Concerns about Food Products and Production Methods among Consumers of
Organic Foods: A Report of Some Preliminary Results of an On-Going Qualitative Study’. Paper presented to the
Consumer Network Workshop of the European Sociological Association. Copenhagen 26-28, 2004.
Produce Studies (1998), The European Organic Food Market. Final Report. The United States Department of
Agricul-ture, The Hague.
Redman, B.J. (1980), “The Impact of Women’s Time Allocation on Expenditure for Meals Away from Home and
Pre-pared Foods”, American Journal of Agricultural Economics, Vol. 22 No.2, pp.234-237.
Richter, T, O. Schmid, B. Freyer, D. Halpin, R. Vetter (2000) Organic consumers in supermarkets, new consumer group
with different buying behaviour and demand, in Alföldi, T, W. Lockeretz and U. Niggli (eds): Proceedings
from the13th International IFOAM conference, Zürich, pp. 542-545.
Schifferstein HNJ, O. Ophuis PAM. Health-related determinants of organic food consumption in the Netherlands. Food
Quality and Preference 1998; 9(3):119-133.
Steenkamp, J-B.E.M. (1997), “Dynamics in Consumer Behavior with Respect to Agricultural and Food Products” in
Wierenga, B et al. (eds.), Agricultural Marketing and Consumer Behavior in a Changing World, Kluwer
Aca-demic Publishers, Boston/London/Dordrect.
Storstad, O. and H. Bjørkhaug (2003): Foundations of production and consumption of organic foods in Norway:
Com-mon attitudes aCom-mong farmers and consumers? Agriculture and Human Values, 20:151-163.
Swanson, R.B. and C.E. Lewis (1993), “Alaskan Direct-Market Consumers: Perception of Organic Produce”, in Home
Economics Research Journal, Vol. 22, 138-155.
Sylvander, B. (1995), “Conventions on Quality in the Fruit and Vegetables Sector: Results on the Organic Sector”, Acta
Horticulture, Vol. 340, Jan., pp.241-246.
Torjusen H., Sangstad L., O’Doherty Jensen K., & Kjærnes, U. (2004a): European Consumers’ Conceptions of Organic
Food: A Review of Available Research. . Oslo: National Institute for Consumer Research, Professional Report
No. 4. Trijp, H.C.M., J-B.E.M. Steenkamp and M.J.J.M. Candel (1997), Quality Labeling as Instument to Cre-ate Product Equity: The case of IKB in the Netherlands, Dordrecth: Kluwer Academic Publishers.
Torjusen H., Jansen B., Lieblein G., Vittersø G., & Østergaard E. (2004b): ”Subscription to Organically Produced Food
in a Food System Perspective: Implications for Sustainability”. Paper presented to the Consumer Network
Workshop of the European Sociological Association. Copenhagen: August 26-28, 2004.
Veeman, M. and Adamowicz, W. (2000): Consumer’s perceptions of environmental risks and the demand for food
safety. Project Resport 00-01, Alberta Agricultural Research Institute, University of Alberta, Canada.
Vogtmann, H. (1988), “Organic Foods: An Analysis of Consumer Attitudes in West Germany”, in Allen, P and D. van
Dusen (eds.), Global Perspectives on Agroecology and Sustainable Agrucultural Systems, Proceedings of the Sixth International Scientific Conference of the International Federation of Organic Agriculture Movements,
University of California, Santa Cruz.
von Alvensleben, R. (1998), Ecological Aspects of Food Demand: The Case og Organic Food in Germany,
von Alvensleben, R. and Altmann, M. (1986), „Die Nachfrage nach alternativen Nahrungsmitteln“, Agrarwirtschaft,
Vol.35, pp. 289-295.
Weatherell, C. A. Tregear, and J. Allinson (2003): In search of the concerned consumer: UK public perceptions of food,
farming and buying local. Journal of Rural Studies, 19:233-244.
Wier, M. og C. Calverley (2002): Market Potential for Organic Foods in Europe. British Food Journal 104: 45-62.
Wier, M. Andersen, L.M. and Millock, K. (2005): Information Provision, Consumer Perceptions and Values – the Case
of Organic Foods. Forthcoming in: Russell, C. and Krarup, S.: Environment, Information and Consumer
Be-haviour. New Horizons in Environmental Economics series, Edward Elgar Publ.
APPENDIX A. Regression results, model explaining household organic budget share,
1997-2001
All food types1
Parameter
Standard
deviation Dairy goods2
Bread and
cereals2 Other foods2
Intercept 2.40* 0.93 2.50 2.23* 2.12
Stated values
-Stated private good values 1.06** 0.11 0.96** 0.90** 1.04**
-Stated public good values 0.07 0.11 0.09 0.26 0.13
Purchasing barriers
-No trust in control of organic farming -0.89** 0.17 -0.88** -1.04** -1.03** -No interest in organic foods (many other things
to spend money on) -0.68** 0.19 -1.07** -0.83** -0.70**
-No trust in health effect from eating organic foods -0.91** 0.18 -0.87** -1.16** -1.04** -Not enough knowledge about organic foods -1.20** 0.17 -1.40** -1.17** -1.32**
Pesticide/medicine residue health concern 0.85** 0.15 0.90** 0.70** 0.94**
Regions, western rural area is base
-Capital area 1.89** 0.36 1.54** 1.61** 1.76**
-East Denmark (except from capital area) 0.59 0.34 0.42 0.62 0.53
-Western towns and uplands 1.38** 0.34 1.25** 1.38** 1.47**
Education length, lowest level is base
-Short 0.80* 0.20 0.67 0.62 0.65
-Medium 1.95** 0.30 2.12** 1.89** 2.29**
-Long 1.72** 0.48 1.47* 1.88** 1.63**
Age of oldest person in household (categories) 0.20* 0.10 0.22 0.33* 0.23*
Presence of children
-Children between 0-14 years 0.86** 0.31 0.96* 0.85* 1.03**
-Children between 15-20 years -0.85* 0.34 -0.52 -0.59 -0.82*
Log (Total weekly food expenditure per consumption unit) 0.93** 0.27 0.56 1.04** 0.74* Notes:
1. Observations from all families in the sample
2. For reasons of comparability, only observations from families included in model estimates shown in Appendix B. * Significant at 5% level
APPENDIX B. Regression results, model explaining household specific constant
terms from model for demand for organic goods, 1997-2000
Dairy goods Bread and cereals Other foods
Parameter
Standard
deviation Parameter
Standard
deviation Parameter
Standard deviation
Intercept 35** 4.14 16.77** 3.14 1.48 1.00
Stated values
-Stated private good values 1.71** 0.60 0.89* 0.42 0.28* 0.14
-Stated public good values 0.18 0.63 0.26 0.46 0.13 0.15
Purchasing barriers
-No trust in control of organic farming -2.53** 0.97 -1.26 0.70 -0.51* 0.23
-No interest in organic foods (many other
things to spend money on) -2.84** 1.04 -1.50* 0.73 -0.40 0.25
-No trust in health effect from eating organic
foods -1.39 0.99 -1.12 0.71 -0.40 0.24
-Not enough knowledge about organic foods -2.10* 0.98 -0.96 0.70 -0.59* 0.23
Pesticide/medicine residue health concern 0.27 0.83 -0.31 0.60 0.55** 0.20
Regions, western rural area is base
-Capital area 1.18 1.95 4.09** 1.44 0.67 0.48
-East Denmark (except from capital area) -0.31 1.92 1.46 1.38 -0.03 0.47
-Western towns and uplands -1.02 1.90 0.30 1.42 0.62 0.47
Education length, lowest level is base
-Shorter 1.00 1.76 -0.36 1.24 -0.30 0.42
-Medium 3.32 1.74 4.68** 1.26 1.09** 0.41
-Long 4.77 2.50 2.61 1.87 0.61 0.60
Age of oldest person in household (categories) 0.56 0.51 0.56 0.39 0.17 0.12
Presence of children
-Children between 0-14 years 2.39 1.72 -1.64 1.26 0.50 0.42
-Children between 15-20 years 0.34 1.85 -2.71* 1.29 -0.54 0.45
Income (discrete income categories per con-
sumption unit) 0.56 0.49 -0.05 0.35 -0.01 0.11
Notes: