Application of linear model of sorption dynamics to the
comparison of solid phase extraction systems of phenol
G.I. Tsysin
*
, I.A. Kovalev, P.N. Nesterenko, N.A. Penner, O.A. Filippov
Department of Chemistry, Moscow State University, Moscow 119899, Russia
Received 23 March 2002; received in revised form 28 September 2002; accepted 1 October 2002
Abstract
A method based on the linear model of sorption dynamics (LMSD) is applied for the comparison of several solid phase extraction systems used for preconcentration of phenol from water solutions. The method includes the calculation of maximum concentration efficiency for the givenvalues of preconcentration factor and recovery under scope of the model. Original parameters of LMSD were obtained from the experimental data on kinetics of sorption of phenol on different hydrophobic non-polar sorbents including poly(styrene-divinylbenzene) (Amberlite XAD-2, PLPR-S 100), hypercrosslinked polystyrene (Purosorb MN-200), hexadecylsilica (KPLPR-SK-G C16) and others (Amberlite XAD-4,
Amberchrom CG-161). The suitability of LMSD for evaluation of dynamic sorption systems is discussed.
# 2002 Elsevier Science B.V. All rights reserved.
Keywords: Solid phase extraction; Phenol; Linear model of sorption dynamics
1. Introduction
Phenol and its derivatives are common reagents in many industrial processes so they are presented in different industrial and wastewaters. Being important water pollutants these compounds have to be under continuous monitoring in differ-ent types of water, even atvery low concentration level. So, the European Community Directive
specified a legal tolerance level for each phenol to be less than 0.1 mg l1and to be less than 0.5
mg l1for the sum of phenols in waters intended for any human consumption. In practice, the phenols are usually determined by reversed phase HPLC with UV[1,2] or electrochemical detection
[3]. As it has been noted in many papers, the reliable direct determination of phenols in waters at the concentration level 0.1/0.4 mg l
1 is a rather difficult task. So, the preconcentration of phenols from water samples is necessary for their HPLC determination at sub-ppm level [4/11]. Solid phase extraction (SPE) is a common
techni-* Corresponding author.
E-mail address: [email protected](G.I. Tsysin).
1383-5866/02/$ - see front matter#2002 Elsevier Science B.V. All rights reserved.
que for the preconcentration of phenols, because of its simplicity, possibility to achieve high pre-concentration factors in a short time, low risk of sample contamination, and etc. The main problem of SPE of phenols is the low recovery of hydro-philic phenols, in particular of non-substituted phenol. Therefore the development of new and improvement of known types of adsorbents for the preconcentration of phenol remains an important task during almost three decades.
There are three main groups of sorbents used for the preconcentration of phenols. The first one
includes chemically modified silica. The most popular in this group is octadecylsilica or ODS
[4,12]. However, chemically modified silica exhi-bits rather small affinity to phenol and phenol’s recovery is low [13]. The second group involves polymeric sorbents, mainly poly(styrene-div inyl-benzene)s with different cross-linking degree and porous structure: XAD-2 [13,14], XAD-4 [13,15/ 18], Bond Elut PPL[10,13], Amberchrom CG-161
[13,19], PLRP-S 100[13,20]. Recently, a number of new materials based on hypercrosslinked polystyr-ene and high crosslinked poly(styrpolystyr-ene-div
inylben-Nomenclature
a(x,t) average concentration of adsorbed substance in bed (mg (ml of bed)1)
a(s)(x,t,r) local concentration of adsorbed solute inside of sorbent particle (mg (ml of particle)1)
a0/a(x,,r)/Gc0 concentration of adsorbed substance in bed in equilibrium with
concentra-tion in mobile phasec0
b liquid film coefficient (s1)
c(x, t) concentration of solute in mobile phase (mg ml1)
c0/c(0, t) concentration of adsorbed solute at inlet of bed (constant)
D apparent coefficient of solid diffusion in spherical particles (cm2s1)
o/Vpore/Vbed bed porosity (voidvolume of bed)
G distribution ratio of adsorbed substance (ml of liquid phase (ml of bed)1)
h(X,T)/Kconc/G expended capacity of sorbent bed (dimensionless preconcentration factor) x(X,T)/1/R cumulative breakthrough (recovery of solute)
Kd distribution ratio of solute between solid and mobile phases (ml g1)
Kconc/a/c preconcentration factor
k Langmuir constant (ml g1)
l height or length of the bed of sorbent (cm)
Q Langmuir maximum adsorption capacity (mg g1)
q(X,T)/a(x,t)/a0 dimensionless concentration of solute in bed
q(s)(X,T,r)/a
(s) (x,t,
r)/a0
dimensionless concentration of the solute in particle
R recovery of adsorbed substance
R radius of sorbent particles (cm)
r(00/r0/R) radius-vector in particles (cm)
r/r/R dimensionless radius-vector in particles
t time measured from the beginning of solute input (s)
T dimensionless time
u(X,T)/c(x,t)/c0 dimensionless concentration of adsorbed substance in mobile phase
v linear flow velocity (cm s1)
w volume flow rate of liquid (ml s1)
x distance measured from inlet of bed (cm)
X dimensionless bed length
zene) under trade names LiChrolut EN [8,13,21], Purolite Macronet Hypersol [13,22/25], Isolute
ENV[8,13], HYSphere-1[10,13]and Envi-Chrom P [13,21] appeared. These sorbents have high cross-linking degree (80% and more) and their developed porous structure provides highvalues of specific surface area. The other feature of these sorbents is increased ability to p/p interactions
with aromatic substances. So, the increased reco v-ery of phenol and its hydrophilic derivatives was noticed. The last group of sorbents includes various carbon black modifications such as Car-bopack B [10], carbon fiber [9] and silica coated with porous graphitic carbon or Hypercarb [26]
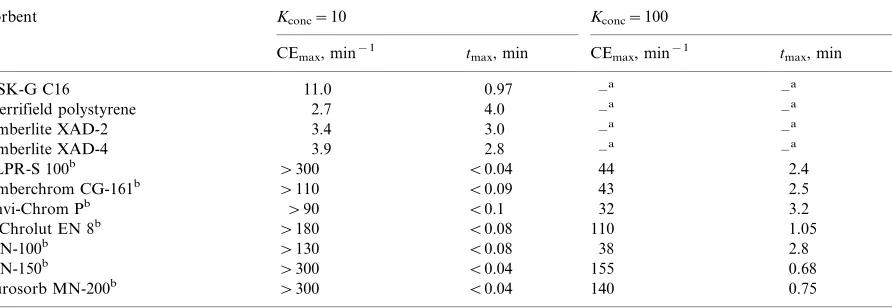
with special high selectivity for polar organics. The main characteristics of these sorbents are summar-ized inTable 1.
Taking into consideration the big variety of sorbents applied for SPE of phenol and their significantly different properties, it is important to find out suitable criteria for the scientifically justified choice of the most efficient sorbent for dynamic preconcentration of phenol. Usually, such choice is based on the measurement of distribution ratio under static conditions that is not completely correct due to ignoring of con-siderable role of mass-transfer rate in the recovery of solute under dynamic conditions.
A new approach to the choice of the most efficient dynamic sorption system, based on the linear model of sorption dynamics (LMSD), is proposed in present work and different sorbents are compared for the preconcentration of phenol.
2. Theory
There are two basic models of mass transfer which have been applied to the investigations of phenol sorption: the liquid film diffusion model, considering diffusion of the solute from the solu-tion to the surface of adsorbent as the rate limited factor, and the solid diffusion model, where diffusion of the solute inside sorbent particle is considered as the rate limited factor[27,28]. Brief description of these models is given below.
First of all, there are a number of statements to simplify the consideration of kinetics of sorption in the fixed bed system:
/ the adsorbent in a column consists of
homo-geneous monosize spherical particles;
/ the solute containing solution flows through the
column/bed with a constantvelocity;
/ the solution flow is considered both in sorbent
bed and in mobile phase volume as in homo-geneous media;
/ the role of axial diffusion due to turbulence in
the overall mass transfer kinetics is negligible as compared to the film and solid phase diffusion; / the model parameters such as distribution ratio
Kd, liquid film coefficientb, solid phase diffu-sion coefficient D of substance as well as geometrical and hydrodynamic parameters of system under scope are independent from the concentration of substance and its placement in total system.
These assumptions mean the system is linear and a single dimensional (there is only onevariable
x*/the bed length); time t should be used for
description of system too. The models are for-mulated to satisfy exactly to a system of differ-ential equations and boundary conditions.
2.1. Mass balance
Differential mass balance can be expressed as
v@c
@xo
@c
@t
@a
@t0 (1)
Table 1
The main characteristics of sorbents used for phenol preconcentration[13,19/21]
Sorbent Manufacturer Matrix nature
Cross-linking degree, %
Specific surface areaS, m2g1
Pore diameter, A˚
Kd(phenol), ml g1
Adsorption capacity of phenol, mg g1
KSK-G C16 BioChemMack Silica-C16 / 250 / 1.7 1.2
Merrifield poly-styrene
Reanal Ps-dvba 2 / / 3.2 0.4
Amberlite XAD-2 Serva Ps-dvba 8 300 90 79 0.7 Amberlite XAD-4 Serva Ps-dvba 16 750 50 270 1.1 PLRP-S 100 Polymer Labs Ps-dvba 60 500 100 / 2.1 Amberchrom
CG-161
TosoHaas Ps-dvba / 900 150 / 4.6
Envi-Chrom P Supelco Ps-dvb hcdb 100 800/950 110/175 / 4.2
LiChrolut EN Merck Ps-dvb hcd 100 1200 / / 18 MN-100 Purolite Int. Hcpsc
/100 1500 1000(15) 843 9.4
MN-150 Purolite Int. Hcps /100 1070 300(14) 759 36
Purosorb MN-200 Purolite Int. Hcps /100 1500 1000(11) 636 36
a
Ps-dvb*/polystyrene-divinylbenzene.
b Ps-dvb hcd*/polystyrene-divinylbenzene with high cross-linking degree. c Hcps*/hyper cross-linked polystyrene.
G.I.
Tsysin
et
al.
/
Separation
and
Purification
Technolog
y
3
3
(2003)
11
/
24
2.2. Mass transfer kinetics
Concerning liquid film diffusion model, the mass transfer rate can be expressed by the follow-ing equation:
@a
@tb(cf1(a)) (2)
whereb is the liquid film coefficient andf1(a) is
the reciprocal function of the adsorption isotherm of solute.
The solid phase diffusion model supposes the diffusion inside sorbent particles as the rate-limit-ing step. So, the mass transfer can be expressed as
@a(s)
@t
1
r2
@
@r
r2D@a
(s)
@r
(3)
where a(s)(x, t, r) is a local concentration of adsorbed substance inside of the sorbent particle;
Dis its apparent solid diffusion coefficient;ris the radius-vector from center of particle to its surface (00/r0/R, where R is the particle radius). The
relation between the local concentrationa(s)(x, t,
r) of adsorbed substance and its average concen-tration over the volume of sorbent bed layer a(x,
t) is expressed by the following equation:
a(x;t) 3
R3(1o)
g
R
0
a(s)(x;t;r)r2dr) (4)
2.3. Equilibrium isotherm
The adsorption isotherm is assumed to be linear (Henry type):
aGc; (5)
whereG is distribution ratio of the solute, calcu-lated as ratio of its concentration in a volume of mobile phase to the concentration in avolume of stationary phase (ml ml1).
2.4. Initial and boundary conditions
Initial and boundary conditions are corre-sponded to the column operating under conv en-tional preconcentration mode.
For liquid film diffusion:
c(x;0)0x"0; c(0;t)
0; t0
c0; t0;
a(x;0)0 (6)
and for solid phase diffusion:
c(x;0)0x"0; c(0;t)
0; t0
c0; t0
;
a(s)(x;0;r)0; a(s)(x;t;R) Gc
1o;
@a(s)(x;t;0)
@r 0
There is no solute both in liquid and solid phases at the beginning of the experiment.
2.5. Solutions
The introduction of dimensionless variables allows reducing the number of independent para-meters in the system of equations Eqs. (1)/(5).
Hence, the solution of system Eqs. (1)/(5) can be
expressed by a number of dimensionless functions:
u(X;T)c(x;t)=c0; q(X;T)a(x;t)=Gc0;
q(s)(X;T;r)a(s)(x;t;r)=(1o)Gc
0
(8)
where u(X, T), q(X, T) and q(s)(X, T, r) are dimensionless concentrations of the solute, ex-pressed per unit volume of mobile phase, station-ary phase and sorbent particle, correspondingly;
X, T and r is a set of dimensionless variables corresponding to length x, time t and radius-vectorr in the particle:X/x/j,T/t/t,r/r/R.
Parametersj andt are the characteristic scales of length and time:
jv=b; tG=b (liquid film diffusion model)
jR2v=DG; tR2=D (solid diffusion model) (9)
obtained in a form suitable for numerical integra-tion[27/29].
3. Experimental
The number of sorbents including hexadecylsi-lica KSK-G C16 (BioChemMack, Moscow, Rus-sia); Merrifield-type resin or chloromethylated poly(styrene-divinylbenzene) with 2% DVB (Rea-nal, Hungary); poly(styrene-divinylbenzene)s Am-berchrom CG-161, XAD-2 and XAD-4 (all from Serva, Heidelberg, Germany); highly crosslinked poly(styrene-divinylbenzene)s Envi-Chrom P (Su-pelco, USA); hypercrosslinked polystyrenes Li-Chrolut EN (Merck, Germany), Purosorb MN-200, Macronet MN-100 and MN-150 series (all from Purolite Int, Pontyclun, UK) was studied in experiments on adsorption of phenol. The main characteristics of above listed sorbents are pre-sented inTable 1.
The adsorption isotherms of phenol on hexade-cylsilica, Amberlite XAD-2, XAD-4 resins, Pur-osorb MN-200, MN-150, MN-100 and Merrifield resin were obtained under static conditions by incubation of 0.02/0.5 g of sorbents with 5 ml of
phenol solution (pH 2.0, 25 8C) during 24 h. Distribution ratios of phenol Kd (ml g1) and G (ml ml1) were calculated per unit of mass of sorbent and volume of stationary phase, corre-spondingly, from the transformed Langmuir equa-tion (a(s)/Qkc/(1/kc), whereQ is the maximum
adsorption capacity, mg g1 and k is the Lang-muir constant, ml mg1) as follows:
Kda(s)=c; G(1o)K
d (10)
The concentration of phenol in solutions was determined by reversed-phase HPLC with photo-metric detection.
The kinetics of phenol adsorption was studied by the method of dynamic breakthrough curves
[29]. Kinetic experiments under dynamic condi-tions were performed with isocratic liquid chro-matograph consisted of high-pressure pump Beckman 114 M (Palo Alto, USA) and spectro-photometric detector microUVIS 20 (Carlo Erba Instr., Italy). The aqueous solution of phenol (pH 2.0, 25 8C) of constant concentration c0 was
pumped through the column (70 mm/2 mm
i.d.) packed with sorbent at the constant flow rate of 0.5/3.0 ml min1. The concentration of
phenol in effluent c was monitored photometri-cally at 280 nm, and time from the beginning of breakthrough experiment was registered for every sampling. The experiment was finished when c
reached 98/99% of initial concentration c0. The
incoming concentration of phenolc0was chosen as the highest value belonging to the linear part of adsorption isotherm to determine wide range ofc
values with maximum accuracy.
To determine the type of mass-transfer and calculate model’s parameters, a simple but rather effective graphical solution of reciprocal task was used. The experimentally obtained breakthrough data plotted in bilogarithmic scale c/c0/t were
matched to the tabulated solution of system Eqs. (1)/(5)u(X,T) build also in the same
bilogarith-mic scale as set of curves in coordinatesu/T [29].
As follows from Eqs. (8)/(10), the values of
dimensional time t and its dimensionless equiv a-lent T differ in bilogarithmic scale on a constant. Thus, the matching procedure consists in simple shift of breakthrough curve in parallel to time axis to find the best consistent calculated breakthrough curve. This matching yields a corresponding pairs of dimensional and dimensionless variables/
sor-bent bed lengthl and its equivalentX, timet and its equivalent T. The model’s parameters such as liquid film coefficient b, apparent solid diffusion coefficient D, distribution ratio G (ml ml1) and
Kd (ml g1) were calculated as follows from relations Eqs. (8)/(10):
bXv
l; Gb
t T
(liquid film diffusion model)
DR2T
t ; GX
vR2
lD (solid diffusion model)
Kd G
1o (11)
The consistence among values of distribution ratio of phenol determined under batch condition G.I. Tsysin et al. / Separation and Purification Technology 33 (2003) 11/24
and calculated from breakthrough data was ad-ditionally used to prove the type of mass transfer. When the good consistence among experimen-tally obtained breakthrough curve and tabulated solutions of system Eqs. (1)/(5) for both type of
mass transfer was observed, the type of mass transfer was determined experimentally using stop-flow technique. In such cases the break-through experiment was repeated twice. In the second experiment, when the concentration of phenol in effluent reached 40/60% of its initial
concentration, the solution flow was stopped inside a column for a time long enough to allow smoothing concentration gradients in sorbent particles (1/1.5 h). After that the breakthrough
experiment was continued as described above. The breakthrough data obtained in both experiments were compared, excluding from calculation the period of time during which the solution flow was stopped. The coincidence of breakthrough curves proves the absence of significant contribution of diffusion in sorbent particles.
4. Results and discussion
The linear range of adsorption isotherm of phenol is the most crucial point in suitability of above-mentioned models and it has to be checked out before their application to calculations. The data on the adsorption of phenol on hexadecylsi-lica KSK-G C16, Merrifield resin and
hypercros-slinked polystyrenes of MN series were experimentally obtained and the literature data
[30] were used for Amberlite XAD-2 and XAD-4 resins (Table 2). All isotherms have had a linear part (Henry’s area) up to equilibrium concentra-tion of phenol about 70mg ml1. The distribution ratios of phenol Kd (ml g
1
) were calculated in linear concentration range in accordance with Langmuir equation (Table 1). Finally, incoming concentration 50 mg ml1of phenol in water was chosen for the investigation of adsorption kinetics under dynamic conditions.
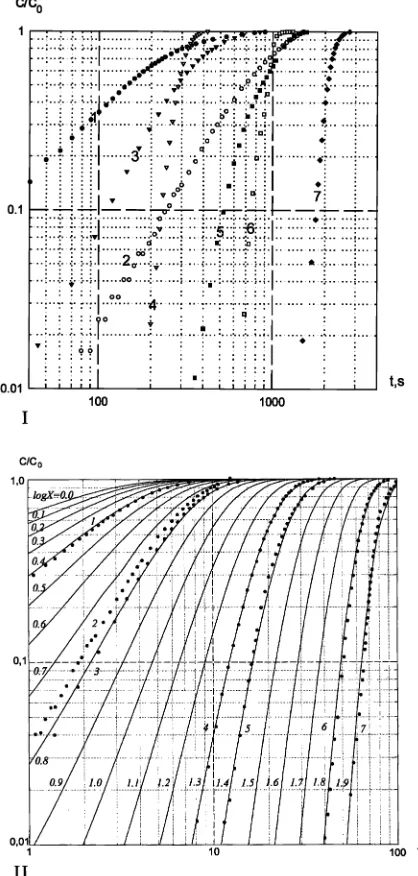
Experimental data on the adsorption of phenol on Merrifield resin and Amberlite XAD resins are corresponded to with the liquid film diffusion model (Fig. 1). In case of hexadecylsilica KSK-G C16and hypercrosslinked polystyrenes (MN100, -150, -200) the definite choice between liquid film and solid diffusion models could not be done on the base of dynamic breakthrough curves only. The absence of reasonable impact of diffusion inside particles in overall mass transfer was proved in this case by stop-flow technique (Fig. 2). The calculated parameters of phenol adsorption ac-cording to film diffusion model are presented in
Table 3.
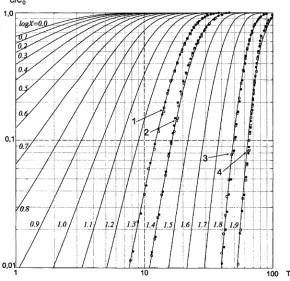
Dynamic breakthrough curves of phenol on PLPR-S 100, Amberchrom CG-161, EnviChrom P and LiChrolut EN were accepted from [13]. These data are also in a good agreement with liquid film diffusion model (Fig. 3). The calculated model parameters for these sorbents are given in
Table 3.
Distribution ratios of phenol Kd on hypercros-slinked polystyrenes MN determined in batch (Table 2) are in agreement with those calculated from breakthrough data (Table 3). This fact proves adequacy of the model chosen for the adsorption of phenol. The distribution ratios of phenol calculated from dynamic breakthrough curves for PLPR-S 100, Amberchrom CG-161, EnviChrom P, LiChrolut EN and Amberlite XAD are well correlated with their adsorption capacities determined in [13,19/21]. Some disagreement in
Kd values published in literature (Table 1) and calculated from breakthrough data (Table 3) could be connected with non-linear conditions of dy-namic adsorption systems used by the authors of
Table 2
Langmuir equation parameters (n/7;P/0.95)
Sorbent Q,
mg g1 k,
ml g1
Kd/Qk, ml g1
KSK-G C16 1.49/0.1 1.579/ 0.09
2.29/0.3
Merrifield polystyr-ene
4.19/0.5 1.279/ 0.09
5.29/0.8
Amberlite XAD-2 799/4 1.659/ 0.17
1309/7
Amberlite XAD-4 1489/6 1.699/ 0.13
2519/7
MN-100 4809/60 1.99/0.4 9209/100 MN-150 5409/40 1.69/0.2 8509/50 Purosorb MN-200 2029/10 3.949/
0.35
[13,19/21]. Nevertheless, the calculated model
parameters seem to be useful for evaluation of the adsorption efficiency of different adsorbents.
In opposite to sorption in batch mode, when the process efficiency is almost completely determined by distribution ratio Kd, neither this parameter, nor kinetic one (liquid film coefficient b, solid diffusion coefficient D) being considered sepa-rately can not be used as a measure of sorbent efficiency in column mode. Especially for sorption preconcentration in flow injection systems the term ‘concentration efficiency, CE’ was introduced by Fang [31]as ‘enhancement factor of analytical signal achieved per unit of time’. In our previous work [32], this term was applied to the sorption step only as the preconcentration factor Kconc achieved per unit of time under given value of recovery of soluteR. Assuming nearly quantitative recovery of solute (R$/1) among assumptions
stated above and calculating preconcentration factor pervolume unit of sorbent bed:
CEKconc=ta=c0t$w=Vbedv=l (12)
wherew(ml min1) is flow rate andVbed(ml) is a bed volume. According to this definition, the concentration efficiency is a measure of the column productivity in dynamic preconcentration of solute.
The peculiarity of mass transfer models de-scribed above is, that when model’s parameters (distribution ratioKdandG, liquid film coefficient b, solid diffusion coefficientD, particle sizeR) are known and yet only preconcentration factorKconc and recovery of solute R are given as limitative parameters, the maximum achievable in the system value of concentration efficiency CEmax could be calculated. On our opinion, this parameter being calculated for different systems under the same values of limitative parameters Kconc and R for could be considered as the total criterion of the sorbent efficiency. A method for evaluation of CEmax for liquid film and solid diffusion mass transfer is described below.
[image:8.544.44.253.132.570.2]In dynamic preconcentration system with the conditions as stated above, at any time t the preconcentration factorKconc(t) can be defined as:
Fig. 1. Dynamic breakthrough curves of phenol on non-polar sorbents (experimental data). I*/Experimental data: XAD-2 (1), XAD-4 (2), Merrifield-resin (3), hexadecylsilica KSK-G C16 (4), MN-100 (5), Purosorb MN-200 (6), MN-150 (7);v/1.5 (1), 0.7 (2/4); 3.0 (5), 2.5 (6), 2.0 (7) ml min1
; weight of sorbent: 112 (1), 132 (2), 144 (3), 141 (4), 54.1 (5), 69.8 (6), 80.7 (7) mg; column 70 mm/2 mm i.d. II*/Calculated break-through curves (solid lines) for liquid film diffusion model matched to the experimental data.
Kconc(t)
1
c0l
g
l
0
[image:9.544.125.415.103.384.2]a(x;t)dx (13) As for infinite time (t0/) a(x, t)0/a0, the maximum preconcentration factor cannot be greater thanG. Thus, in dynamic preconcentration
Fig. 2. Dynamic breakthrough curves of phenol obtained on non-polar sorbents in conventional mode (solid circles) and in stop-flow mode (hollow circles). Solid lines are calculated breakthrough curves for liquid film diffusion model matched to the experimental data. Sorbents and stop-flow time were: hexadecylsilica KSK-G C16, 30 min (1); 100, 60 min (2); Purosorb 200, 60 min (3), MN-150, 60 min (4). Other experimental conditions are the same as onFig. 1. Arrows mark the moments of stopping the flow.
Table 3
The calculated parameters of liquid film diffusion model for the adsorption of phenol by non-polar sorbents
Sorbent R/103, cm G, ml ml1 Kd, ml g1 b, s1
KSK-G C16 7.1 30.19/1.9 479/3 1.069/0.05
Merrifield polystyrene 3.0 20.59/1.3 319/2 0.379/0.02
Amberlite XAD-2 18.9 24.49/2.1 469/4 0.399/0.02
Amberlite XAD-4 23.9 39.69/0.6 669/1 0.319/0.01
PLPR-S 100a 1.0 1299/6 4309/20 19.49/0.5
Amberchrom CG-161a 3.8 249
9/21 10809/90 4.79/0.5
Envi-Chrom Pa 6.0 242
9/16 10509/70 3.69/0.2
LiChrolut ENa 4.0 575
9/37 25009/160 7.39/0.5
MN-100 3.0 1979/2 8009/10 5.59/0.3
MN-150 3.0 3269/4 8809/10 13.69/0.8
Purosorb MN-200 5.0 2509/7 7809/20 15.59/0.2
[image:9.544.42.499.521.658.2]system the preconcentration factor per unit of its maximumvalueG(in fact, the ‘expended capacity of sorbent bed’) can be expressed as:
Kconc(t)
G
1
a0l
g
l
0
a(x;t)dx (14)
At the same time the recovery of soluteR(t) can be written as:
R(t)
c0wtw
g
t
0
c(l;t)dt
c0wt
1 1
c0t
g
t
0
c(l;t)dt (15)
This gives us the ‘cumulative breakthrough’:
1R(t) 1
c0t
g
t
0
c(l;t)dt (16)
As regards to solution of the systemEqs. (1)/(5)
in dimensionless form, the expended capacity of sorbent bed and the cumulative breakthrough can be written in the following form:
h(X;T)Kconc
G
1
X
g
X
0
q(X;T)dX (17)
x(X;T)1R1
T
g
T
0
u(X;T)dT (18)
These functions were calculated according to relations Eqs. (17) and (18) from tabulated solu-tions of the system Eqs. (1)/(5) by numerical integration [29].
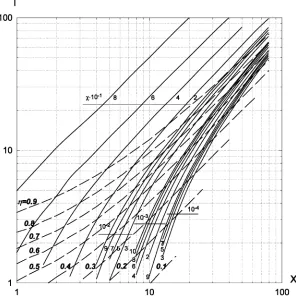
Graphical solution of the system Eqs. (17) and (18) for liquid film diffusion mass transfer is demonstrated on Fig. 4. Calculated functions h(X, T) and x(X, T) were plotted as a set of curves in coordinate planeX/T. The cross point
[image:10.544.48.332.121.593.2]of two curves for given values ofh (distribution ratio Gand preconcentration factor Kconc) andx (recovery R) gives the values of dimensionless parameters Xmax and Tmax. The concentration efficiency CEmax and corresponding dimensional
Fig. 3. Dynamic breakthrough curves of phenol on non-polar sorbents (according to [13]). I*/Experimental data: Envi-Chrom P (1), Amberchrom CG-161 (2), LiChrolut EN (3), PLPR-S 100 (4);v/1.0 ml min1; sorbent mass: 16.3 (1/3), 21.2 (4) mg; column: 10 mm/3 mm i.d. II*/Calculated breakthrough curves (solid lines) for liquid film diffusion model matched to the experimental data.
sorption time tmax are calculated from relations
Eq. (9):
CEmax b
Xmax; tmax
TmaxG
b
(liquid diffusion model)
(19)
CEmax
DG
XmaxR
2; tmax
TmaxR2
D
(solid diffusion model)
(20)
It should be noted that this method allows the extremely useful tool for comparison of efficiency for various dynamic adsorption systems under different but optimum in each case conditions. If calculated CEmax could not be achieved on some reasons (for instance on poor hydrodynamics), this parameter can still be useful for characterization of system stability. This stability allows
perform-ing successful preconcentration of solute from solutions of complex composition, where the distribution ratio of solute could be much lower than in model solutions.
To compare the efficiency of sorbents under scope of present work for preconcentration of phenol, the values of CEmax and corresponding sorption time tmax were calculated according to proposed method. Thevalues of preconcentration factors Kconc of 10 and 100 and the recovery of phenol R/95% were chosen as limitative
[image:11.544.123.419.101.397.2]para-meters. The correspondingvalues ofh andx were obtained for each system from relations Eqs. (10), (17) and (18)using determined distribution ratios of phenol and information about bed density. Then dimensionless parameters Xmax and Tmax were calculated by numerical solution of the system Eqs. (17) and (18) and finally, the values
of CEmax and tmax were obtained from Eq. (19). For some sorbents and preconcentration factor 10 thevalues Xmax andTmax were outside of bounds used in calculations. In such a case the solution of systemEqs. (17) and (18)and thevalues of CEmax and tmax were estimated by graphical extrapola-tion. The results are summarized inTable 4.
The application of models Eqs. (1)/(5) allows determining the impact of both kinetic and ther-modynamic factors in total concentration effi-ciency. As the liquid film diffusion mass transfer is proved, the model parameters are the liquid film coefficient b and the distribution ratio Kd. The value of b includes impacts of convection, mole-cular and longitudinal diffusion which dependent from the properties of liquid and solid phases, i.e. by the diffusion rate of the solute in solution, the apparent surface of liquid/solid boundary etc, and
by the hydrodynamic type of the flow of mobile phase.
Distribution ratioKdreflects the sorption ther-modynamics. The results obtained show that the distribution ratios of phenol for highly and hypercrosslinked polystyreness (cross-linking de-gree is more than 100%) are considerably higher than for hexadecylsilica and poly(styrene-div inyl-benzene)s with low cross-linking degree (2/16%).
An intermediateKdwas observed for PLRP-S 100
having cross-linking degree equal to 60%. Conse-quently, the change in cross-linking degree results in change of sorbate/sorbent interaction energy
for polymer sorbents.
According to[33], the mechanism of adsorption of organic molecules on polymeric sorbents in-cludes either adsorption on the surface or dissol-ving in a solid phase, or mixed mode. It should be noted that the relative impact of each process depends on the microstructure of polymer. An increase of cross-linking degree seems to result in slow change of retention mechanism from prefer-able adsorption to distribution. It leads to remark-able increase in adsorption capacity as well as in distribution ratio[34,35].
An role of porous structure of poly(styrene-divinylbenzene)s and carbon black in retention of some test compounds was studied in [36,37]. According to these data, the retention of hydro-carbons, alcohols and esters on polymeric sorbent with cross-linking degree 43% (S/590 m2g1) is
approximately in 3 times stronger than on sorbent with cross-linking degree 25% (S/183 m2g1).
[image:12.544.50.496.484.638.2]Also, the increase in surface area of carbon black from 15 to 150 m2g1results in 10 times increase of retention. Obviously, the retention is propor-tional to the value of specific surface area of sorbents. In case of hypercrosslinked polystyrenes
Table 4
Calculated maximum achievable concentration efficiency CEmaxand corresponding preconcentration timetmaxfor the phenol recovery on reversed-phase sorbents
Sorbent Kconc/10 Kconc/100
CEmax, min1 tmax, min CEmax, min1 tmax, min
KSK-G C16 11.0 0.97 /a /a
Merrifield polystyrene 2.7 4.0 /a /a
Amberlite XAD-2 3.4 3.0 /a /a
Amberlite XAD-4 3.9 2.8 /a /a
PLPR-S 100b
/300 B/0.04 44 2.4
Amberchrom CG-161b /110 B/0.09 43 2.5
Envi-Chrom Pb /90 B/0.1 32 3.2
LiChrolut EN 8b /180 B/0.08 110 1.05
MN-100b /130 B/0.08 38 2.8
MN-150b /300 B/0.04 155 0.68
Purosorb MN-200b /300 B/0.04 140 0.75
The recovery of phenol 95%, preconcentration factors 10 and 100. a
Preconcentration factor 100 could not be achieved. b
Values of CEmaxandtmaxforKconc/10 were estimated by graphical extrapolation.
(S/1500 m2g1) the retention of organic
mole-cules increased drastically (in 6/7 times) as well as
adsorption capacities for these polymers. There-fore, the increase of cross-linking degree leads to the change of retention mechanism.
Poly(styrene-divinylbenzene) sorbents are found the most efficient substrates for the preconcentra-tion of phenol from water solupreconcentra-tion by SPE. The advantage of this group of sorbents is expressed sharply for polymers with high cross-linking degree (60% and more). The difference between values of CEmax calculated for hypercrosslinked polystyrene and Merrifield resin of gel type is about two orders of magnitude. Preconcentration factor of 100 can not be achieved with hexadecyl-silica or with poly(styrene-divinylbenzene) resins of low cross-linking degree.
5. Conclusions
The method based on LMSD allows to compare phenol preconcentration efficiency of different sorbents under dynamic conditions. This approach may be useful for the optimal choice of sorbent in water purification and in analytical chemistry for preconcentration of trace organic compounds by SPE. The highly crosslinked poly(styrene-div inyl-benzene) and hypercrosslinked polystyrene were found the most promising for phenol preconcen-tration.
Acknowledgements
The authors thanks to Prof E.V. Venitsianovfor the helpful discussion on LMSD.
References
[1] J.C. Hoffsommer, D.J. Glover, C.Y. Hazzard, J. Chroma-togr. 195 (1980) 435.
[2] G. Marko-Varga, D. Barselo, Chromatographia 34 (1992) 146.
[3] D. Puig, D. Barselo, J. Chromatogr. A 778 (1997) 313. [4] (a) V.V. Goncharov, V.B. Goryunova, V.M. Tul’chinskii,
Zavodsk, Laboratoriya 58 (1) (1992) 10;
(b) V.V. Goncharov, V.B. Goryunova, V.M. Tul’chinskii, Zavodsk, Ind. Lab. 58 (1) (1992) 15.
[5] (a) Ya.I. Korenman, R.P. Lisitskaya, Zavodsk. Labora-toriya (Diag. Mater.) 64 (6) (1998) 3;
(b) Ya.I. Korenman, R.P. Lisitskaya, Ind. Lab. (Diag. Mater.) 64 (3) (1998) 3.
[6] V. Piangerelli, F. Nerini, S. Cavalli, Annali di Chimica 83 (1993) 331.
[7] C.W. Klampfl, E. Spanos, J. Chromatogr. A 715 (1995) 213.
[8] M. Castillo, D. Puig, D. Barselo, J. Chromatogr. A 778 (1997) 301.
[9] (a) I.Yu. Andreeva, L.L. Kuvaldina, Zh. Anal. Khim. 50 (1995) 45;
(b) I.Yu. Andreeva, L.L. Kuvaldina, J. Anal. Chem. 50 (1995) 42.
[10] N. Masque, R.M. Marce, F. Borrull, J. Chromatogr. A 793 (1998) 257.
[11] N.A. Penner, P.N. Nesterenko, A.V. Khryaschevsky, T.N. Stranadko, O.A. Shpigun, MendeleevCommun. 1 (1998) 24.
[12] P. Musmann, K. Levsen, W. Radeck, Fresen. J. Anal. Chem. 348 (1994) 654.
[13] N. Masque, R.M. Marce, F. Borrull, Trends in Anal. Chem. 17 (1998) 384.
[14] F. Mijangos, A. Navarro, J. Chem. Eng. Data 40 (1995) 875.
[15] M.-W. Jung, D.W. Lee, J.-S. Rhee, K.-J. Paeng, Anal. Sci. 12 (1996) 981.
[16] B. Gawdzik, J. Gawdzik, U. Czerwinska-Bil, J. Chroma-togr. 509 (1990) 135.
[17] D.C. Kennedy, Ind. Eng. Chem. Prod. Res. Develop. 12 (1973) 56.
[18] E.H. Crook, R.P. McDonnel, J.T. McNulty, Ind. Eng. Chem. Prod. Res. Develop. 14 (1975) 113.
[19] N. Masque, M. Galia, R.M. Marce, F. Borrull, J. Chromatogr. A 771 (1997) 55.
[20] PLRP-S 100A. Polymeric Reversed Phase HPLC Columns and Media. Polymer Laboratories.
[21] O. Fiehn, M. Jekel, Anal. Chem. 68 (1996) 3083. [22] N.A. Penner, P.N. Nesterenko, M.M. Ilyin, M.P.
Tsyur-upa, V.A. Davankov, Chromatogrphia 50 (1999) 611. [23] M.P. Tsyurupa, L.A. Maslova, A.I. Andreeva, T.A.
Mrachkovskaya, V.A. Davankov, React. Polym. 25 (1995) 69.
[24] Hypersol-MacronetTM, Sorbent Resins, Purolite Techni-cal Bulletin, The Purolite Company, 1995.
[25] A.V. Khryaschevskii, M.V. Podlovchenko, P.N. Nester-enko, O.A. Shpigun, Moscow Univ. Chem. Bull. 39 (3) (1998) 196.
[26] V. Coquart, M.-C. Hennion, J. Chromatogr. A 600 (1992) 195.
[27] A. Anzelius, Z. Angew. Math. Mech. 6 (1926) 291. [28] J.B. Rosen, J. Chem. Phys. 20 (3) (1952) 387.
[30] F. Mijangos, A. Navarro, J. Chem. Eng. Data 40 (1995) 875.
[31] Zh. Fang, Flow Injection Atomic Absorption Spectro-metry, Wiley, New York, 1995.
[32] E.V. Venitsianov, I.A. Kovalev, G.I. Tsysin, Teoriya i praktika sorbcionnyh processov(Theory and Practice of Sorption Processes), vol. 23, Voronezh, 1998, p. 24. [33] A.V. Kiselev, Ya.I. Yashin, Gas-Adsorption
Chromato-graphy, Plenum Press, New York, 1969.
[34] B. Versino, F. Geiss, Chromatographia 2 (1969) 354. [35] J.F. Johnson, E.M. Barrall, J. Chromatogr. 31 (1967) 547.
[36] (a) L.D. Belyakova, A.M. Voloschuk, L.M. Vorobjeva, O.A. Larionova, O.G. Larionov, Zh. Phys. Khimii. 69 (1995) 501;
(b) L.D. Belyakova, A.M. Voloschuk, L.M. Vorobjeva, O.A. Larionova, O.G. Larionov, J. Phys. Chem. 69 (1995) 455.
[37] (a) L.D. Belyakova, O.V. Vasilevskaya, M.P. Tsyurupa, V.A. Davankov, Zh. Phys. Khimii. 70 (1996)
1476;
(b) L.D. Belyakova, O.V. Vasilevskaya, M.P. Tsyurupa, V.A. Davankov, J. Phys. Chem. 70 (1996) 1374.

![Fig. 3. Dynamic breakthrough curvsorbents (according to21.2 (4) mg; column: 10 mmbreakthrough curChrom P (1), Amberchrom CG-161 (2), LiChrolut EN (3),PLPR-S 100 (4);es of phenol on non-polar [13])](https://thumb-us.123doks.com/thumbv2/123dok_us/8452713.336670/10.544.48.332.121.593/dynamic-breakthrough-curvsorbents-according-mmbreakthrough-curchrom-amberchrom-lichrolut.webp)