ECOLOGICAL INDICATORS
By
Karyl Michaels B. Ed., Grad Dip. Env. Stud. (Hons)
Submitted in fulfilment of the requirements of the degree of Doctor
of Philosophy
School of Geography and Environmental Studies
University of Tasmania
Hobart
Carabids are beeetles of ground So spots where carabids are found Is reason for inferring
That there they're occurring This circular reasoning is round
Without wings they're more apt to stay there But the winged may take to the air
Dispersing in myriads Through Tertiary periods
This thesis contains no material which has been accepted for the award of any other degree or diploma in any tertiary institution and to the best of my knowledge and
belief, the thesis contains no material previously published or written by another
person, except when due reference is made in the text.
Karyl Michaels
This thesis may be made available for loan and limited copying in accordance with
Parts of the material presented in this thesis were published as:
Michaels, K. and Bornemissza G. (1999). Effects of clearfell harvesting on lucanid betles (Coleoptera:Lucanidae) in wet and dry sclerophyll forests in Tasmania. Journal oflnsect Conservation 3 (2):85-95.
Michaels, K. F. (1999). Carabid beetle (Coleoptera: Carabidae) communities in Tasmania: classification for nature conservation. Pp. 374-379 in The Other 99% The conservation and Biodiversity of Invertebrates (eds. W. Ponder and D. Lunney). Transactions of the Royal Zoological Sociey of NSW, Mosman.
Taylor, R., Michaels, K., and Bashford, D. (1999). Occurrence of old growth carabid beetles in retained unlogged strips in production forests in southern Tasmania. Pp. 120-127 in Nature conservation 5: Managing the Matrix, (eds. J.L. Craig, N. Mitchell and D.A.Saunders).Surrey Beatty and Sons.
Michaels, Karyl and Mendel, Louise. (1998). Carabid Beetle and Vegetation Associations in the Tasmanian Eastern Tiers: Implications for Conservation. Pacific Conservation Biology 4 (3) 240-249.
McQuillan, P. B. and Michaels, K. F. (1997). First record of Pseudoheteronyx (Coleoptera: Scarabaeidae: Melolonthinae) from Tasmania, with description of Pseudoheteronyx littoralis sp. n. from sandy beaches, Australian Journal of Entomology 36: 117-120
Michaels, K. F. (1997). The ground beetle fauna (Coleoptera: Carabidae) as an indicator of the conservation value of grasslands, Tasmanian Conservation Trust, Tasmania.
Michaels, K. F. (1997). Carabid beetle values of dry sclerophyll forest and grassy ecosystems in Eastern Tasmania, University of Tasmania, Tasmania.
Michaels, K.F. 1996. Report on the Impact of the 'Iron Baron' Oil Spill on the Common Invertebrate Fauna of Coastal Sand Dunes, University of Tasmania. Unpublished report.
The explicit assumption in the proposed use of ecological and biodiversity indicators is that patterns of diversity and distribution observed in the indicator taxon are reflected in other taxa, yet this assumption has rarely been tested. The use of biodiversity and ecological indicators requires that their representativeness of other taxa be demonstrated. This thesis examines the potential for using carabid beetles as biodiversity and ecological indicators for other Coleoptera in Tasmania.
Species-occurrence data for carabids and a range of Coleoptera collected by continuous year-long pitfall trapping at fifty-one sites in three biomes, dry sclerophyll forest, remnant native grasslands and coastal sand dunes were used to investigate the utility of carabid beetles as biodiversity indicators for overall coleopteran diversity and for other selected beetle taxa.
Correlated species counts, correlations in rank ordering based on species richness, and coincidence of hotspots revealed that while the patterns of diversity exhibited by carabids did not necessarily predict the patterns of diversity of other individual beetle taxa considered separately, they did, with a reasonable degree of accuracy, indicate overall patterns of diversity for Coleoptera in all the biomes studied. Carabid species richness was a good predictor of overall beetle species richness within biomes and within vegetation community types.
Application of three reserve selection approaches: (1) Hotspots, (2) Representative Species Richness and (3) Complementarity, demonstrated that a set of representative areas, based on carabids species richness, gave proportional representation for all Coleopt~ra. Representation for, all carabids using the complementarity approach also gave protection to over 90% of all coleopteran species. It is therefore likely that a set of representative areas in which carabids are completely represented will substantially represent the diversity of other Coleoptera.
regrowth age, but indicated that the species composition of regrowth sites were often similar to some old-growth sites. This pattern was observed for carabids in the dry sclerophyll forest, but not in the wet. Other beetle taxa demonstrated more complex patterns of clustering, with no clear evidence of site separation on age class.
The family Carabidae did not reflect the exact response of other beetle families considered separately. However, they did reflect the overall patterns of diversity and distribution exhibited by beetles as a group in response to forest management practices. Results demonstrated that monitoring particular carabid species would provide evidence of the success or otherwise of management practices for other old-growth dependent beetles.
The results reported in this thesis support the hypotheses that:
(i) the family of ground beetles (Carabidae) is an appropriate biodiversity indicator for identifying and predicting the biodiversity patterns of ground dwelling Coleoptera in most instances in Tasmania, and
(ii) that carabids are useful ecological indicators to predict and monitor the effects of forest management on a wider range of ground-dwelling beetles in Tasmania.
I am indebted to the many people who generously gave assistance at various stages throughout the duration of my studies.
I owe a special thanks to Michael Russell, firstly, for his wonderful and unceasing support and constructive and creative advice in every aspect of this study, and secondly for rescuing me from the horrors of Maplnfo and preparing the maps.
I thank my supervisor, Dr McQuillan, for invaluable advice, interest and enthusiasm, but especially for orchestrating an initial interest in beetles from a hard days night into many a hard days work.
I thank especially, Dr Louse Mendel and Louse Gilfedder for their botanical expertise and assistance in site selection and establishment.
Thank you also to Greg Blake, who gave me gainful employment which contributed some of the data for this thesis.
I am indebted to Nahrel Dallywater and Vanessa Shoobridge for field assistance over and above the call of friendship.
I am particularly grateful to the specialist taxonomists, Dr Barry Moore, Dr John Lawrence, Dr Tom Weir, Dr Andrew Calder and Dr Zimmerman at the Australian National Insect Collection (ANIC), CSIRO, Canberra, Dr Eric Mathews at the South Australian Museum and Dr George Bornemissza, for access to the reference collections, examining voucher specimens and providing valuable information and assistance.
I would like to thank all the farmers who were so generous with their time and their properties and without whose cooperation parts of this project would not have been
possible.
I would like to extend my thanks to Margaret Atkinson and others at the Tasmanian Conservation Trust.
museum reference collection at NewTown in Tasmania.
I would like to thank the staff and students of the School of Geography and Environmental Studies for support and company in many ways. In particular:
David Sommerville helped with transport and computer advice.
Mike Harlow was there with support in every computer crisis.
Denis Charlesworth gave assistance with soil analysis.
Kerry Green for administration and money matters.
Glenda Fahey for keeping me a gym junkie and for muchos margaritas.
Janet Smith for musical jam sessions.
John Ashworth for invaluable assistance and advice on the vagaries of PATN.
The Geography Society for much fun and laughter.
ABSTRACT ... ... ... iii
ACKNOWLEDGMENTS ... ... v
TABLE OF CONTENTS... .. ... .. ... vii
LIST OF FIGURES... ... .. .. .. ... .... . . ... ... xi
LIST OF TABLES ... ... ... xiv
CHAPTER ONE INTRODUCTION ... 1
BIODIVERSITY IS BEETLES... .... . ... / BIODIVERSITY IS IN CRISIS... . . ... ... ... . . ... .... 3
CONSERVATION AND SUSTAINABILITY OF BIODIVERSITY ... 3
Inventory - the spatial quant1ficat10n of b10d1vers1ty ... 4
Momtonng - the spatial and temporal quant1f1cat10n of b10d1vers1ty. . . . . . .. .. . . .. . .. . . . 5
INDICATORS... .. . .. .. .. . .. . .. . . ... ... .. .. .. .. .. .. . ... . .. ... .. 5
TESTING THE INDICATOR CONCEPT. ... ... 7
CARABIDS AS INDICATORS ... ... 7
THESIS AIMS AND STRUCTURE ... 8
CHAPTER TWO INDICATORS ... 10
WHAT IS AN INDICATOR ... ... JO Types of md1cators... .. . .. .. .. . . . . . (1) Environmental md1cators. (2) Ecological md1cators .. ... 12
. . . . 12
... 13
(3) B10d1vers1ty md1cators .. .. . . . . . .. . .. . . .. . . 14
ISSUES ... ... 15
'Useful md1cators respond s1gmf1cantly to components one wishes to momtor' ... 1 5 'Basically, everythmg is an md1cator of somethmg but nothmg 1s an md1cator of everythmg' . 16 Carab1ds as md1cators. . . . . . . . .. .. . .. .. .. .. .. .. .. .. .. .. .. . .. .. .. .. .. .. .. .. .. .. .. . . .. . . .. 1 7 SELECTION OF INDICATORS .. ... ... 18
SUMMARY ... ... 20
CHAPTER THREE ASSESSING THE INDICATOR POTENTIAL OF CARABIDS: CARABIDS AS ENVIRONMENTAL INDICATORS ... 22
TEMPLATE OF ATTRIBUTES. .. ... . ... 22
SITE DESCRIPTIONS... . ... ... .. .. . ... ... .. .. .. .. . ... 34
EASTERN TIERS . . . . . . . . . . . . . . . . . . . . . . . . . . . . . . . 34
GRASSLANDS ... . . ... 42
SANDDUNES ... .. ... ... . ... . .. . .. . ... 50
PICTON. . ... ... . ... 56
WEILANGTA. ... . ... 62
CHAPTER FIVE SAMPLING AND IDENTIFICATION ... 68
5.1. SAMPLING ... 69
SAMPLING PROTOCOL ... 69
Samplmg target.. . . . . . . . . .. . . .69
Pitfall traps ... . . . . 69
Trap placement... . ... . . ... 70
Samplmg period . . . . ... . . . . ... 70
Samplmg effort . . . . . . . . . . . . . . . . . . . . . . . . ... 7 0 THE PITFALLS ... 71
The trap itself ... 71
Size ... . . .. .. . 71
Type ... . . . . 72
Number. . .. . ... 72
Trap capture efficiency . . . . . . . . .. . ··· .... 73
Species size . . . . . . . . . . . . . . . . . . . . ... . . ... 73
Seasonality... . . . . . . . . .... . .. . . 73
Trap placement... . . . . . . . ... 73
The d1ggmg m effect.. . . . . . . . . . . . . . . ... 7 4 Climatic factors.. . . . . . . . . . . . . . . . . . . . . . . . . . . . . . . . . . ... 7 5 SAMPLING CRITERIA FOR INDICATORS ... ... 75
Simple and Cheap.. . . . . . . . . . . . . . . . . . . . . . . . . . . . . . . . . . . . . . . . . . . . . . . . . . . . ... 7 5 Practical to use . . . . . . . . . . . . . . . . . . . . . . . . . . . . . . . . . . . . . . . . . . 7 5 Defmed sampling methods. . . . . . . . . . . . . . . . . . . . . . . . . . . . . . . .. 7 6 SUMMARY ... 76
5.2 IDENTIFICATION ... 79
TAXONOMIC RESOLUTION... . ... 79
IDENTIFICATION PROTOCOL. ... 80
Identification process . . . . . . . . . ... 80
Components of the identification process ... 82
PROBLEMS ... ... 83
Promecoderus . . . . . . . . . . . ... . . . ... . ... 83
CHAPTER SIX ASSESSING THE INDICATOR POTENTIAL OF CARABIDS
FOR INVENTORY: CARABIDS AS BIODIVERSITY INDICATORS ... 86
Indicator test measures... . .... . ··· . . . 86
Correlated Species Counts ... . . ... 87
Comcidence of hotspots . . . 87
Reserve select10n.. . . . . . . . . ... 88
The Hotspots approach . . . . . . . . . . ... 88
The Representative species nchness (RSR) approach . . . . . . . . . . ... 8 8 Complementanty: the greedy algonthm (GA) approach... .. . .... .. .. . . . . ... 89
CHAPTER AIMS ... ... 90
METHODS ... 91
STUDY AREAS ... 91
DATA ANALYSIS ... 91
Indicator test measures. . 91 .. .. .. . .. .... ... . . ... . . ... 91
Correlated species counts ... Comcidence of hotspots . . . .. ... .... ... ... .... . . . ... 91
Reserve select10n methods.... . . . . . ... 92
Hotspots approach . . ... 93
Representative species nchness (RSR) approach . . . . . . . 9 3 Greedy Algonthm (GA) approach . . . . . . . . . . . . . . . . . . .. 9 3 RESULTS ... 99
INDICATOR TEST MEASURES ... 99
Correlated species counts .. .... 99
Comc1dence of hotspots . . . . . . . . . . . . . . . . . . . . . . . . . . . . . ... 1 00 RESERVE SELECTION METHODS ... ... 101
The Hotspots approach . . . . . . . . . . . ... . .. 101
The Representative species nchness (RSR) approach.. . . . . . . . . . . . . . . . . .... 101
Complementanty the greedy algonthm (GA) approach. . . . . . . . . . . . . . . . . . . . 101
DISCUSSION ... 114
Correlated species counts . . . . . . . . . . . . . . . . . . . . . . . . . . . . ... 114
Hotspots.. .... .... . .. . ... . . . ... 116
STUDY SITES ... ... 125
SAMPLING ... ... 125
DATA ANALYSIS ... ... 125
Alpha diversity... .. . .. ... . .. . . .. .. . .. . . .. . . . 126
Beta-diversity . .. . . . . . . . . . . . . .. . . .. . . . . . . . . . . . .. . . . . . . . . . .. . . . . . . . . . . . . . 126
The Mons1ta Hom Index of Similarity.. . . . . . .. .. . . . ... 126
The INDY AL index. ... .. . . .. .. . ... . ... . ... . ... ... .. . ... 127
UPGMA analysis... . .. . .. .... .. . . . .. . .. . . .. . . . . . .... . .. . . . . . . .. . . . . ... 128
RESULTS ... 130
VARIATION ACROSS THE SUCCESSIONAL GRADIENT ... ... 130
Diversity... . . . .. ... . ... . .. .. ... .. ... .... . . ... 130
Species compos1t10n . . . . . .. . . . . . . . . . . .. . . . . . . . . . . . . . . . . . . . . . . . 131
SPECIES OCCURRENCE ACROSS THE SUCCESSIONAL GRADIENT ... 142
Class1f1cat10n of species.. . . .. . . . . . . . . . .. . . .. . . . . . . . . . . . . . . . . ... 14 2 UPGMA cluster analysis... .. .. . . .. ... '... . ... 157
DISCUSSION... . . . .. . . . ... 173
Tax on response to clearfelling ... . .. 173
Do different forest growth stages have charactenst1c beetle assemblages?... . .. . .. . 176
Are carab1ds good ecological md1cators. . . . . . . . .. . .. . . . . . . . . . . . . . . . . . . . . .. 178
Carab1ds as ecological md1cators... . . . . . . . . . .. . .. .. . . . . ... 178
CONCLUSION ... 181
CHAPTER EIGHT SYNTHESIS AND CONCLUSION ... 183
CARAB/DS AS BIODIVERSITY INDICATORS ... 183
CARABIDS AS ECOLOGICAL INDICATORS ... 186
Implicat10ns for forest management... . . . . . .. . . . . . . . . . . . . .. . . .. . . .. . . . 1 8 8 CARAB/DS AS INDICATORS ... 189
CONCLUSION .. ... 192
Figure 1.1. Wheeler's speciescape, on which the size of md1v1dual orgamsms approximately
corresponds to the number of descnbed species m the higher taxon that 1t represents... . . . . . .2
Figure 4 1 Geographic locat10ns of study areas m Tasmama ... 3 2 Figure 4.2. Geographical locat10ns of sites m the dry sclerophyll forests of the Eastern and Fmgal Tiers ... ··· ... ... .. .. ... . . . ··· ... 35
Figure 4.3. Eucalyptus amygdalina grassy open forest m the Eastern Tiers, site AG3. . ... 3 9 Figure 4 4. Eucalyptus amygdalma heathy open forest m the Eastern Tiers, site AHl ... 3 9 Figure 4.5. Eucalyptus brookerana wet sclerophyll forest m the Eastern Tiers, site B2 ... 40
Figure 4.6. Eucalyptus delagatens1s shrubby open forest m the Eastern Tiers, site D2 ... .40
Figure 4.7. Wet Heath m the Eastern Tiers, site H3 ... .41
Figure 4.8. Eucalyptus tenuiram1s heathy open forest m the Eastern Tiers, site T2 ... .41
Figure 4.9. Geographical locations of remnant native grassland sites m the Grasslands study ... .43
Figure 4 10. Grassland commumty type T2, Tussock Grass - Weepmg Grass - Flat Daisy Tasmaman Valley Grassland, site MIP. . . . . . . . . . . . . . . . . . . . . . . . ... .4 7 Figure 4 11. Grassland commumty type T2, Tussock Grass - Weepmg Grass - Flat Daisy Tasmaman Valley Grassland, site TP. . . . . . . . . . . . . . . . . . . . . . . . . . ... .4 7 Figure 4 12. Grassland commumty type T3, Tussock Grass - Rush-Matted St John's Wort Tasmaman Flood Plam Grassland, site NFP... . . . . . . . . . . . . . . . . . ... .4 8 Figure 4.13. Grassland commumty type T5, Kangaroo Grass - Hirsute Gumea - Flower - Um Heath Tasmaman Grassland, site CT ... .48
Figure 4.14. Grassland commumty type T6, Kangaroo Grass - Tasmaman - Spear Grass - Common Everlastmg Tasmaman Grassland, site EFT ... ... . .. ... ... ... . ... .. . ... .49
Figure 4.15. Grassland commumty type T8, Wallaby Grass - Native Cranberry East Coast Tasmaman Grassland, site EFD. ... .. .. ... . ... .... . . ... 49
Figure 4.16. Geographic locat10n of the ten coastal sand dune sites. . . . . . . . . . . . . . . . . . . . . . . 5 1 Figure 4.17. Fnendy Beaches, on Tasmama' s east coast, site FB ... . . ... 54
Figure 4.18. Waterhouse Pomt, on Tasmama's north coast, site WH ... 54
Figure 4.24. Late regrowth site m the Picton, site P25Yrl.. ... 6 1
Figure 4 25 Old-growth control site m the Picton, site OGl.. ... 61
Figure 4.26. Geographic location of study sites in We1langta ... 63
Figure 4.27 Early regrowth site in Weilangta, site WlYrl. ... 66
Figure 4 28. Intermediate regrowth site m We1langta, site W9Y r2. . . . . . ... 6 7
Figure 4.29. Old-growth control site m Weilangta, site WOG4. ... ... ... ... ... .... 67
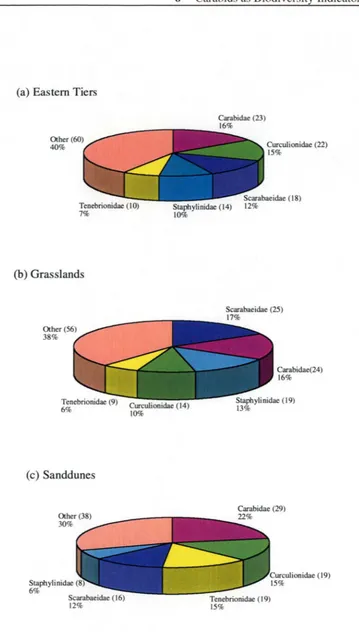
Figure 6.1. The number of species, and the contribut10n (%)made to the total coleopteran species
nchness m the b1ome, for carab1ds and each of the other four coleopteran fam1hes m (a) the
Eastern Tiers, (b) the Grasslands and ( c) the Sanddunes... . ... 9 4
Figure 6.2. Dendrogram from UPGMA analysis, based on the species composit10n of the carabid beetle
fauna for sites m the Eastern Tiers. . . . . . . . . . . . . . . . . . . . . . . . . . . . . . . 9 6
Figure 6.3. Dendrogram from UPGMA analysis, based on the species composit10n of the carab1d beetle
fauna for sites m the Grasslands ... 97
Figure 6.4. Dendrogram from UPGMA analysis, based on the species composition of the carab1d beetle
fauna for sites m the Sanddunes... . . . . . . . . . . . . . . . . . . . . . . . . . . . . . . ... 9 8
Figure 6.5 Coincidence of hotspots in the Eastern Tiers.. . . . . . . . . . . . . . ... 109
Figure 6.6. Comc1dence of hotspots m the Grasslands . . . . .. .. 110
Figure 6. 7 Comcidence of hotspots m the Sanddunes. . . . . . . . . . . . . . . . . . . . . . . . . . . . . . . . . . .. 111
Figure 7.1. The number of species m each Coleopteran family and the contnbut10n (%)made by each
family to the total catch in (a) the Picton forest and (b) We1langta forest.. ... 129
Figure 7.2. Mean species nchness (SR)± SD for each taxon within each forest age class in the Picton.134
Figure 7.3. Mean abundance± SD for each taxon within each forest age class m the Picton ... 135
Figure 7.4. Mean species nchness (SR)± SD for each taxon w1thm each forest age class m Weilangta.136
Figure 7.5. Mean abundance± SD for each taxon within each forest age class in We1langta ... 13 7
Figure 7.6. Dendrogram from UPGMA analysis, based on the species composition of the carabid beetle
fauna 1n the Picton forest . . . . . . . . . . . . . . . . ... 15 8
Figure7.7 Dendrogram from·UPGMA analysis, based on the species compos1t10n of the total
ground-dwellmg coleopteran fauna m the Picton forest... . .. . . . . . . .. . ... . . . . .. . .. . . .. . . . . . 159
Figure 7.8. Dendrogram from UPGMA analysis, based on the species composition of the
Figure 7.10. Dendrogram from UPGMA analysis, based on the species compos1t10n of the lucamd fauna
in the Picton forest.. . . . . .. . . . . . . . . . . . .. . .. . .. .. . . .. . . . . . .. .. . . . . . . . . . . . . . . . ... 162
Figure 7 .11. Dendrogram from UPGMA analysis, based on the species composition of the staphyhmd
fauna in the Picton forest... . . .. .. . . .. . .. . . . .. . . .. . .. . . ... 163
Figure 7 12 Dendrogram from UPGMA analysis, based on the species composition of the tenebnomd
fauna m the Picton forest. ... 164
Figure 7.13. Dendrogram from UPGMA analysis, based on the species compos1t10n of the carabid fauna
m the We1langta forest.... . . . .. .. .. . ... .. .. ... .. .. ... .. .. .. .. .. . . . . .. . . .. .. . ... 166
Figure 7.14. Dendrogram from UPGMA analysis, based on the species composition of the total ground
dwellmg coleopteran fauna m the We1langta forest. ... 167
Figure 7 15 Dendrogram from UPGMA analysis, based on the species compos1t10n of the
ground-dwelling Coleopteran fauna (excluding carab1ds) m the Weilangta forest.. ... 168
Figure 7 16. Dendrogram from UPGMA analysis, based on the species composition of the curcuhomd
fauna in the We1langta forest. . . . ... 169
Figure 7.17. Dendrogram from UPGMA analysis, based on the species composition of the lucanid fauna
in the We1langta forest... .. .. . .. .. .. .. . . . . .. . ... .. . . . .. . . . . . . . .. . ... . ... 170
Figure 7 18. Dendrogram from UPGMA analysis, based on the species compos1t10n of the staphyhmd
fauna in the We1langta forest.. ... 171
Figure 7 19. Dendrogram from UPGMA analysis, based on the species compos1t10n of the tenebnomd
community type and locat10n data (TASMAP 1:25000 reference) ... 36
Table 4.2. The six representative botanical commumt1es chosen in the Eastern Tiers study: typical
vegetat10n, floristtcs and heights, at sites w1thm each plant community type (PCT) ... 3 7
Table 4.3. Environmental parameters for sites in the Eastern Tiers. . . . . . ... 3 8
Table 4.4. Site locat10n details for Grassland sites site numbers, site codes, locahty, grassland
community type (GCT) and location data (TASMAP 1:25000 reference) ... .44
Table 4.5 Vegetation characteristics at Grassland sites. Grassland commumty type (GCT), descnpt10n,
aml LypH.:al vegetat10n at sites withm each GCT. .. . ... .. . . .. . . .. . . .. . . . . . ... 45
Table 4.6. Envuonmental parameters for sites in the Grasslands ... .46
Table 4 7. Typical vegetation flonstics at each of the ten sites m the Sanddunes ... 5 2
Table 4.8. Site location details for sites m the Sanddunes: site numbers, site codes, locality, coastal
location and location data (T AS MAP 1 :25000 reference) . . . . . . . . . . . . . . . .. '. ... 5 3
Table 4.9. Environmental parameters for sites m the Sanddunes ... 53
Table 4.10. Site location details for the Picton: site codes, locality, age and location data (TASMAP
1:25000 reference)... ... .. . . ... ... . . ... 58
Table 4.11. Environmental parameters for sites m the Picton . . . . . . . . . . . . . . . ... 5 8
Table 4.12 Typical vegetat10n at sites within each forest age class in the Picton . . . . . . . . . . 5 9
Table 4.13. Site locat10n details for We1langta: site codes, locahty, age and locat10n data (TASMAP
1:25000 reference) ... 64
Table 4.14. Environmental parameters for sites m Weilangta ... 64
Table 4.15. Typical vegetat10n at siles w1Llun each fotesl age class in We1langta ... 65
Table 6.1. Untransformed mean number of species (Mean spp.), standard error (SE) and standard
deviat10n (SD) for Carabidae, All Coleoptera, Coleoptera, Curcuhomdae, Scarabae1dae,
Staphylm1dae and Tenebnonidae for each b10me. . . . . . . . . 9 5
Table 6.2. Pearson's correlation coefficients (r) for pairw1se compansons of total species counts between carab1ds and All Coleoptera, Coleoptera, Curcuhomdae, Scarabae1dae, Staphyhmdae and
Tenebnonidae for all three biomes... . . . . . . . . . . . . . . . . . . . . . . . . . . . . . . . .. 103
·'Tao1e 6 3. --Species count for eacb site and site rank order for each group cif taxa·based on species nchness
(SR) m the Eastern Tiers. . ... . ... ··· ... 104
Table 6.4. Species count for each site and site rank order for each group of taxa based on species nchness
Table 6.6 Species counts by site and rank order of sites based on species nchness (SR) for each group
of taxa w1thm plant community type (PCT) m the Eastern Tiers . . . . . . . . . . . . . . . . . . . ... 107
Table 6.7. Species counts by site and rank order of sites based on species richness (SR) for each group of
taxa w1thm grassland commumty type (GCT) m the Grasslands ... 108
Table 6.8. Proport10nal overlap of carabid hotspots with hotspots for All Coleoptera, Coleoptera and
other Coleopteran taxa... . . . . . . . . . . . . . . . . 112
Table 6 9. Results of the three area-selection methods m representmg Carab1dae, All Coleoptera,
Coleoptera and md1v1dual coleopteran taxa, for sites m each of the three b10mes . . . . ... 113
Table 7. 1. Mons1ta -Hom similarity values (max 1.0) for pairw1se comparisons of similarity of
commumty composition between forest age classes for each coleopteran taxon in the Picton. 13 8
Table 7. 2. Morisita -Hom sim1lanty values (max 1.0) for pairwise comparisons of sim1lanty of
commumty compos1t10n withm each forest age class for each coleopteran taxon in the Picton.139
Table 7. 3. Mons1ta -Hom s1m1larity values (max 1.0) for pairwise compansons of s1m1lanty of
commumty composition between forest age classes for each coleopteran taxon in We1langta 140
Table 7. 4. Mons1ta -Hom s1m1larity values (max 1.0) for pairwise comparisons of s1milanty of
commumty compos1t10n w1thm each forest age class for each Coleopteran taxon m We1langta. 141
Table 7.5. Indicator values, based on the INDVAL index, and species class1ficat1ons, based on md1cator
values and occurrence m each of the classes across the success10nal gradient, for each species in
the Picton... . . . . . . . . . . . . . . . . . . . . . . . . ... 145
Table 7 6. Indicator values, based on the INDY AL mdex, and species classif1cat10ns, based on indicator
values and occurrence m each of the classes across the success10nal gradient, for each species m
Weilangta ... 148
Table 7.7. Charactenst1c (md1cator) species for each forest class m the Picton, showmg the species
indicator value in parentheses. . . . . . . . . . . . ... 151
Table 7.8. Characteristic (md1cator) species for each forest class m Weilangta, showing the species
mdicator value m parentheses. . . . . . ... 15 2
Table 7.9. Total number of species and md1v1duals and proport10n (%)of species in class1ficat10n
categones, overall, and in each forest class, for each taxon, m the Picton. . . . . . . . ... 1 5 3
Table 7 10. Total number of species and individuals and proportion(%) of species m classification
Chapter One
Introduction
This thesis addresses the complex issue of the use of biodiversity and ecological indicators in the domain of conservation biology. The explicit assumption in the promotion of ecological and biodiversity indicators is that patterns of diversity and distribution observed in the indicator tax.on are reflected in other taxa, yet this assumption has rarely been tested. The effective use of biodiversity and ecological indicators requires that their representativeness of other taxa be demonstrated. This thesis attempts such a demonstration by testing the potential for using carabid beetles as biodiversity and ecological indicators for other Coleoptera in Tasmania.
BIODIVERSITY IS BEETLES
Asked what could be concluded about the nature of the creator from a study of his creation, the noted biologist J. B. S. Haldane is alleged to have replied "An inordinate fondness for beetles" (Gould 1993 p. 4.). Beetles are a substantial part of the global fauna and of the total global biodiversity (Fig. 1.1). Beetles epitomise biodiversity.
Over half of all known animal species are insects (New et al. 1995), and estimates of insect diversity range from 5 million to as many as 80 million species (Gullan and Cranston 1994). Measured by species, individuals or biomass, insects are the most diverse components of terrestrial ecosystems (Wilson 1987; Stork 1988; Erwin 1991; Kremen et al. 1993). The largest group of insects and the largest Order in the Animal Kingdom is the Coleoptera (beetles) (Evans and Bellamy 1996). Beetles represent one quarter of all known animal species on earth and one fifth of all known living organisms (Evans and Bellamy 1996). If insects are "the little things that run the world" (Wilson 1987), beetles are the frontline troops. Beetles are tiny recycling machines, recycled in tum by other animals and plants. Practically every biological strategy used by terrestrial insects is employed by beetles.
Their hard cuticle and tough elytra allow them to exploit almost every conceivable habitat: from the depths of subterranean caverns to mountain tops; from arid deserts to rainforests; from intertidal shorelines to riparian zones; every vegetational microhabitat from external foliage flowers, buds, stems barks and roots to internal sites such as galls in living plant tissue; and any kind of dead material in all various states of decomposition (Britton 1991; Gullan and Cranston 1994; Evans and Bellamy 1996).
BIODIVERSITY IS IN CRISIS
But, biodiversity is in decline on an unprecedented scale (Kirkpatrick et al. 1995; Pimm and Lawton 1998). Biodiversity, short for biological diversity, encompasses the variety of earth's biological resources (McFadgen and Simpson 1994). The protection and conservation of biodiversity has never been more urgent, with species, communities and ecosystems disappearing at an alarming and ever increasing rate (Ehrlich and Wilson 1991).
Man himself, has been and continues to be, the biggest threat to biodiversity, with our rapacious pursuit of a higher standard of living for an ever growing human population. Habitat loss, destmction and degradation through land clearance, wetland reclamation, coastal, urban and industrial developments and mining; conversion of much of the environment to agricultural and forestry use accompanied by the fragmentation of remaining habitat is the major cause of species loss (DEST 1995). The exploitation of our biological resources as if they were boundless has resulted in dramatic changes to habitats and ecosystems world-wide (Paoletti 1995).
CONSERVATION AND SUSTAINABILITY OF
BIODIVERSITY
Conservation biology is concerned with the conservation and sustainable management of biodiversity and has two primary objectives:
(1) to represent the greatest possible diversity (of living organisms) in a reserve system and to ensure their survival (Margules and Nicholls 1987), and
(2) to understand and control human impacts sufficiently to ensure the sustainable survival of all the other species that share the world (New 1995).
To achieve the first objective we need to:
(1) identify where the greatest diversity is located and identify a set of sites representative of overall diversity,
(2) identify best management and planning strategies to ensure its continued existence and
(3) monitor for sustainability to ensure its continued existence
To achieve the second objective, we need to:
(1) evaluate, assess and understand the effects of differing land management practices
(2) identify best management practices and
(3) identify and recognise ecological change due to land management practices before it becomes critical and irreversible.
Conservation and sustainability therefore, have two main elements: inventory and monitoring.
Inventory - the spatial quantification of biodiversity
The purpose of inventory programs is to document the spatial distribution of biological elements - species, populations, communities and ecosystems (Kremen et al. 1993). Knowledge of species distribution and habitat requirements is vital for identification of critical habitat, ecological evaluation, reserve design and selection (New 1995). Without data on diversity, both the amount and the distribution we have no way of knowing what levels of diversity are present and therefore what
levels of diversity may be lost if not protected (Hawkes 1992). An adequate inventory of species is required for both conservation and sustainable use of species because you need to know what you have before you can make decisions about sustainable resource use or protection (Prance 1995).
will conserve the range of variability within and between regions (Pressey et al. 1993). But, evaluating and understanding the results of land use practices, identifying best management practices and recognising ecological changes also requires baseline data. We need to know what we have if we are to recognise and understand the impacts of our actions and modify them.
Monitoring - the spatial and temporal
quantification of biodiversity
Monitoring is the quantification of biodiversity over time as well as space, and is essential for demonstrating long term sustainability. If we are to ensure survival of extant species, we need to monitor to detect early changes or stresses to natural systems (New 1995). If we are to successfully change and/or modify our actions, we need to monitor to assess the success or otherwise of our management practices (McLaren et al. 1998). Monitoring programmes should ideally provide a sensitive and accurate source of information from which conditions and trends can be defined and recognised, and management decisions made (Thomas 1993).
Land use is expanding as is land degradation. While some forms of land degradation (i.e. soil erosion, salination, extensive overgrazing, desertification) are distinct and highly visible, the effects of most land management are subtle and their ecological consequences may not be immediately apparent (Andersen 1990). There is an urgent need to assess what effects variations in land use have on resident species, and it is important to be able to recognise ecological change well before it becomes dramatic and possibly irreversible (Andersen 1990). Monitoring of selected species can identify changes in biological diversity, permitting the timely adjustment of management activities to reverse or avoid undesired trends (Sparrow et al. 1994 ). Monitoring tells us how to best modify land use practices to both maximise diversity and protect resident fauna for the long term (that is to prevent species becoming extinct, threatened or rare). Hopefully, monitoring will warn us if we are doing the wrong thing before we get to the point of no return.
INDICATORS
Ideally, we should inventory and monitor all biodiversity. Such baseline data are a "vitally needed prerequisite for rational planning and for the preservation of biological diversity" (Soule and Kohm 1989; Hawkes 1992; New 1995). But, unfortunately, there is too little time, too little money or resources, too little expertise, and too much diversity (Vane-Wright et al. 1994; Balmford et al. 1996a. Yet, we need reliable data to inform debate on how best to counter threats and
implement appropriate conservation measures (Hammond 1994). The biodiversity crisis, the severity and expanding nature of the problem, and the inherent difficulties in documenting and monitoring biodiversity, has therefore led to increasing interest in the concept of indicators.
Indicators are organisms (taxa or suites of taxa) whose key attributes or characteristics are measured or monitored under the assumption that they reflect the condition and/or trend of some ecological property that is too difficult, inconvenient or expensive to measure for other species, or to monitor directly (Landres et al.
1988; Noss 1990).
McGeoch (1998) suggests that there are three categories of indicators corresponding
to their main applications.
• environmental indicators - species or taxa that demonstrate a predictable response to environmental disturbance or change.
• biodiversity indicators - species or taxa whose diversity reflects some measure of the diversity of other taxa.
• ecological indicators - species or taxa that demonstrate the effects of environmental disturbance or change on at least a subset of other taxa
Environmental indication is the traditional use of indication, where an indicator taxon is monitored so that changes in environmental condition can be detected. Canaries down the mines are probably one of the earliest examples of a species used as an indicator of environmental quality. Aquatic invertebrates have been used extensively as indicators for environmental impact assessment in both freshwater and marine systems for more than 30 years (Hellawell 1986; Rosenberg and Resh 1993).
TESTING THE INDICATOR CONCEPT
Legitimate use of biodiversity and ecological indicators require that they are an adequate surrogate for other biota. Biodiversity indicators should accurately represent aspects of diversity of other organisms and conservation based on biodiversity indicators should ensure protection for uninventoried tax.a via the precautionary principle. Ecological indicators should accurately reflect the impacts of environmental changes or stresses on other unmonitored organisms.
Many species have been suggested as indicator species. Many authors have suggested criteria to be applied to assess the suitability or potential of tax.a as indicators. However, although the uses, merits and demerits of indicators have been much discussed, and there has been extensive discussion on the potential use of indicators, their representativeness of other taxa has been little tested. The use of biodiversity and ecological indicators requires that their representativeness of other taxa be demonstrated.
CARABIDS AS INDICATORS
The family Carabidae (ground beetles) includes over 40, OOO species globally. It represents 3 % of all insects, more species than almost any other insect family and 2.5% of all animal species (Thiele 1977). Carabids are one of .the largest beetle families and numerous studies suggest that they fill the a priori criteria to be an indicator taxon (for example, Thiele 1977; Stork 1990; Desender et al. 1991b).
Carabids are represented on a more or less global basis, and present in almost all
kinds of habitats, generally in reasonable numbers, all the year round (Thiele 1977). Most species are sensitive to environmental changes in their habitat with ecological requirements limited enough either to allow useful predictions to be made about changes in quality and land use history, or to characterise the community and the habitat (Stork 1990; Lovei and Sunderland 1996). Like Coleoptera generally, they have adapted to fill a range of niches. Collectively, they are predatory, omnivorous, even phytophagous with a taste for strawberries and they are considered potentially important natural pest control agents in agroecosystems (Clark et al. 1997). They are easily and cost-effectively sampled with modest effort and without the use of specialised equipment (Spence and Niemela 1994). Readily identifiable, they are one of the most widely studied taxa in the world.
It would be advantageous if Carabids were indicators for general coleopteran diversity. Then we could inventory carabids and be assured that other Coleoptera were being considered in biodiversity assessments and strategies. It would also be advantageous if carabids were ecological indicators for other Coleoptera. If we were assured that the responses of beetles as a group mirrored the responses exhibited by carabids, then we could monitor carabids and we would know the impact of an environmental stressor on a large part of the fauna.
The utility of carabids as environmental indicators has been relatively well documented in other regions. But their usefulness as biodiversity indicators and ecological indicators has yet to be tested in Australia.
THESIS AIMS AND STRUCTURE
The aims of this thesis are:
• to test the hypothesis of utility of carabid beetles as a biodiversity indicator for other taxa: specifically, other selected Coleoptera.
• to test the hypothesis of utility of carabid beetles as an ecological indicator for other taxa: specifically, other selected Coleoptera.
A range of sites were surveyed and inventoried
As a result of these surveys, several research hypotheses were tested:
1. Carabid diversity accurately indicates/reflects general beetle biodiversity.
2. Reserve selection based on carabids will provide protection for other selected Coleoptera.
3. The response of carabids to a major environmental stressor (clearfell logging) is representative of the response of other selected Coleoptera.
which carabid beetles meet these criteria will be addressed in Chapter Three. The data used in this thesis was obtained from several different studies undertaken at a range of locations in Tasmania. Chapter Four describes the location, vegetation and environmental parameters of the study sites. Sites were inventoried to produce species lists of carabids and other Coleoptera. The sampling and identification protocols used to produce these lists are described and discussed in Chapter Five.
The hypothesis that the family of ground beetles (Carabidae) is an appropriate biodiversity indicator tax.on for identifying and predicting the biodiversity patterns of other selected Coleoptera is examined in Chapter Six. Common test measures of indicators from the literature will be used to test whether patterns of diversity of carabids are congruenl with the diversity patterns of other selected Coleoptera and different reserve selection approaches will be applied to assess the extent to protection for carabids might result in the conservation of Coleopteran biodiversity.
In Chapter Seven the hypothesis that carabids are useful ecological indicators to predict and monitor the effects of forest management activities on a wider ~ange of ground-dwelling beetles will be examined. The response of carabids and other selected Coleoptera to commercial forestry harvest and regeneration practices (clearfelling followed by burning and regeneration) will be evaluated and compared to assess if the responses of carabids to this environmental disturbance are representative of the response of other Coleoptera.
The final chapter (Chapter Eight) is a synthesis that brings together the conclusions which could be drawn regarding the thesis aims and the practical considerations for using carabids as biodiversity and ecological indicators will be discussed.
Chapter Two
Indicators
Indicator species have been used for decades as a convenient assay of environmental conditions (de Wit 1983; Eijsackers 1983; Hellawell 1986; Rosenberg and Resh 1993), and the characterisation of habitats by species assemblages (indicator species) is a core activity in ecology and biogeography (Dufrene and Legendre 1997).
The use of indicators is receiving increased interest in conservation biology, indeed, current conservation strategies strongly mandate for their use. However, the conceptual bases, the assumptions and criteria for the use of indicator species are as varied as the proposed uses. In this.chapter, I: (1) review traditional and current definitions of indicators; (2) discuss the issues involved in using indicators; and (3) examine the criteria for selecting indicator species.
WHAT IS AN INDICATOR
"Indicate" from the Latin indicare to point out, to show (Hanks 1979
p745).
The Collins Dictionary of Biology defines an indicator species as "any species that is indicative of particular conditions or habitats" and an indicator community as "an association of species that is characteristic of particular conditions or habitats" (Hale and Margham 1988 p 292).
instances (Soule 1988). Fishermen used (and still do despite the advent of SONAR) the presence of circling birds as a visual indicator of the presence of schooling fish.
A literature search indicates that there has been a big increase in publications on the subject of indicators in recent years. One of the major factors driving this interest in indicators is increased concerns about how to conserve and sustain biodiversity in the face of accelerating habitat loss, destruction and degradation. The urgent need to assess the quality of ecosystems, to identify key components which can serve as indicators of ecosystem quality and to detect and manage ecosystem changes following perturbations has become a major issue globally and the increased interest in indicators reflects this.
Indeed, increasing concern for the environmental impact of human activities has led to many countries mandating for the use of indicators to assess, monitor and document biological diversity and environmental quality. Australia along with 156 other countries is signatory to the (1992) Convention on Biological Diversity. The convention calls upon its member states to identify components of biological diversity important for the long-term conservation and sustainability of biodiversity such as indicator species (McFadgen and Simpson 1994; McGeoch 1998). It also calls upon signatories to monitor the components of biological diversity and identify activities which are likely to have significant adverse impacts. In order to meet its international obligations, Australia intends to develop a "core set "of biodiversity indicators to assess and monitor the condition of Australia's biological diversity (Saunders et al. 1998).
The term indicators is being employed in a wide range of contexts, including the indication of sustainable development, ecosystem health, habitat alteration, rehabilitation, pollution, climate change and even past climates (Hunsaker and Carpenter 1990; New 1995; Bertollo 1998; Whitford et al. 1998). There has also been a proliferation of related terms and synonyms (see for example Spellerberg 1991; Hammond 1994; Vane-Wright et al. 1994; New 1995; Cranston and Trueman 1997; Fisher 1998; McGeoch 1998). Indicators are also referred to as bioindicators (biological indicators), the term originating in the aquatic literature where it referred to the detection and monitoring of change in biota to reflect changes in the environment (Wilhm and Dorris 1968). The term indicator will be used hereafter for convenience. The definition of indicators is thus largely dependent on their purpose or application.
Types of indicators
McGeoch (1998) suggests that there are three categories or types of indicators corresponding to the three main applications of indicators: environmental indicators, ecological indicators and biodiversity indicators.
( 1) Environmental indicators
Environmental indication is the traditional use of indication, where an indicator tax.on is monitored so that changes in environmental condition can be detected (McGeoch 1998). Environmental indicators are individual species (taxon) or species assemblages (tax.a) that demonstrate a readily observable, quantifiable and predictable response to disturbance or change in environmental condition (McGeoch 1998) (one environmental condition being habitat type). Odum 1971) remarked that the environment of organisms can be judged on the basis of the species that are present: the indicator species. For example, chironomid midge community structure is considered the most important indicator of lake typology in the northern hemisphere (Cranston 1990).
Environmental indicators incorporate both the condition or state of the environment (biophysical indicators) and stresses on the environment by anthropogenic activities (e.g. toxic emissions, energy use, natural resource harvesting (Bertollo 1998). By expressing particular symptoms or responses indicative of changes in some environmental influence, usually in a qualitative manner, environmental indicators can be used to measure the environmental condition (health or quality) of a particular habitat, community or ecosystem (Hart et al. 1993; Hawksworth and Ritchie 1993). Lichens, for instance were used as indicators of air purity for at least a century because it was observed that in general, less lichens occurred in cities with polluted air than in non-polluted areas (de Wit 1983).
absence reflects a change, as the third. Baseline data is essential to validate absences for all types of indicators.
Environmental indicators indicate a particular environmental condition or set of environmental conditions by change/no change in the indicator. Environmental indicators are used to describe, analyse and summarise environmental conditions, trends and their significance (Fisher 1998). Because of this focus on conditions and trends they are inexorably linked with monitoring programs (Fisher 1998) and state-of-the-environment reporting (Bertollo 1998; Saunders et al. 1998), since the prime objective in the application of environmental indicators is to assess environmental quality.
(2) Ecological indicators
However, as anthropogenic impacts on the environment increase, the need to protect and manage natural resources has become increasingly critical and the focus of environmental indication has expanded from stress-specific, end-of-pipe environmental quality standards to encompass the broad objectives of ecologically sustainable development: to protect biodiversity and to maintain ecological integrity (Cairns et al. 1993; Fisher 1998). To ensure that biological resources are managed on a sustainable basis requires increased emphasis on ecologically focused management and the monitoring of biological diversity and ecosystem functions. This has led to a perceived need for ecological indicators.
Ecological indicators have been defined as those environmental indicators that describe or represent the condition of an ecosystem or one of its critical components or processes (Bertollo 1998; Fisher 1998) including biological diversity and ecological processes (Vora 1997). However, McGeoch (1998) defines ecological indicators as environmental indicators whose response reflects that of at least a subset of other organisms; in other words, 'a characteristic or surrogate taxon/taxa for a community or ecosystem', or at least a subset of the larger community (Meffe and Carroll 1994).
impacts of forest management in order to demonstrate that forest harvesting is not detrimental to the sustainability of wildlife populations and their habitats, for example (McLaren et al. 1998).
The critical difference between environmental indicators and ecological indicators is that environmental indication uses the response of biota to describe an environmental state or to detect anthropogenic perturbations, and, effects on the indicators themselves are of secondary importance; whereas ecological indication is the use of biota to determine the effect of an anthropogenic perturbation on the biota itself, and, the response of the indicators themselves is what is important. Baseline data or reference sites are important for both environmental and ecological indication, since change or no change can only be assessed when the characteristics of the biota are known, or where comparisons can be made with unimpacted biota in similar habitats elsewhere in the region.
( 3) Biodiversity indicators
Biodiversity has become a major focus for conservation efforts (Noss 1990; McFadgen and Simpson 1994; Pearson 1994). Prioritisation and comparisons of key areas for conservation rely on estimates of biodiversity, yet this information is generally not readily available. Detailed knowledge of species distribution for most species is scarce, indeed, data on the absolute biodiversity for most areas are non-existent, particularly for invertebrates such as beetles, (Beccaloni and Gaston 1995; Balmford et al. 1996b). Moreover, the diversity of organisms and complexity of ecosystems prevent complete inventory even at the site scale (Kremen 1992; Hammond 1994).
Since all the species in a region can never be directly counted, practical evaluation of the relative biodiversity of an area or sets of areas must depend on surrogate information (Faith and Walker 1996a). If biodiversity is to be inventoried and monitored, measurable surrogate indicators of its composition, structure and functioning must be identified (Noss 1990; Kremen 1992; Pearson and Cassola 1992; Williams and Gaston 1994; Beccaloni and Gaston 1995; New 1995; Balmford et al. 1996a,b; McGeoch 1998).
1996b; Cranston and Trueman 1997). Biodiversity indicators therefore, are taxon or taxa whose diversity reflects some measure of the diversity (for example, character richness, species richness, level of endemism) of other taxa in a habitat or set of habitats (Noss 1990; Ryti 1992; Gaston and Blackbum 1995; Vane-Wright 1996; McGeoch 1998).
The primary application for biodiversity indicators is in reserve selection: to identify priority areas for conservation (Vane-Wright et al. 1991; McGeoch 1998) and to determine regional patterns of biodiversity (Pearson and Cassola 1992) in order to select a network of areas representative of the biodiversity of the region (Pressey et al. 1993; Margules et al. 1994; Faith and Walker 1996a). But they should also provide enhanced biogeographic resolution of communities, habitats and biotypes (Kremen et al. 1993). Biodiversity indicators save the time and expense that would be necessary for comprehensive surveys (if such surveys were at all possible) (McGeoch 1998).
ISSUES
'Useful indicators respond significantly to components one wishes to monitor'
(Elliott 1997 p 62).
The desirable qualities of indicators can differ depending on their purpose (Kremen et al. 1993; McGeoch 1998), and therefore, indicators cannot be selected until goals and objectives are specified (Cairns et al. 1993). The use of indicator taxa for conservation research has been divided in two categories: inventory studies and monitoring studies (Kremen et al. 1993; Pearson 1994; Rodriguez et al. 1998). Although inventory and monitoring are interrelated and both necessary for conservation, they frequently differ in their objectives and hence in the type of indicators to be used (Kremen et al. 1993). Inventory will often encompass the measurement of many things but monitoring should be specific to the planned objectives and assumptions used in planning (Vora 1997).
The main objectives of using indicators for inventory purposes are to provide information on regional patterns of biodiversity (Pearson and Cassola 1992) to identify priority areas for conservation (Vane-Wright et al. 1991; McGeoch 1998), to provide baseline data for the selection and planning of reserves; and to provide enhanced biogeographic resolution of communities, habitats and biotypes (Kremen
et al. 1993). Therefore, indicators selected for inventory should be biodiversity indicators. Indicators for inventory should exhibit relatively high species diversity
and encompass the geographic range of interest (Kremen et al. 1993 ), but the most desirable characteristic of biodiversity indicators is that they accurately indicate/reflect aspects and patterns of diversity of other taxa/organisms or at least a subset at the relevant scale.
The objectives of monitoring programs are to evaluate changes in communities, habitats or ecosystems (structure, composition and function) resulting from environmental perturbations such as human disturbances, management activities or natural factors over time; to provide assessments of management and land use practices; to provide early warnings of ecological changes and to provide an accurate and sensitive source of information from which conditions and trends can be defined and recognised, and management decisions made (Noss 1990; Spellerberg 1991, 1992; Kremen 1992; Kremen et al. 1993).
Therefore, indicators selected for monitoring may be environmental, ecological or biodiversity indicators depending on the purpose of monitoring. Indicator assemblages appropriate for monitoring must be sensitive to environmental change, should exhibit a diversity of life-history and ecological preferences and should be able to provide an early warning of ecological change (Kremen et al. 1993). The most desirable characteristic of environmental indicators is that they accurately indicate a particular environmental condition. The most desirable characteristic of ecological and of biodiversity indicators is that they accurately indicate/reflect the response of other members of the community, habitat or ecosystem.
'Basically, everything is an indicator of something but nothing is an indicator of
everything' (Cairns et al. 1993 p. 6).
components of an ecosystem may respond differentially to stress, all major biological groups should be evaluated (Hart et al. 1993; Cottingham and Carpenter 1998). This means that a range of indicator taxa (plant, vertebrate, invertebrate), representing all major functional guilds and covering the full range of body sizes, in the system of interest, will be necessary to produce a reliable and consistent level of information across the range of scales (Di Castri et al. 1992; Kremen 1992; Kremen et al. 1993; McLaren et al. 1998; Whitford et al. 1998).
Hammond ( 1994) has termed this the "shopping basket" approach: the use of a representative selection of indicators that together serve as a composite focal group. In combination, the tax.a in this 'shopping basket' may provide an adequate representation of the response of the community, habitat or ecosystem of interest to the stressor of interest (McGeoch 1998) and provide greater ecological understanding (New 1995).
Carabids as indicators
New (1995) suggests Arthropoda as one of 8 invertebrate group·s which may be major foci for documenting invertebrate assemblages. As one of the more well characterized arthropod taxa, carabids have strong potential as indicators (Kremen et al. 1993; Lovei and Sunderland 1996; Rykken et al. 1997), and I will explore their potential in more detail in the following chapter. Kremen et al. (1~93) suggest that documenting the distribution of selected arthropod taxa, such as carabids, will improve the spatial resolution of conservation planning for reserve selectfon and design, and a monitoring program that includes assemblages of terrestrial arthropods representing a diversity of tax.a and/or functional groups will automatically broaden the scope of the environmental factors that can be perceived.
In addition, for management of natural areas, monitoring of terrestrial arthropod indicators, such as carabids, is more likely to provide early warnings of ecological changes (Pearson and Cassola 1992; Kremen et al. 1993; Oliver and Beattie 1993; Kremen 1994). Their short generation times will enable them to respond to environmental changes more rapidly than do vertebrate indicators, which may exhibit population responses that do not become evident until too late for proactive management (Kremen et al. 1993). Arthropod indicators may also be used to assay the effects of further fragmentation on natural areas that no longer support vertebrate indicator species (Kremen et al. 1993).
SELECTION OF INDICATORS
The literature regarding the desirable and necessary characteristics of indicators is extensive, numerous authors have discussed practical and biological criteria, and a number of characteristics are repeatedly suggested. In general, ideal indicator taxa should meet the following criteria (not in priority order). The authors suggesting specific criterion are indicated by the letters following, and author details are given at the end of all listed criterion.
1. Play an important role in the ecosystem (a, b, d, f, g, i, 1, m, o, p)
• Be functionally important at all trophic levels in ecosystem or habitat such that they integrate a wide variety of biotic and abiotic variables.
• Interact in many ways with other parts of the ecosystem, so that they are reliable indicators of the general environment in which they occur.
• occupy high trophic level or at least reflect some aspect of ecosystem function
2. Be diverse and abundant (a, b, c, d, f, 1, p)
• with reasonable numbers species at any location, so that changes due to environmental conditions can be noted.
• although the number of species at a locality should be large but i:iot so large as to be unmanageable (c; d).
• represent a range of body sizes (Stork 1990).
3. Be responsive to habitat variables and sensitive to environmental change/perturbations on a convenient and detectable scale (a, b, c,
d, f, g, i, 1, n, o)
• show a prompt and accurate response to a particular cause of perturbation
• and give insights into and mechanisms underlying such change so as to provide interpretable results
4. Be widely distributed (a, b, c, d, e, f, g, h, i, k, 1, m, n, o, p)
• but include local endemics, critical faunas or 'hotspots of diversity in selected areas (New 1994).
5. Be characteristic of the ecosystem/ habitat it is desired to assess or monitor (a, b, c, d, e, f, g, h, i, k, 1, m, n, o, p)
• be expected in the area to be studied from knowledge of their biogeography and ecology.
• include a high proportion of specialist species, since specialisation of each population within a narrow habitat is likely to make them sensitive to habitat change
• a species presence at an important locality even if it is not distributed elsewhere may be an important source of information about that locality (g)
6. Be easily collected and sampled (a, b, c, d, e, f, g, h, k, 1, m, n, o)
• so practical to use
• amenable to the application of portable and standardised sampling methods operated by non-specialists
7. Be readily identifiable (a, b, c, d, f, g, i, 1, o, p)
• at species level so therefore practical to use.
• especially by people who are not experts in its taxonomy (g)
• ideally keys and field guides usable by non-specialist should be available or capable of being produced easily ( c)
• readily identifiable to the level necessary for bioindication in the field with minimal equipment (i)
, 8. Taxonomically well known and stable (e, c, h, k, 1, m, n, p)
• with an established taxonomic framework for all, or significant sections
• with most species described or recognisable, so that populations can be reliably defined
9. Biology and general life history well understood (e, h, k)
10. Have potential economic importance to agriculture, environment etc. (e, h, k, m, p)
• so that scientists and politicians, especially in developing countries where pure or basic science is frequently considered a luxury, can be convinced that this taxon is worth dedicating local personnel and resources for studies
• 'values' including range of 'commodity' or 'applied' aspects likely to engender political support
11. Some evidence that patterns observed in the indicator taxon are reflected in other related and unrelated taxa ( e, h, k)
a, Majer 1983; b, Greenslade and Greenslade 1984; c, Hellawell 1986; d, Cranston 1990; e, Noss 1990; f, Andersen 1990; g, Lower and Kendall 1990; h, Pearson and Cassola 1992; i, Hawksworth and Ritchie 1993; j, Johnson et al. 1993; k, Pearson 1994; 1, New 1993; m, New 1995; n, Saunders et al. 1998; o, Cairns et al. 1993; p, Stork 1994.
The next chapter focuses on these characteristics in the context of Carabidae.
SUMMARY
Conservation is in crisis mode as biodiversity declines at a rapid rate and anthropogenic impacts escalate. There are two options: inventory (a quick and dirty survey at the very least) and monitor all biota or use indicator taxa - a subset of the biota -to inventory and monitor. In Australia, due to resource limitations, and megadiversity, option one, to inventory and monitor all biota is just not possible. This leaves us with option two. However, it is also clear that no single species or taxon can be expected to adequately represent or indicate patterns of diversity or function as a focal group for all other species and taxa.
Beetles are a major part of invertebrate and total biodiversity. Strategies that fail to include invertebrates such as beetles, are likely to fail to conserve this, a major portion of all biodiversity. Not only should beetles and other invertebrates be considered in conservation strategies, but it is likely that carabid beetles, and other selected arthropods, may provide easy, cost effective, and sensitive means to measure and monitor the overall health of biodiversity, the state of the environment and the effects of anthropogenic stresses on biodiversity and ecosystems (Cairns et al. 1993; Noss 1990; Kremen et al. 1993; New 1995; McGeoch 1998). The tax.a in our 'shopping basket' must contain representatives of invertebrate groups such as beetles. I will explore the potential of carabid beetles as a representative for other beetles in the following chapters.