Functional Piezocrystal Characterisation under
Varying Conditions
Xiaochun Liao1,2,†, Zhen Qiu3,†, Tingyi Jiang2,†, Muhammad R. Sadiq1,†, Zhihong Huang2, Christine E. M. Demore1and Sandy Cochran4,*
Received: 29 September 2015; Accepted: 20 November 2015; Published: 2 December 2015 Academic Editor: Lorena Pardo
1 Institute for Medical Science and Technology, University of Dundee, 1 Wurzburg Loan, Dundee DD2 1FD, UK; x.liao@dundee.ac.uk (X.L.); m.r.sadiq@dundee.ac.uk (M.R.S.); cdemore@ieee.org (C.E.M.D.)
2 School of Science and Engineering, University of Dundee, Dundee DD1 4HN, UK; t.y.jiang@dundee.ac.uk (T.J.); z.y.huang@dundee.ac.uk (Z.H.)
3 Department of Electronics and Electrical Engineering, University of Strathclyde, Glasgow G1 1XW, UK; zhen.qiu@strath.ac.uk
4 School of Engineering, University of Glasgow, Glasgow G12 8QQ, UK; sandy.cochran@glasgow.ac.uk
* Correspondence: sandy.cochran@glasgow.ac.uk; Tel.: +44-141-330-3317 † These authors contributed equally to this work.
Abstract: Piezocrystals, especially the relaxor-based ferroelectric crystals, have been subject to intense investigation and development within the past three decades, motivated by the performance advantages offered by their ultrahigh piezoelectric coefficients and higher electromechanical coupling coefficients than piezoceramics. Structural anisotropy of piezocrystals also provides opportunities for devices to operate in novel vibration modes, such as thed36 face shear mode, with domain engineering and special crystal cuts. These piezocrystal characteristics contribute to their potential usage in a wide range of low- and high-power ultrasound applications. In such applications, conventional piezoelectric materials are presently subject to varying mechanical stress/pressure, temperature and electric field conditions. However, as observed previously, piezocrystal properties are significantly affected by a single such condition or a combination of conditions. Laboratory characterisation of the piezocrystal properties under these conditions is therefore essential to fully understand these materials and to allow electroacoustic transducer design in realistic scenarios. This will help to establish the extent to which these high performance piezocrystals can replace conventional piezoceramics in demanding applications. However, such characterisation requires specific experimental arrangements, examples of which are reported here, along with relevant results. The measurements include high frequency-resolution impedance spectroscopy with the piezocrystal material under mechanical stress 0–60 MPa, temperature 20–200˝C, high electric AC
drive and DC bias. A laser Doppler vibrometer and infrared thermal camera are also integrated into the measurement system for vibration mode shape scanning and thermal conditioning with high AC drive. Three generations of piezocrystal have been tested: (I) binary, PMN-PT; (II) ternary, PIN-PMN-PT; and (III) doped ternary, Mn:PIN-PMN-PT. Utilising resonant mode analysis, variations in elastic, dielectric and piezoelectric constants and coupling coefficients have been analysed, and tests with thermal conditioning have been carried out to assess the stability of the piezocrystals under high power conditions.
1. Introduction
Piezocrystals of the relaxor-PT type such as (x)Pb(Mg1/3Nb2/3)O3-(1-x)PbTiO3 (PMN-PT), (x)Pb(In1/2Nb1/2)O3-(1-x-y)-Pb(Mg1/3Nb2/3)O3-(y)PbTiO3(PIN-PMN-PT) and Mn-doped PIN-PMN-PT (Mn:PIN-PMN-PT), respectively termed Generations I, II and III, have demonstrated electrical, mechanical and piezoelectric properties that can be translated into higher electroacoustic transducer performance than can be achieved with conventional piezoceramics [1] and PMN-PT has now established itself as the material of choice in biomedical ultrasound transducers [2–5]. However, this application has relatively undemanding requirements in terms of average power and operation at elevated temperature and pressure because of the output power and temperature safety limitations imposed by medical applications, and this matches well with the limited coercive field,Ec, mechanical quality factor,Qm, and ferroelectric rhombohedral-tetragonal (FRT) phase transition and Curie temperatures (TRTandTC) of PMN-PT. In contrast, there are numerous applications, for example in underwater sonar, the oil and gas industries, medical therapy and ultrasound-actuated tools, where high average power handling and elevated temperature and pressure may be encountered [6,7]. These applications have prompted research into PIN-PMN-PT and Mn:PIN-PMN-PT, the former now available commercially (e.g., CTG Advanced Materials, Bolingbroke, IL, USA) and the latter in small quantities for testing purposes (TRS Technologies, State College, PA, USA).
Almost all piezocrystal production is based on the Bridgman technique [8,9], in which individual boules are grown in Pt crucibles, typically of 411diameter for commercial supply. Unlike piezoceramic,
the production of which by extrusion permits continuous and close to uniform processing, piezocrystal boule growth carries the possibility of boule-to-boule variation and, more fundamentally, involves inherent compositional gradients in the PT fraction. Continuous growth has been under development for some time [10] to reduce this problem but still awaits commercial adoption. All these lead to greater variations in material properties during production than are typical of piezoceramic. In turn, there is greater demand for routine measurement of the characteristics of piezocrystal. For the design of many electroacoustic transducers, the full elastoelectric matrix is required [11]. This can be measured with a standard process [12] based on analysis of the complex electrical impedance spectra of several material samples, each supporting a single, primary ultrasonic mode. Because of the possibility of variation between samples and the difficulty in achieving self-consistency in measurements from different samples, alternative techniques have been developed using ultrasound transit time measurement and resonant ultrasound spectroscopy [13,14] to obtain the elastic parameters, with the results combined with electrical measurements to obtain the full elastoelectric matrix. In this way, the material properties can be obtained from just one sample. This technique has also been extended to measurement at elevated temperatures [14] but not yet at pressures above ambient.
Whilst the full elastoelectric matrix is necessary for detailed transducer design using contemporary computer-modelling and virtual prototyping tools such as finite element analysis (FEA, e.g., PZFlex, Weidlinger Associates Inc., Mountain View, CA, USA), it is also possible to gain significant insight into piezocrystal properties and behaviour through characterisation of specific sample configurations [15]. This approach is appropriate when new materials are in development, both piezocrystals and other types such as Pb-free piezoceramics [16]. Although only limited subsets of material properties can be obtained, they are nevertheless valuable in controlling material production, in estimation of likely transducer properties, and sometimes for transducer design using constrained models [17]. Crucially, this approach also allows the materials to be characterised under practical conditions of elevated temperature, above ambient uniaxial pressure, and at high electrical excitation levels, the latter having the potential to cause self-heating and to elicit the effects of coercive field limits. In addition, it is possible to explore behaviour relating to specific material properties, such as acoustic modes relating to the unusually highd31,d32,d15andd36coefficients of relevant piezocrystal cuts [1], which can have many practical applications.
stability. In industry, a datasheet is often supplied on delivery, including parameters such as permittivity,εij, piezoelectric constants,dij, elastic compliance constants,sij, electromechanical coupling coefficients,kij,and frequency constant,Nij. These parameters define the material’s functionality in a particular vibration mode and always in an ambient environment. By examining the parameters in the datasheets, consistency across different piezocrystal samples can be checked within a batch or between different batches. It is rare to check the piezocrystal stability under varying conditions in industrial production unless a new application specifically encourages collaboration with academics, e.g., to examine a newly designed composition or mode [18]. Collaboration between industry and academic research then motivates more detailed and comprehensive characterisation [19,20] and the possibility of new standards such as the one under development, under the auspices of the IEEE, for relaxor-based piezocrystal for transducer and actuator applications [21].
In academic research, performance characterisation frequently includes measurement of the full elastoelectric matrix to gain understanding of a material under test [22–24]. This full matrix characterisation can be combined with investigation of compositional variation, domain engineering and special cuts to explore possible ultrahigh piezoelectric constants and novel vibration modes [8,24–27]. In addition to the full elastoelectric matrix, some key parameters are also measured, includingkij, dielectric loss, tanδe, and mechanical quality factor,Qm. For particular applications, a figure of merit (FOM) may also be calculated, such askij2Qmfor active underwater transducers or dhgh/tanδefor passive underwater hydrophones wheredhandghare the piezoelectric constants under hydrostatic conditions [1].
Stable piezocrystal performance intrinsically relies on phase stability and can thus deteriorate significantly during phase transitions caused by external conditions such as temperature, pressure and electrical excitation. Stability is always explained in relation toEc,TCandTRT, and can be quantified as a percentage variation resulting from applied conditions, e.g.∆dij/dij[28,29]. Characterisation of piezocrystals under deliberately conditioned fields is used to mimic real applications; this is crucial to understand performance variation, to design piezocrystal transducers with FEA, and to apply piezocrystal devices in practice. Characterisation as a function of temperature is usually conducted in an oven or thermal chamber; in this study, we also report self-heating as a parameter in stability testing and characterisation. Such self-heating directly relates to the mechanisms of dielectric, piezoelectric and mechanical losses, the equations for which have been derived for the common length-extensional (LE), length-thickness-extensional (LTE) and thickness-shear (TS) modes in piezoceramics but not yet in piezocrystal [30,31]. Pressure can be applied hydrostatically or along specific axes. Whilst hydrostatic pressure may appear most relevant, many high power transducer designs for which piezocrystal is suitable, such as the Tonpilz type for underwater SONAR [32,33] and various ultrasonically-actuated devices [8], include a uniaxial prestress. The simple uniaxial configuration can thus generate valuable results [34] and is one focus of this paper. In practice, piezocrystal may be subject to combinations of temperature and pressure making the situation more complicated and performance stability worse, and there is thus a pressing need for experimental exploration of such situations.
This paper focuses on application-oriented characterisation of the three generations of piezocrystals, all grown conventionally with the Bridgman method. The relatively diverse measurement methods that have been employed are described inSection 2. These include electrical impedance spectroscopy with standard instrumentation, which allows high average-power excitation when configured appropriately. In Section 3, a functional characterisation system is introduced including environmental and excitation factors relating to potential passive and active applications respectively.Section 4outlines measurement conditions and results. The use of standard measurement instrumentation is combined with environmental heating in the range from ambient temperature to approximately 200˝C and with the application of uniaxial pressure up to 60 MPa, consistent with full
coefficients and comparison is made with the authors’ use of the Berlincourt method. Ultrasonic transit-time testing can also be utilised to obtain elastic properties. InSection 5, the resulting material characteristics are related to fundamental properties, including crystallographic phase transitions and changes in elastic, dielectric and piezoelectric properties, and comparisons with other measurement techniques are discussed. Conclusions are drawn inSection 6and measurement avenues open to further exploration are considered.
2. Characterisation Methods for Piezoelectric Materials
2.1. Material Properties and Measurement Methods
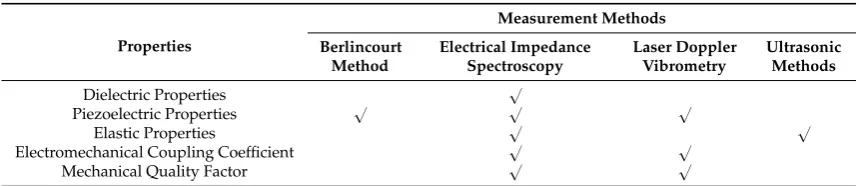
[image:4.595.83.513.390.483.2]The translation of microstructural characteristics of piezocrystals such as crystal phase, domain configuration and polarization dynamics into macroscopic properties determines functional performance, with the macroscopic properties mathematically represented by material properties in tensor form. Using reduced notation, these are collated in matrices which can take multiple forms according to convenience. Here, we assume the full elastoelectric matrix contains elastic (stiffness), dielectric and piezoelectric properties,cij,εijanddij. For functional evaluation, another two performance characteristicskijandQmare also often used. The measurement of all these characteristics can be made using: (1) the Berlincourt method; (2) electrical impedance spectroscopy; (3) LDV; and (4) ultrasonic methods. Not all four methods can characterise all the properties; compatibility between properties and the measurement methods is shown in Table1.
Table 1.Compatibility between piezocrystal properties and measurement methods.
Properties Measurement Methods Berlincourt Method Electrical Impedance Spectroscopy Laser Doppler Vibrometry Ultrasonic Methods
Dielectric Properties ‘
Piezoelectric Properties ‘ ‘ ‘
Elastic Properties ‘ ‘
Electromechanical Coupling Coefficient ‘ ‘
Mechanical Quality Factor ‘ ‘
TheBerlincourt method[35] measures the fundamental piezoelectric charge coefficient,dij, based on the direct piezoelectric effect, when electrical charge is generated from applied mechanical force. During quasi-static measurement, the mechanical force is applied at a frequency lower than any resonance in the sample under test. The Berlincourt method is thus insensitive to sample geometry, as long as electrodes are present to make electrical contact. It can obtain comparabled33values from both a tall, narrow LE mode bar and from a thin thickness-extensional (TE) mode plate, if the two samples are both fully polarised. Variations ofd33values in practical measurement may be induced by incomplete polarisation, as previously reported for PMN-PT piezocrystal plates with different thicknesses [36]. Commerciald33meters provide a fast, convenient way to measured31andd15values with specially designed fixtures (e.g., ZJ-6B, CTG Advanced Materials, Bolingbroke, IL, USA).
Based on the resonance frequencies of these samples, all the fundamental piezoelectric constants can be calculated. However, this requires multiple samples which can lead to inconsistency in piezocrystal characterisation.
LDV is a direct, non-invasive way to measuredijbased on the inverse piezoelectric effect. In this method, the LDV measures the surface displacement when a non-resonant electrical field is applied across the electrodes of a given sample;dijcan be calculated from the measured displacement, applied voltage and sample geometry. The vibration boundary conditions must be strictly respected by mounting the sample on a nodal plane and the measurement frequency should differ from any resonance in the sample to avoid the interference from the effect ofQm. LDV can also be used with frequency sweeping across a resonance to evaluate bothkijandQm.
A simple ultrasonic method based on the pulse-echo technique can be used to measure the elastic properties of solid materials. The full set of stiffness constants can be determined with longitudinal and shear waves applied in different orientations. It has been suggested that this method provides better accuracy in determining the elastic constants of piezoelectric material than the impedance spectroscopy method [38], but it has insufficient accuracy for the piezoelectric constants. A combined ultrasonic-resonance method has therefore been developed by Caoet al.[39], and this also reduces the number of samples required. Recently, the ultrasound method has been combined with inverse electrical impedance spectroscopy to determine the full elastoelectric property matrix from only one sample [13]. This technique guarantees self-consistency of the full property matrix by eliminating sample-to-sample variation.
2.2. Other Methods for Sample Size Reduction and Loss Mechanism Characterisation
Some other newly proposed characterisation methods for piezocrystals are in development. Drawing on previous work in geology and passive material characterization, resonant ultrasound spectroscopy (RUS) has been used to determine the elastic properties of a hard lead zirconate titanate (PZT) composition using one sample under different temperature conditions [14]. However, the single sample is usually a cube which RUS requires to be mounted on two body diagonal corners. Care must be taken to avoid damage during preloading, and the mounting method makes it difficult to test these samples under high stress conditions. Another method has been proposed based on loss mechanisms [30] using loss factor equations derived for the modes associated withk33,k31,k15andkt. Based on these, the loss factors can be easily characterised for dielectric, piezoelectric and elastic losses rather than to measure the hysteresis between stress, strain, electric displacement and electric field. This method may help understanding of heating effects in piezoelectric transducers, but it has not yet been applied to piezocrystals.
2.3. Requirements of Piezocrystal Samples
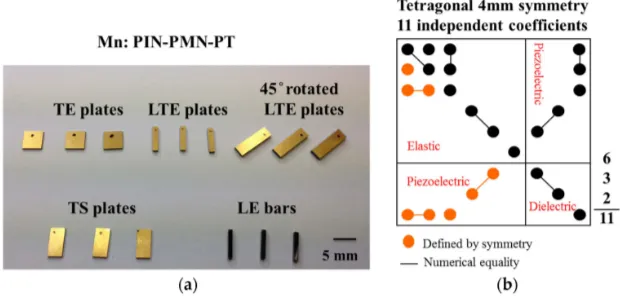
For many years, the IEEE standard method and its precursors [11] have been used to determine the full elastoelectric matrix. This requires a separate material sample with a specified geometry for each of several defined propagation modes, as shown in Figure1. The number of samples differs according to the crystallographic symmetry of the material system to be characterised. The (001)-poled piezocrystal has 4 mm symmetry and therefore requires five samples, operating in the TE, TS, LE and LTE modes, with the latter also required 45˝-rotated. Two of these samples raise particular issues. The
sometimes adjusted, e.g., to 1:5 or in the authors’ experience and as published [40,41] as low as 1:3, provided that unimodal LE operation is observed explicitly.
Figure 1.(a) Sample set of Mn:PIN-PMN-PT for full elastoelectric matrix; (b) Dependence of elastic, piezoelectric and dielectric constants for 4 mm symmetry in full elastoelectric matrix.
Given the variation in material properties along a crystal boule and potential variations in poling, the use of multiple samples to provide subsets of the elastoelectric matrix raises the possibility of inconsistency in the matrix and this has been found to be the case in practice [15]. Therefore, the alternative methods outlined previously are under development, with the aim to reduce the number of samples required [13,14]. However, such methods leave two issues unresolved. First, it would be very unusual to use a multimodal piezoelectric material configuration in a practical electroacoustic transducer, as the intention is usually to base such transducers on unimodal configurations to avoid performance degradation by cross-coupling of the modes. Thus, the single sample on which characterisation is based is likely to differ from the configurations used in practical transducers with consistency of poling requiring particular attention. Second, compositional variation along the length of the boule and potential variation through insufficiently controlled growth mean that measurement even of a single sample does not represent the whole boule. Nevertheless, single sample characterisation overcomes difficulties with self-consistency because of sample-to-sample variation and is thus advantageous compared with the standard method.
An alternative approach is to obtain incomplete but useful measurements from selected material configurations. For example, for the many electroacoustic transducers utilising the TE mode, very useful information can be gained by characterising TE mode samples and the same principle applies for other modes. Since most transducers intentionally exploit only one mode, a great deal of value can be gained from such characterisation in estimating transducer performance, checking sample-to-sample uniformity and elucidating behaviour under different conditions of temperature and pressure. This approach is the one taken here with measurements illustrated in the following sections based on TE, LTE and noveld36face shear (FS) mode behaviours. In this context, the samples on which most results in this paper are based are TE mode with typical thickness of 0.5 mm and essentially unimodal behaviour achieved over the fundamental ultrasonic frequency range by meeting the constraint of a width:thickness ratio of 10:1. Thus, most samples have dimensions 5 mm ˆ5 mmˆ0.5 mm. Furthermore, a representative range of properties is often used. Here, we focus on the dielectric coefficient,εr33S, the stiffness,c33D, the piezoelectric coefficient,e33, and the electromechanical coupling coefficient,kt, as these provide useful information across a wide range of materials and applications. 3. Piezoelectric Functional Characterisation System
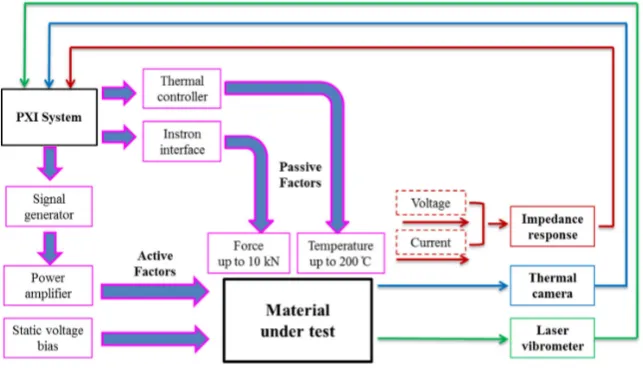
fan-assisted oven is integrated, allowing penetration of the roof and floor by the MTS applicator bars. These instruments are controlled with a PXI-based PC running software implemented in LabVIEW (National Instruments, Houston, TX, USA). This software is able to select a particular pressure profile with multiple levels in the range 0–60 MPa and simultaneously control the oven temperature in the range from ambient to 200˝C. Data can be acquired over multiple contiguous frequency ranges, thus
[image:7.595.138.460.318.502.2]extending the number of sampling points arbitrarily beyond the standard limit of 801 points from the impedance analyser, consequently enhancing the measurement resolution. In practice, the system is operated in a mode in which a given temperature is set, starting with the lowest temperature required, then the pressure is incremented, applied uniaxially with brass contact pads dry-coupled to the sample under test to minimise energy leakage from it. After the pressure has reached the specified maximum and the first set of measurements has been completed, the pressure is reduced to the minimum, the temperature is increased to the next set level, and the pressure cycle is repeated, as shown in Figure3g. Dependency of material properties on previous conditions must thus be considered in the analysis of the results, which is based on calculation of material properties from resonant frequencies observed in the impedance spectra. This basic configuration focuses on the environmental factors of elevated temperature and pressure, targeting passive piezocrystal applications.
Figure 2.Piezoelectric functional characterisation system diagram.
4. Piezocrystal Characterisation
Based on the designed piezoelectric functional characterisation system, measurements were performed on three generations of piezocrystals. Most measurements were carried out on Generation II and III, 33% PIN-PMN-PT and Mn:PIN-PMN-PT samples, respectively, while we also include measurement results on PMN-29% PT samples from the literature [15] where they provide useful data for this paper. Effects of increased environmental temperature and pressure were investigated under passive conditions,i.e.with the piezocrystal samples un-driven. Electric field effects were determined with the piezocrystal driven at various voltages. In addition, LDV was used under ambient conditions to measure the piezoelectric constantsd33,d31,d15andd36, with the results compared with the values obtained by the Berlincourt method and electrical impedance spectroscopy. Although only applied to Mn:PIN-PMN-PT, this is sufficient to demonstrate characterisation with LDV.
4.1. Environmental Temperature and Pressure Effects
4.1.1. Impedance Spectra with Elevated Temperature and Pressure
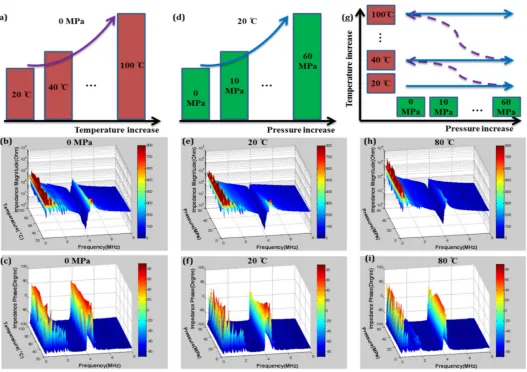
As an illustration of our passive characterization methods, Figure3presents electrical impedance spectra of a 5 mmˆ5 mmˆ0.5 mm TE mode plate of Mn:PIN-PMN-PT with varying temperature,T, and pressure,P. Although rarely found in the materials literature, this is a familiar data presentation format for transducer developers evaluating material and device performance. The frequency ranges for these graphs were chosen to centre the TE-mode resonance with lateral resonances also appearing at much lower frequencies. Although these minor modes are not analysed further here, they provide clear evidence of behavioral changes with environmental conditions. As described previously, temperature and uniaxial compressive stress were applied simultaneously to the sample, following a pre-programmed testing protocol. Although impedance spectra were recorded for every condition and further analysed in later sections, only selected results are presented here: Figure3a–c present results for 20˝CďTď100˝C withPambient; similarly, Figure3d–f present results for 0 MPaďPď60 MPa
at ambient temperature; and Figure3g–i show the combined effects ofTandP, withT= 80˝C and
0 MPaďPď60 MPa.
As expected, Mn:PIN-PMN-PT is relatively stable over the temperature range up to 100˝C which
is most important for applications and which was used for the measurements shown in Figure3, taking into account thatTRT> 120˝C. The resonance frequencies and magnitudes for the minor lateral resonances and the main TE resonance decrease as onlyTincreases. Similarly, the application of onlyPimpedes vibration in both the planar and thickness directions, manifesting as decreases in the resonance frequencies and magnitudes; the effect of pressure is clear even at levels as low asP= 5 MPa. CombinedTandPhave increased influence on piezoelectric behaviour, with a significant decrease and then a slight recovery forP> 40 MPa, as seen in Figure3i.
4.1.2. Property Variation with Environmental Temperature
Using the IEEE resonance method, it is possible to extract specific material properties from the data presented in Figure3. With the TE mode plates under test,εr33S, kt,e33andc33Dcan be derived from:
εr33S“t¨C{ pA¨εoq (1)
kt“
d
πfs 2fptan
ˆ
π
2¨ fp´fs
fp
˙
(2)
cD33“4ρt2fp2 (3)
e33 “ kt
b
ε33S¨cD
wheretis sample thickness,ρis density andAis the lateral surface area of the sample plate.Cis the capacitance measured at a frequency double the sample’s mechanical resonance frequency;fpis the equivalent circuit parallel resonance frequency measured at peak electrical impedance magnitude, andfsis the equivalent circuit series resonance frequency measured at minimum electrical impedance magnitude.
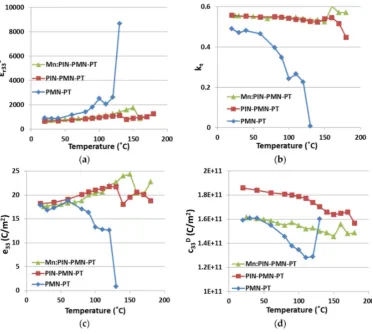
Figure 4 presents the variations in the four selected piezoelectric properties with elevated environmental temperature for all three generations of piezocrystals. These measurements were conducted in the range 20˝CďT ď180˝C. For PMN-PT, for which the expected range for use
in applications is approximately 20–80 ˝C,ε
r33S shows reasonable uniformity up to T~80 ˝C. A perturbation is then observed in the interval 90 ˝C <T < 120˝C, corresponding with the phase
transition zone [42]. With temperature increasing towards 130˝C,ε
r33S experiences a significant increase which indicates the material is depoled and piezoelectric behaviour disappears. The same trends are observed forkt,e33andc33D. In comparison, PIN-PMN-PT maintains piezoelectric behavior and is stable forTď120˝C. A phase transition then occurs in the range 120˝C <T< 160˝C, about
30˝C higher than for PMN-PT. ForT> 160˝C, the piezoelectric behaviour deteriorates significantly, as
expected when approachingTC, reported at around 180˝C [43]. Mn:PIN-PMN-PT is expected to be less
temperature dependent than PIN-PMN-PT and PMN-PT because of the presence of Mn dopant [25]. In Figure4, the phase transition of Mn:PIN-PMN-PT is shown in the range 140˝C <T< 170˝C, andT
Cis not approached at or below 180˝C, as expected from the literature [27]. Table2lists the variations
of the four properties in details, over the range of 20˝CďTď80˝C before PMN-PT piezocrystal
[image:10.595.112.485.384.718.2]experiences theFRTphase transition.
Table 2.Variation withTfor three generations of piezocrystals, 20˝CďTď80˝C (ReferenceT= 20˝C).
(20˝C <T< 80˝C) ε
r33S(%) kt(%) e33(%) c33D(%)
PMN-PT +53.7 ´19.2 +5.2,´5.9 +1.1,´8.5
PIN-PMN-PT +29.0 ´1.4 +10.4 ´2.7
Mn:PIN-PMN-PT +26.7 ´1.1 +6.9 ´4.1
+: maximum variation above the reference;´: minimum variation below the reference.
4.1.3. Property Variation with Uniaxial Pressure
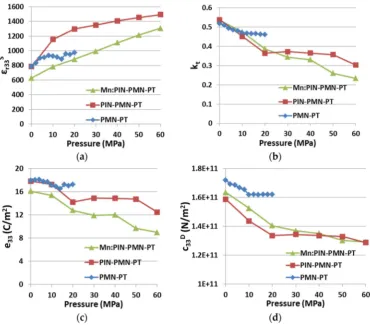
[image:11.595.113.484.312.637.2]Figure5presents the variations ofεr33S, kt,e33andc33Dwith applied uniaxial pressure for all three generations of piezocrystals. The results presented for PIN-PMN-PT and Mn:PIN-PMN-PT piezocrystal were obtained using the automatic system described inSection 3and the results for PMN-PT are taken from our previous work for comparison. Considering the range 0 MPaďPď20 MPa under which the PMN-PT sample was tested,Pappears to affect PMN-PT material relatively little compared with the other two materials. This may be because different test fixtures were used to contact the samples in these two sets of experiments.
Figure 5.Effect ofPon three generations of piezocrystals (a)εr33S; (b)kt; (c)e33; and (d)c33D. (PMN-PT results adapted from [15]).
significantly hardened the material to allow it to work under more demanding conditions than can be sustained with Generations I (PMN-PT) and II (PIN-PMN-PT) piezocrystals.
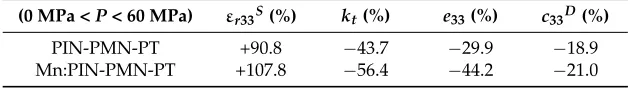
[image:12.595.140.455.204.248.2]Details of the variations between PIN-PMN-PT and Mn:PIN-PMN-PT are listed in Table3, with pressure ranging from 0 to 60 MPa. The variations of PMN-PT are not included because of the different, more limited pressure test range,P< 20 MPa, to which it was subjected.
Table 3. Variation withPfor two generations of piezocrystals, 0 MPaďPď60 MPa (Reference
P= 0 MPa).
(0 MPa <P< 60 MPa) εr33S(%) kt(%) e33(%) c33D(%)
PIN-PMN-PT +90.8 ´43.7 ´29.9 ´18.9
Mn:PIN-PMN-PT +107.8 ´56.4 ´44.2 ´21.0
+: maximum variation above the reference;´: minimum variation below the reference.
4.1.4. Property Variation with Environmental Temperature and Uniaxial Pressure
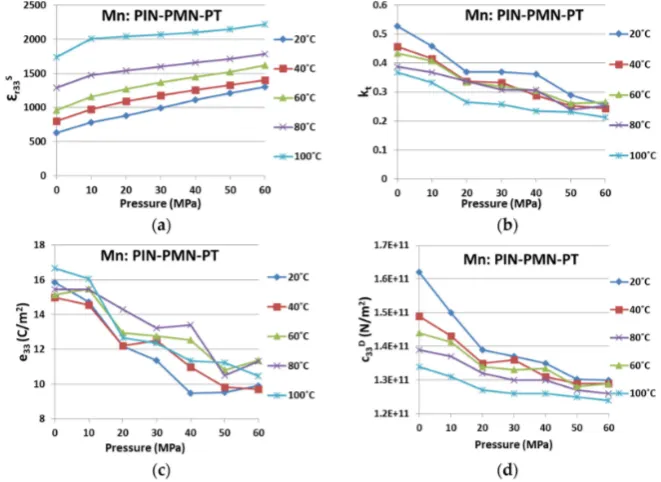
To look at the dual influences from environmental temperature and uniaxial pressure simultaneously, Figures6and7present the variations for the four key piezoelectric properties in PIN-PMN-PT and Mn:PIN-PMN-PT, respectively. Variations in the characteristics are shown with environmental conditions ofTandP, for 20˝CďTď100˝C with a step of 20˝C and for 0ďPď60 MPa
with a step of 10 MPa.
As illustrated in Figure6, for 20˝CďTď80˝C, bothktandcD
33of PIN-PMN-PT decrease withP, whileεr33S, on the contrary, increases with increasingTandP, ande33decreases withPand increases withTin general. AtT= 100˝C, the opposite trend was observed, withkt, cD
33ande33rising, and
εr33Sfalling in value following increasedP. It is believed that the combined effect of applied cycles ofPand increases inThas induced a phase transition at lower temperature, with the piezocrystal transferring from the rhombohedral to orthorhombic phase, as suggested by McLaughlin [41].
[image:12.595.109.488.454.719.2]In comparison, Mn:PIN-PMN-PT in Figure7behaves similarly to PIN-PMN-PT, except that the same general trends are maintained for all four properties, even atT= 100˝C. Again, this provides
[image:13.595.132.463.183.424.2]evidences that Generation III piezocrystals are more resilient toTandP, and thus likely to be more suitable for high power applications. However, as indicated in Tables3and6the absolute variations in Mn:PIN-PMN-PT are bigger than for PIN-PMN-PT. This is because the deteriorating trends shown for Mn:PIN-PMN-PT withTandP,especially withP, did not recover after the phase transition.
Figure 7. Property variation caused by environmental temperature and uniaxial pressure for Mn:PIN-PMN-PT on (a)εr33S; (b)kt; (c)e33; and (d)c33D.
4.2. Electric Field Induced Temperature Rise
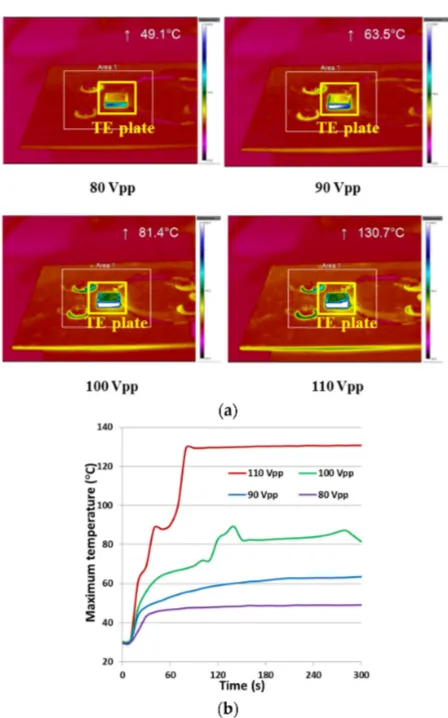
In high power applications such as active SONAR, conventional piezoelectric materials are subject to high cyclic electric fields to generate large displacement outputs. In turn, the intrinsic mechanical, piezoelectric and dielectric losses generate considerable heat, leading to an increase inT and consequently affecting the material’s phase structure, piezoelectric properties and performance stability. This performance deterioration is exacerbated when the cyclic electric field is applied continuously for long periods of time, especially in industrial applications, such as ultrasonic cleaning, cutting and welding. In the context of integration of piezocrystals in such applications, it is necessary to carefully investigate these materials at different operating temperatures, and hence drive voltages. Both temporal and spectral responses were examined for performance assessment. First, characterisation of the temporal response was conducted on a 10 mmˆ10 mmˆ1 mm PMN-PT TE plate, with AC driving voltages of 80, 90, 100 and 110Vpp, with an RF power amplifier (31002A, Electronics & Innovation, Rochester, NY, USA). The driving voltage was set at the plate’s resonant frequency of 2.19 MHz, and was applied continuously for 5 min. The thermal response was recorded with a thermal imaging camera (TIM-160, Micro-Epsilon Ltd., Ortenburg, Germany), as shown in Figure8.
From the thermal maps of the TE plate sample in Figure8a, it can be seen that the maximum electric field-induced temperatures were 49.1, 63.5, 81.4 and 130.7˝C respectively for 80Vpp, 90Vpp,
68.9 and 96.9˝C respectively. These increases may indicate a phase transition, as reported recently as
[image:14.595.185.409.121.480.2]TRT = 97˝C for PMN-PT [42].
Figure 8.(a) Thermal mapping and (b) Maximum spot temperature of a PMN-PT TE plate driven with different voltages for 5 min.
Subsequently, characterisation of electric field-induced temperature increases was performed with respect to the spectral response, measuring the electrical impedance of the samples at induced temperatures maintained at stable levels. This spectral characterisation was performed on PIN-PMN-PT and Mn:PIN-PMN-PT TE plates with dimensions 5 mmˆ5 mmˆ0.5 mm. The electric field-induced temperature was maintained at successive temperatures of 40, 60, 80, 100 and 120˝C with the plate driven at its TE resonance with the AC driving voltage controlled adaptively.
Impedance spectra were measured in the range 10 Hz–10 MHz with 800 sampling points, using a 10:1 passive voltage probe (N2862B, Agilent Technologies, Santa Clara, CA, USA) and a current probe (P6021A, Tektronix, Plano, TX, USA). As with the use of commercial impedance analyser systems, fixture compensation was performed to ensure accurate measurement calibration.
In Figure9b, Mn:PIN-PMN-PT shows significant changes in the resonant impedance peak at 120˝C with an average driving voltage of 26Vpp. For PIN-PMN-PT in Figure9a, the corresponding
peak changes significantly at the lower temperature of 100 ˝C, with an average driving voltage
of 28Vpp. These changes in impedance peaks may indicate the critical phase transition point for piezocrystals. For PIN-PMN-PT, the TE plate sample was depolarised at 120˝C with an average
driving voltage of 84Vpp. The Mn:PIN-PMN-PT sample exhibited better thermal stability at high electric field than PIN-PMN-PT sample. It is also notable thatT= 120˝C is far belowT
Figure 9. Impedance spectra of (a) PIN-PMN-PT and (b) Mn:PIN-PMN-PT when the electric field induced temperature was maintained as 40, 60, 80, 100 and 120˝C.
4.3. Laser Doppler Vibrometry under Ambient Conditions
LDV is based on the use of the inverse piezoelectric effect to measure sample surface vibration amplitude with applied electrical field. Not needing physical contact with the sample, LDV avoids the interference and energy loss from ultrasonic coupling at the interface that is unavoidable in most other measurements. It can be performed at a single measurement spot or by scanning a surface to obtain a mode shape.
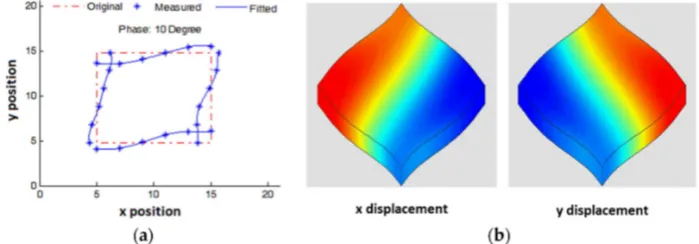
In the work reported here, LDV was first used to measure the mode shape of ad36 FS plate by scanning the four side surfaces around the plate, with both vibration amplitude and phase data acquired. Based on the measured data, the FS mode shape can be obtained by sweeping through the phases. In Figure10a, the red dashed lines represent the original shape of the plate; the blue asterisks represent the LDV-measured vibration at 10˝ phase; the blue solid lines represent the curves fitted
to the measured data points, illustrating the plate shape profile for FS vibration. The measured FS mode shape had a good agreement with the FS mode shape simulated with the PZFlex FEA software package, with displacements mapped alongxandydirections, as shown in Figure10b.
[image:15.595.122.472.605.727.2]LDV was also used to measure piezoelectric constants, dij. For a 10 mm ˆ3 mm ˆ1 mm Mn:PIN-PMN-PT LTE plate with 45˝ rotation about thez axis, the piezoelectric constant can be
determined with:
d31“ S1 E3
“ A1{l
V3{t (5)
[image:16.595.119.479.237.382.2]whereS1represents the strain along the 1st direction, measured as the ratio between the vibration amplitude,A1and the plate’s length,l, andE3represents the electric field along the 3rd direction, calculated as the ratio of applied voltage,V3,to the thickness,t. The LDV was set up as shown in Figure11a, with a Mn:PIN-PMN-PT LTE plate mounted on a spring-loaded electrode fixture and the beam focused on the side of the LTE plate.
Figure 11. (a) Laser vibrometry characterisation setup with a Mn:PIN-PMN-PT LTE plate with (b) responses of voltage, current, and vibration amplitude when a constant AC 5 V driving voltage was swept from 100 to 200 kHz.
An AC signal of constant 5 V amplitude was swept spectrally across the LTE resonance from 100 to 200 kHz. The vibration amplitude,V3and current are shown in Figure11b. V3dropped and the current increased at resonance because of the low electric impedance; the vibration amplitude increase approximately matched the increase in current. Applying Equation (5) off resonance,d31= 457 pC/N was measured at 100 kHz for this sample, a value similar to the figure of 474 pC/N provided by the supplier (TRS Technologies, State College, PA, USA).
[image:16.595.121.473.657.750.2]To compare the LDV measurement with different methodologies, a study was conducted with Mn:PIN-PMN-PT samples with different vibration modes, as shown in Table4. All the measurements were performed locally under ambient conditions, except for the material supplier’s data. There is reasonable agreement between the different techniques, with no single technique consistently appearing to over or underestimate the coefficient values. Equally, however, this data set offers no gold standard measurement techniques in close agreement with each other.
Table 4.Characterisation of piezoelectric constantdijon Mn:PIN-PMN-PT under ambient conditions
with different vibration modes measured with different techniques.
(pC/N) Mode Berlincourt Method IEEE Method LDV Manufacturer Data
d33 LETE 10531062 1492- 1160- -
-d31 LTE 478 458 402 467
d3145z∆ LTE 518 493 457 474
d15 TS 156 120 156 121
d36 FS - - 1109 1128
5. Discussion
[image:17.595.109.487.237.346.2]Table5summarises the basic temperature and pressure characteristics of the three generations of piezocrystal as considered in this paper. Where comparison is possible with the literature, it is generally in good agreement, except for a much higher figure forTRT for Mn:PIN-PMN-PT, as measured approximately in the present work. In consideration of high power transducer operation, this suggests that Generation II and III piezocrystals (PIN-PMN-PT and Mn:PIN-PMN-PT respectively) have usefully raised temperature limits. However, material suppliers may care to look into the issue of phase transitions under the influence of pressure for widest acceptance of piezocrystals.
Table 5.Basic comparison between three generations of piezocrystals.
Crystal TC♦(˝C) TC* (˝C) TRT♦(˝C) TRT* (˝C)
PMN-PT 135 «130 96 «100
PIN-PMN-PT 191 >180 125 «130
Mn:PIN-PMN-PT 193 >180 119 «150
Crystal σRO♦(MPa) σRO* (MPa) Ec♦(kV/cm) Eint♦(kV/cm)
PMN-PT «15 MPa «10 MPa 2.3 0.0
PIN-PMN-PT «20 MPa «20 MPa 5.0 0.0
Mn:PIN-PMN-PT >21 MPa >20 MPa 6.0 1.0
♦Literature values [1,28,34,40,41]; * Measured values in this study.
Figure12summarises the variation in the key material parameters with temperature and pressure, presented in a format to allow easier interpretation and comparison. As expected from many previous reports in the literature, εSr33 increases withT; however, changes inP have less effect. Electromechanical coupling,kt, and stiffness,cD
33, are significantly higher at ambientTandP, and they generally fall as either and both of these parameters increases. In both cases, the reduction is likely to be sufficient to require a device designer to take it into account if the operating envelope of the device approaches the limits ofTandPconsidered here. The most complicated characteristics are exhibited bye33. Mn:PIN-PMN-PT shows relatively little change withTbut a generally falling trend withP. PIN-PMN-PT shows similar characteristics up to 60˝C then a recovery to the ambient
[image:17.595.128.469.538.674.2]temperature values for all values ofP. This may be caused by a phase transition mediated byTandP. However, further work is required to confirm this.
Figure 12.A summary of the variation of key parameters of PIN-PMN-PT and Mn:PIN-PMN-PT with varying temperature and pressure onεSr33,kt,cD33,e33and one figure of merit (kt2e33).
P. We believe this tends to support our proposal that a phase transition is responsible for the variation under the extreme of the conditions considered here. It is also notable that the values for FOM reduce very significantly asTandPincrease.
Table 6.(a) Detail of FOMkt2e33(C/m2) for PIN-PMN-PT with variation inTandP; (b) Detail of FOM
kt2e33(C/m2) for Mn:PIN-PMN-PT with variation inTandP.
(a)
T/P 0 MPa 10 MPa 20 MPa 30 MPa 40 MPa 50 MPa 60 MPa Variation
20˝C 5.16 3.52 1.89 2.07 1.99 1.88 1.15 ´77.8%
40˝C 3.36 2.26 1.65 1.74 1.82 1.46 1.00 ´70.3%
60˝C 3.04 2.23 1.62 1.59 1.58 1.56 1.14 ´62.4%
80˝C 2.62 2.01 1.89 1.67 1.60 1.55 1.48 ´43.5%
100˝C 1.80 1.96 2.12 2.24 2.39 2.20 2.60 44.7%
Variation ´65.1% ´44.4% 12.2% 8.3% 20.6% 17.1% 127.2% ´49.5%
(b)
T/P 0 MPa 10 MPa 20 MPa 30 MPa 40 MPa 50 MPa 60 MPa Variation
20˝C 4.42 3.09 1.67 1.56 1.24 0.80 0.64 ´85.6%
40˝C 3.12 2.50 1.38 1.39 0.91 0.62 0.57 ´81.6%
60˝C 2.84 2.56 1.44 1.29 1.16 0.73 0.80 ´71.9%
80˝C 2.32 2.08 1.62 1.25 1.26 0.60 0.72 ´68.9%
100˝C 2.25 1.77 0.89 0.82 0.62 0.60 0.47 ´79.1%
Variation ´49.2% ´42.7% ´46.6% ´47.5% ´50.0% ´25.0% ´26.3% ´89.4%
As summarised in Tables5and6deterioration in piezocrystal functional performance under a combination of temperature, stress and electric field has been noted and has remained of research interest since investigations started in PMN-PT. Early characterisation was done on LE and LTE modes with a series ofTandPvalues applied and phase transitions were examined to explain the performance variations. A satisfactory dimensional height:width:depth ratio was suggested as 3:1:1 to define a LE mode bar for the application of pressure [40,41]. Following that work, with the development of PIN-PMN-PT, characterisation was done under conditions of elevatedT,PandEwith special attention focused on the stress-induced ferroelectric rhombohedral (FR) to ferroelectric orthorhombic (FO) phase transition [28]. The relevant value,σ= 20 MPa, is consistent with the measurements in our study. Another study was reported more recently, including the newly developed Mn:PIN-PMN-PT, with uniaxial pressure and different electric fields, and reductions in the piezoelectric constant,d32, were demonstrated in both PIN-PMN-PT and Mn:PIN-PMN-PT [34]. The results reported here add to the evidence of such performance reductions and reinforce the need for functional characterisation of new piezocrystal materials to allow device designers to estimate the effects of their behaviour on practical performance.
6. Conclusions and Further Work
conditions. Furthermore, it allows comparison of different measurement methods, such as electrical impedance spectroscopy and laser Doppler vibrometry.
Using this system, it has been shown that Generation I, PMN-PT, is relatively sensitive to temperature, though with marginally the highest peak performance under ambient conditions. Given the low coercive field values reported in the literature, this suggests it is most suitable for applications demanding low average power levels and with low excitation fields to avoid the need for DC bias. This matches practical experience, with PMN-PT now as the material of choice for biomedical imaging. Generation II, PIN-PMN-PT, and Generation III, Mn:PIN-PMN-PT, materials have been developed specifically for applications with greater demands in terms of temperature and pressure, such as are typically found in power ultrasound, including SONAR and the oil and gas industry. Here, we have confirmed that samples of both generations have higher phase transition and Curie temperatures than Generation I PMN-PT. However, pressure in the range to 60 MPa appears to have a highly deleterious effect on parameters such as TE mode coupling coefficient,kt, and Figure of Merit, FOM =kt2e33. In addition, our specific measurements suggest relatively little or no advantage from Mn-doping in terms of immunity to environmental temperature and pressure. However, we have not considered coercive field,Ec, or mechanical quality factor,Qm, in detail, and both of these parameters have been reported to be significantly higher and useful for performance assessment in active transduction.
In considering work to further elucidate the behaviour of piezocrystals for practical configurations, we noted that the temperature investigation presented inSection 4.1ranged upwards from 20˝C.
However, it may be useful to determine the behaviour at lower temperatures for applications such as underwater SONAR. Although commercial temperature-controlled cryostats can provide very wide temperature ranges and environmental chambers are available, their configurations are generally unsuitable for simultaneous application of pressure in the range up to 60 MPa, representing full ocean depth. Initial trials of low temperature characterisation were carried out in our lab based on the system described in this paper, cooling the load applicator bars in a´80˝C freezer and then assembling them
with further cooling packs to allow characterisation to start at 0˝C. Further investigation of the use of
LN2is under consideration to make this arrangement less cumbrous.
Another issue that has been considered in a preliminary way is the effect of pressure cycling and fatigue. Measurements were performed on PIN-PMN-PT and Mn:PIN-PMN-PT; comparison with a hard piezoceramic is also of interest. For both piezocrystals, property variations are particularly evident for 0ďPď25 MPa; after only three pressure cycles,ktwas found to have suffered a permanent reduction in both materials while the properties of the hard ceramic were much more stable under loading and there was no long term change upon completion of a small number of pressure cycles. This clearly merits further consideration.
Acknowledgments: Aspects of this work have been supported by UK EPSRC projects EP/K020250 and EP/K020013. Zhen Qiu and Xiaochun Liao were supported by the Scottish Universities Physics Alliance. Tingyi Jiang was supported by the China Scholarship Council. Christine E.M. Démoré is supported by a Royal Society of Edinburgh Caledonian Research Fund Biomedical Personal Research Fellowship. The authors are also grateful for the assistance of Mr. Aleksandrs Bolhovitins and Mr. Romans Poltarjonoks in experimental equipment development and validation, and for continuing financial support from Thales Underwater Systems (UK).
Author Contributions:Xiaochun Liao, Zhen Qiu and Tingyi Jiang carried out experimental work and contributed to discussion, writing and reviewing of the text. Muhammad R. Sadiq planned and supervised development of the experimental equipment, carried out experimental work and contributed to reviewing of the text. Zhihong Huang provided resources and contributed to discussion and reviewing of the text. Christine E.M. Demore contributed to experimental protocol development, discussion and reviewing of the text. Sandy Cochran provided resources and contributed to discussion, writing and reviewing of the text. The contributions of Zhen Qiu and Sandy Cochran were made whilst they were employed by the Institute for Medical Science and Technology, University of Dundee.
Conflicts of Interest:The authors declare no conflict of interest.
References
1. Zhang, S.; Li, F.; Jiang, X.; Kim, J.; Luo, J.; Geng, X. Advantages and challenges of relaxo-PbTiO3ferroelectric crystals for electroacoustic transducers—A review.Prog. Mater. Sci.2015,68, 1–66. [CrossRef] [PubMed] 2. Zhou, Q.; Lam, K.H.; Zheng, H.; Qiu, W.; Shung, K.K. Piezoelectric single crystal ultrasonic transducers for
biomedical applications.Prog. Mater. Sci.2014,66, 87–111. [CrossRef] [PubMed]
3. Qiu, Y.; Wang, H.; Demore, C.; Hughes, D.; Glynne-Jones, P.; Gebhardt, S.; Bolhovitins, A.; Poltarjonoks, R.; Weijer, K.; Schönecker, A.;et al. Acoustic devices for particle and cell manipulation and sensing.Sensors2014,
14, 14806–14838. [CrossRef] [PubMed]
4. Jiang, X.; Kim, J.; Kim, K. Relaxor-PT single crystal piezoelectric sensors.Crystals2014,4, 351. [CrossRef] 5. Qiu, Z.; Habeshaw, R.; Fortinec, J.; Huang, Z.; Demore, C.; Cochran, S. New piezocrystal material in the
development of a 96-element array transducer for Mr-guided focused ultrasound surgery. In Proceedings of the 2012 International Society for Therapeutic Ultrasound Symposium, Heidelberg Germany, 10–13 June 2012. 6. Gallego-Juárez, J.A.; Graff, K.F.Power Ultrasonics: Applications of High Intensity Ultrasound; Woodhead
Publishing: Cambridge, UK, 2015.
7. Stansfield, D.Underwater Electroacoustic Transducers: A Handbook for Users and Designers; Bath University Press: Bath, UK, 1991.
8. Zhang, S.; Li, F. High performance ferroelectric relaxor-PbTiO3single crystals: Status and perspective.
J. Appl. Phys.2012,111. [CrossRef]
9. Sun, E.; Cao, W. Relaxor-based ferroelectric single crystals: Growth, domain engineering, characterization and applications.Prog. Mater. Sci.2014,65, 124–210. [CrossRef] [PubMed]
10. Mitsuyoshi, M.; Yoshihito, T.; Yosuke, I. Development of large-diameter single-crystal PMN-PT with high energy conversion efficiency.JFE Tech. Rep.2005,6, 46–53.
11. Berlincourt, D.A.; Curran, D.R.; Jaffe, H. 3-piezoelectric and piezomagnetic materials and their function in transducers. InPhysical Acoustics; Mason, W.P., Ed.; Academic Press: Waltham, MA, USA, 1964; pp. 169–270. 12. 176-1987-IEEE Standard on Piezoelectricity. Available online: http://ieeexplore.ieee.org/stamp/stamp.jsp?
arnumber=26560 (accessed on 30 November 2015).
13. Li, S.; Zheng, L.; Jiang, W.; Sahul, R.; Gopalan, V.; Cao, W. Characterization of full set material constants of piezoelectric materials based on ultrasonic method and inverse impedance spectroscopy using only one sample.J. Appl. Phys.2013,114. [CrossRef] [PubMed]
14. Tang, L.; Cao, W. Temperature dependence of self-consistent full matrix material constants of lead zirconate titanate ceramics.Appl. Phys. Lett.2015,106. [CrossRef] [PubMed]
15. Qiu, Z.; Sadiq, M.R.; Demore, C.; Parker, M.F.; Marin, P.; Mayne, K.; Cochran, S. Characterization of piezocrystals for practical configurations with temperature- and pressure-dependent electrical impedance spectroscopy.IEEE Trans. Ultrason. Ferroelectr. Freq. Control2011,58, 1793–1803. [PubMed]
16. Lee, H.J.; Ural, S.O.; Chen, L.; Uchino, K.; Zhang, S. High power characteristics of lead-free piezoelectric ceramics.J. Am. Ceram. Soc.2012,95, 3383–3386. [CrossRef]
18. Zhang, S.; Li, F.; Luo, J.; Xia, R.; Hackenberger, W.; Shrout, T.R. Field stability of piezoelectric shear properties in PIN-PMN-PT crystals under large drive field. IEEE Trans. Ultrason. Ferroelectr. Freq. Control2011,58, 274–280. [CrossRef] [PubMed]
19. Chen, R.; Wu, J.; Lam, K.H.; Yao, L.; Zhou, Q.; Tian, J.; Han, P.; Shung, K.K. Thermal-independent properties of PIN-PMN-PT single-crystal linear-array ultrasonic transducers.IEEE Trans. Ultrason. Ferroelectr. Freq. Control 2012,59, 2777–2784. [PubMed]
20. Zhang, S.; Li, F.; Luo, J.; Sahul, R.; Shrout, T.R. Relaxor-PbTiO3single crystals for various applications.
IEEE Trans. Ultrason. Ferroelectr. Freq. Control2013,60, 1572–1580. [CrossRef] [PubMed]
21. Standard Draft for Relaxor-Based Single Crystals for Transducer and Actuator Applications. Available online: http://www.ieee-uffc.org/main/standards/CrystalStandard_V8_for_distribution.pdf (accessed on 30 November 2015).
22. Liu, X.; Zhang, S.; Luo, J.; Shrout, T.R.; Cao, W. A complete set of material properties of single domain 0.26Pb(In(1/2)Nb(1/2))O3–0.46Pb(Mg(1/3)Nb(2/3))O3–0.28PbTiO3single crystals.Appl. Phys. Lett.2010,96. [CrossRef] [PubMed]
23. Luo, J.; Hackenberger, W.; Zhang, S.; Shrout, T.R. Elastic, piezoelectric and dielectric properties of PIN-PMN-PT crystals grown by bridgman method. In Proceedings of the 2008 IEEE International Ultrasonics Symposium (IUS), Beijing, China, 2–5 November 2008; pp. 261–264.
24. Sun, E.; Zhang, S.; Luo, J.; Shrout, T.R.; Cao, W. Elastic, dielectric, and piezoelectric constants of Pb(In1/2Nb1/2)O3–Pb(Mg1/3Nb2/3)O3–PbTiO3single crystal poled along [011]c.Appl. Phys. Lett.2010,97. [CrossRef] [PubMed]
25. Zheng, L.; Sahul, R.; Zhang, S.; Jiang, W.; Li, S.; Cao, W. Orientation dependence of piezoelectric properties and mechanical quality factors of 0.27Pb(In1/2Nb1/2)O3–0.46Pb(Mg1/3Nb2/3)O3–0.27PbTiO3:Mn single crystals.J. Appl. Phys.2013,114. [CrossRef]
26. Zhang, S.; Li, F.; Jiang, W.; Luo, J.; Meyer, R.J.; Cao, W.; Shrout, T.R. Face shear piezoelectric properties of relaxor-PbTiO(3) single crystals.Appl. Phys. Lett.2011,98. [CrossRef] [PubMed]
27. Huo, X.; Zhang, S.; Liu, G.; Zhang, R.; Luo, J.; Sahul, R.; Cao, W.; Shrout, T.R. Elastic, dielectric and piezoelectric characterization of single domain PIN-PMN-PT: Mn crystals.J. Appl. Phys.2012,112. [CrossRef] [PubMed]
28. Finkel, P.; Robinson, H.; Stace, J.; Amin, A. Study of phase transitions in ternary lead indium niobate-lead magnesium niobate-lead titanate relaxor ferroelectric morphotropic single crystals.Appl. Phys. Lett.2010,97. [CrossRef]
29. Wooldridge, J.; Stewart, M.; Vecchini, C.; Cain, M.G.; Gutmann, M.; Reece, M. Temperature and frequency dependence of electric field-induced phase transitions in PMN–0.32PT.J. Am. Ceram. Soc.2014,97, 2111–2115. [CrossRef]
30. Yuan, Z.; Seyit, O.U.; Kenji, U. Loss factor characterization methodology for piezoelectric ceramics.IOP Conf. Ser. Mater. Sci. Eng.2011,18. [CrossRef]
31. Uchino, K.; Hirose, S. Loss mechanisms in piezoelectrics: How to measure different losses separately.
IEEE Trans. Ultrason. Ferroelectr. Freq. Control2001,48, 307–321. [CrossRef] [PubMed]
32. Snook, K.A.; Rehrig, P.W.; Hackenberger, W.S.; Jiang, X.; Meyer, J.R.J.; Markley, D. Advanced piezoelectric single crystal based transducers for naval sonar applications. In Proceedings of the 2005 IEEE Ultrasonics Symposium, Rotterdam, The Netherlands, 18–21 September 2005; pp. 263–271.
33. Meyer, R.J.; Montgomery, T.C.; Hughes, W.J. Tonpilz transducers designed using single crystal piezoelectrics. In Proceedings of the OCEANS '02 MTS/IEEE, Biloxi, MS, USA, 29–31 October 2002; Volume 4, pp. 2328–2333. 34. Zhang, S.; Taylor, S.; Li, F.; Luo, J.; Meyer, R.J. Piezoelectric property of relaxor-PbTiO3crystals under uniaxial
transverse stress.Appl. Phys. Lett.2013,102. [CrossRef]
35. Stewart, M.; Cain, M. Direct piezoelectric measurement: The berlincourt method. InCharacterisation of Ferroelectric Bulk Materials and Thin Films; Cain, M.G., Ed.; Springer: Dordrecht, The Netherlands, 2014; Volume 2, pp. 37–64.
36. Jian, T.; Pengdi, H.; Payne, D.A. Measurements along the growth direction of PMN-PT crystals: Dielectric, piezoelectric, and elastic properties.IEEE Trans. Ultrason. Ferroelectr. Freq. Control2007,54, 1895–1902. 37. Sherrit, S.; Mukherjee, B.K. Characterization of piezoelectric materials for transducers. Available online:
38. McSkimin, H.J. Notes and references for the measurement of elastic moduli by means of ultrasonic waves.
J. Acoust. Soc. Am.1961,33, 606–615. [CrossRef]
39. Zhu, S.; Jiang, B.; Cao, W. Characterization of piezoelectric materials using ultrasonic and resonant techniques.
Med. Imaging Ultrason. Transducer Eng.1998,3341, 154–162.
40. McLaughlin, E.A.; Liu, T.; Lynch, C.S. Relaxor ferroelectric PMN-32%PT crystals under stress and electric field loading: I-32 mode measurements.Acta Mater.2004,52, 3849–3857. [CrossRef]
41. McLaughlin, E.A.; Liu, T.; Lynch, C.S. Relaxor ferroelectric PMN-32%PT crystals under stress, electric field and temperature loading: II-33-mode measurements.Acta Mater.2005,53, 4001–4008. [CrossRef]
42. Tian, J.; Han, P. Growth and characterization on PMN-PT-based single crystals.Crystals2014,4, 331–341. [CrossRef]
43. Zhang, S.; Liu, G.; Jiang, W.; Luo, J.; Cao, W.; Shrout, T.R. Characterization of single domain Pb(In0.5Nb0.5)O3-Pb(Mg1/3Nb2/3)O3-PbTiO3 crystals with monoclinic phase. J. Appl. Phys. 2011,110. [CrossRef]
44. Gallagher, J.A.; Lynch, C.S. Combining experiments and modeling to characterize field driven phase transformations in relaxor ferroelectric single crystals.Acta Mater.2015,89, 41–49. [CrossRef]