City, University of London Institutional Repository
Citation
:
Gheri, C. (2008). The role of salience on crowding and visual search in the context of synaesthesia. (Unpublished Doctoral thesis, City University London)This is the accepted version of the paper.
This version of the publication may differ from the final published
version.
Permanent repository link:
http://openaccess.city.ac.uk/11924/Link to published version
:
Copyright and reuse:
City Research Online aims to make research
outputs of City, University of London available to a wider audience.
Copyright and Moral Rights remain with the author(s) and/or copyright
holders. URLs from City Research Online may be freely distributed and
linked to.
THE ROLE OF SALIENCE ON CROWDING AND VISUAL
SEARCH IN THE CONTEXT OF SYNAESTHESIA
Carolina Gheri
Doctor of Philosophy
City University
Henry Wellcome Laboratories for Vision Sciences
Department of Optometry and Visual Science
Contents
List of figures
7
Appendix - List of figures
10
Abstract
12
Acknowledgements
13
Declaration
14
CHAPTER 1
15
INTRODUCTION
15
1.1
Overview
151.1.1 Salience 16
1.1.2 Visual Search 16
1.1.3 Crowding 17
1.1.4 Synaesthesia 18
1.2
Thesis Synopsis
20CHAPTER 2
21
REVIEW OF CROWDING
21
2.1
General description
222.2
What is the effect of flankers?
232.2.1 Letter Identification 23
2.2.1.1 Cortical Magnification 23
2.2.1.2 The effects of flanks on threshold size and contrast threshold for
letter identification 24
2.2.1.3 Reading and Crowding 26
2.2.2 Orientation Acuity 27
2.2.2.1 Effects of flanks on orientation acuity 28
2.2.2.2 The effects of flanks on orientation biases 28
2.2.2.3 The effects of flanks on threshold contrast for orientation classification 29 2.2.2.4 Other known effects of flanks on orientation classification 30
2.2.3 Contrast Detection 32
2.2.3.2 The effects of surrounds on contrast discrimination 33
2.2.3.3 Other effects of flanks on contrast 34
2.2.4 Crowding and masking 34
2.3
Possible explanations for crowding
352.3.1 Spatial resolution hypothesis 35
2.3.2 Lateral Inhibition (Masking) hypothesis 36
2.3.3 Spatial averaging hypothesis 37
2.3.4 Attentional hypothesis 38
2.3.5 Uncertainty hypothesis 39
2.4
Conclusion
39CHAPTER 3
41
REVIEW OF VISUAL SEARCH
41
3.1
General description
423.1.1 The classic paradigm 42
3.1.1.2 FIT theory : Feature search and conjunction search 43
3.1.1.3 Limits of FIT theory 44
3.1.1.4 Beyond the dichotomy 45
3.1.1.5 The Guided Search Model 45
3.1.2 Signal Detection Theory 46
3.1.2.1 Palmer’s Max Rule 46
3.1.2.2 Averaging 47
3.1.2.3 Localisation 47
3.1.2.4 Speed-Accuracy-Trade-Off (SAT) 48
3.1.2.5 Salience maps in V1 48
3.1.2.6 Conclusion 48
CHAPTER 4
50
THE RELATIONSHIP BETWEEN SEARCH EFFICIENCY AND
CROWDING
50
4.1
Introduction
514.2
Methods
524.3
Results
544.3.1 Experiment 1: Motion 54
4.3.2 Experiment 2: Colour 55
4.3.3 Experiment 3: Temporal Frequency 57
4.5
Conclusion
61CHAPTER 5
62
VISUAL SEARCH AND SYNAESTHESIA
62
5.1
Introduction
635.2
Definition of the Condition
635.3
Review of the evidence
665.3.1 The Stroop Effect 67
5.3.2 The Incongruent Background Effect 68
5.3.3 Visual Search 70
5.3.4 Visual Grouping 71
5.3.5 Apparent Motion 72
5.3.6 Crowding 73
5.4
Conclusions from the evidence
745.5
Methods
745.5.1 Measuring and verifying the subjective colours of synaesthetes 74
5.5.2 Experiment 1 76
5.5.3 Experiment 2 77
5.6
Results
795.6.1 Experiment 1 79
5.6.2 Experiment 2 80
5.7
Discussion
82CHAPTER 6
84
CONCLUSIONS
84
6.1
Summary of Arguments and Findings
84APPENDIX
87
NON-LINEAR INTEGRATION OF CROWDED ORIENTATION
SIGNALS
87
A.2
General Methods
90A.2.1 Stimuli 90
A.2.2 Observers and procedure 91
A.3
Results
93A.3.1 Thresholds vs Number of Targets 93
A.3.2 Matching and estimation of target tilt 95
A.3.2.1 Measuring the target alone 95
A.3.2.2 Measuring the crowded condition 97
A.3.3 Locating individual crowded stimuli 99
A.4
Discussion and Conclusions
101List of figures
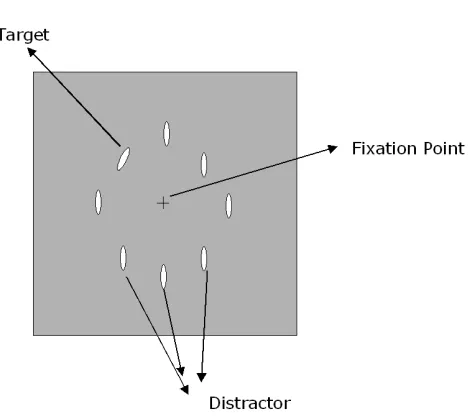
Fig. 3-1: Schematic representation of a visual search task and of its main
components. In this case, the target differs in orientation 42
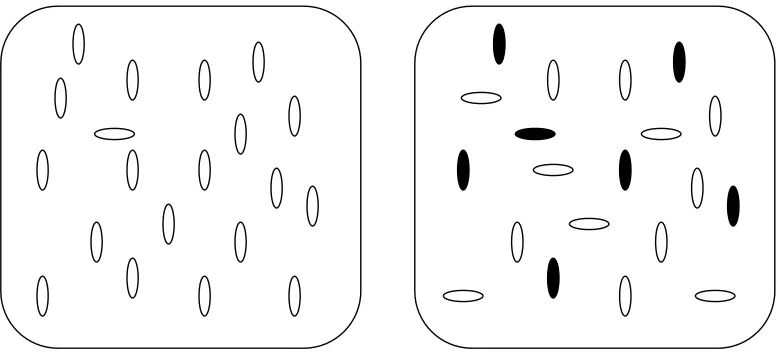
Fig. 3-2: Example of search displays in which the target is defined by a single feature (left panel), in this case horizontal orientation, or by a conjunction of features in a unique combination (right panel), in this case black polarity and
horizontal orientation. 43
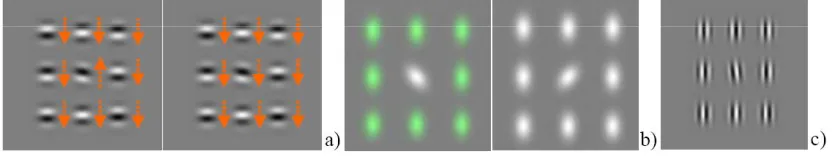
Fig. 4-1: Sample stimuli used to measure acuity in Experiments 1 (a), 2 (b) and 3 (c). Observers had to identify the direction of the central target’s tilt, viewed at 6.5 degrees of eccentricity. In some conditions, the surrounding, vertical distractors were absent. When present, the distractors could have the same or different colour, direction of drift or temporal frequency as the target. When search efficiency was measured, all elements were vertical. Observers decided whether any one of them had a unique colour, direction of drift or temporal frequency. The orange arrows in fig 4-1(a) indicate the direction of
motion of patches and did not appear in the experiment. 52
Fig. 4-2: Reaction times in searches for a unique direction of drift. Blue and pink symbols reflect target-present and target-absent conditions, respectively. Each data point summarises a minimum of 200 trials. Error bars contain the standard error. There was no significant increase in reaction time with set size
for none of the four observers. 54
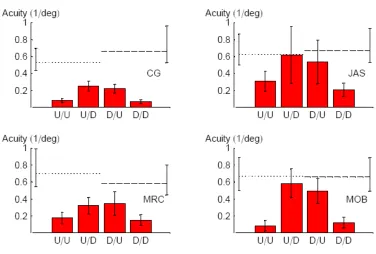
Fig. 4-3: Orientation acuities for CW/ACW judgments with respect to vertical for CG, JAS, MRS and MOB. Dotted and dashed lines reflect acuities for upward and downward drifting targets, respectively, without distractors. Different columns reflect different conditions, e.g. “U/D” is the condition in which the target drifted up and the distractors drifted down. Each column summarises a minimum of 120 trials. Error bars contain 95% confidence intervals. Acuity was worst when target and distractors shared the same direction of drift. 55
point summarises a minimum of 220 trials. Error bars contain the standard error. Reaction time increased significantly with set size in one condition only
(CG, target present; panel a). 56
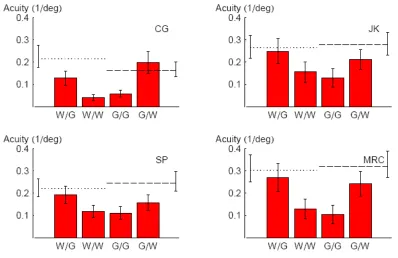
Fig. 4-5: Orientation acuities for CW/ACW judgements with respect to the vertical for four observers. Dotted and dashed lines reflect acuities for white and green targets, respectively, without distractors. Different columns reflect different conditions, e.g. “W/G” indicates white distractors and green target. Each column summarises a minimum of 360 trials. Error bars contain 95% confidence intervals. Acuity was worst when target and distractors shared the
same colour. 57
Fig. 4-6: Log threshold elevations for four observers. A value of 1 indicates that distractors produce, on average, a 10-fold drop in orientation acuity. Different columns reflect different ratios of target frequency to distractor frequency.
Error bars contain 95% confidence intervals. 58
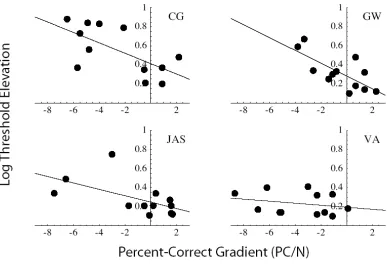
Fig. 4-7: The relationship between distractor-induced threshold elevation (i.e. crowding) and salience, for four observers. In each panel, each point represents one combination of target and distractor temporal frequencies. Conditions in which target and distractor frequencies were equal have be excluded from this figure. Log threshold elevation (i.e. the ratio between acuities for targets with and without distractors) has been regressed against the effects of set size (N) on reaction time percent correct (PC). Regression lines are shown. There was no significant relationship between threshold elevation and reaction-time gradient for any observer (not shown), but threshold elevation did increase significantly with the percent-correct gradient
for observers CG ,GW and JAS. 60
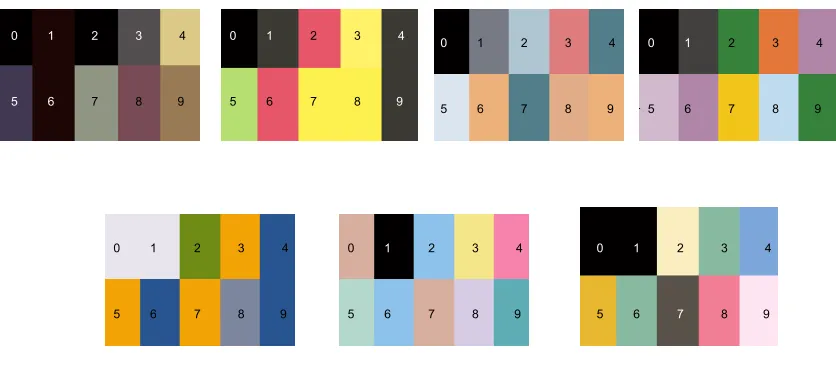
Fig. 5-1: Each subject matched their perceived colour of the digits 0-9 to a painted swatch and the latter were converted to RGB values for the experiment. 75
0.2°; total stimulus size 4.5°´ 4.8°). A third condition was programmed were lines were black. The observer in this case had to indicate the line with the
unique tilt. 77
Fig. 5-3: Example of the stimulus for experiment 2. In this test all the numbers of
the matrix were black (0.8°´ 0.5°; total stimulus size 4.5°´ 4.8°; spacing
between numbers 1°). The task was to indicate the location of the unique number. Two conditions were programmed depending on which colour subjects would associate to each number: the unique one, where the target was the only item with a certain colour and the no-unique condition where the
perceived target colour was repeated on different numbers. 78
Fig. 5-4: Example of the screen for experiment 2 as it may look to a specific synaesthete in the two different conditions: Unique colour condition a) and No
Unique colour condition b). 78
Fig. 5-5: Results for Experiment 1: Bars represent the mean of mean reaction time for all observers, including control and synaesthetes. Condition 1: Look for the line with unique tilt among coloured lines. Condition 2: Look for the line with unique colour among coloured lines. Condition 3: Look for the line with unique tilt among black lines. The two groups show the same effect: looking for the unique coloured line was the easiest task. Looking for a unique tilt was faster when surrounding lines were all black compare to when they were differently
coloured. 80
Fig. 5-6: Results for Experiment 2. The graphs show the mean Reaction Time for each subject in the two conditions. The two lines represents the means of the two group: the black dashed one for synaesthetes, the dotted one for controls. There was no significant difference between synaesthetes and control. 81
Fig. 5-7: T-test values for Experiment 2: Individual t-tests showed a significant difference between conditions in 2 of the 7 synaesthetes, but this was also
Appendix - List of figures
Fig. A-1: Experimental sequence and stimuli. The stimuli matched exactly the parameters of parkes et al. (2001) but were shown according to a vertical, rather than horizontal reference, after the stimulus display, a response page was shown requiring one of two alternative tasks. In the magnitude matching task, observers were presented with 12 response probes whose tilt corresponded to the stimulus set from which the target tilt was sampled. In the magnitude estimation task the response page consisted of a probe resembling the target (but 2 times larger) that could be rotated by lateral motion of the mouse. Immediately after the response a blank page of 400 ms was displayed and the following trial started automatically. No feedback of any kind was given. One of the observers was tested in the target alone condition
with an outlining circle to reduce intrinsic uncertainty. 92
Fig. A-2: Threshold estimation from the magnitude matching procedure. The graph shows orientation thresholds as a function of the number of targets, in log-log axes. The symbols represent the measures for the two observers, while the blue and purple lines are the predictions of the averaging and of the signedmax model, respectively. Orientation sensitivity (reciprocal of threshold) increases with the number of patches having the same tilt as the target . The rise of performance on log-log axes is close to the predictions of both models for all conditions but the one with only the central target, that is well predicted by the averaging model while the signed-max model predicts a better performance than the data. These data are a very good replication of those by parkes et al. (2001), suggesting that the magnitude matching task does not
alter the decision strategy in any way. 94
Fig. A-3: Response distributions for the target alone condition. Each panel plots the proportions of responses as a function of the reported tilt for three observers (gb was tested in two conditions, see text). Grey squares, to the left of 0, represent errors, while black squares represented correctly identified tilt directions. As predicted by both models two out of three observers show unimodal distribution well approximated by gaussian functions. Observer gb does not follow this pattern in the basic condition but does it when the target
Fig. A-4: Response distributions of the crowded condition. Each panel plots the proportions of responses as a function of the reported tilt for three observers (gb was tested also with outlined patches. Symbols are like those of fig. A-3: grey squares, to the left of 0, represent errors, while black squares represented correctly identified tilt directions. The solid blue line represents simulation for the averaging model, while the dashed red line represent simulation for the signed-max model. All observers exhibit a low rate of responses for small tilts and an increase for larger tilts implying bimodality, but the tails of the empirical distributions are generally larger than the predictions of the signed-max model possibly implying that the flanker introduced
additional sources of noise. 98
Fig. A-5: Results for the location task. The top panel plots percent of correct localizations as a function of different target tilts leading to different identification performances (bt=below threshold, nt=near threshold, at=above thresholds). Localization performance, represented by the green circles, improves significantly with target tilt, against the averaging prediction (blue solid line) but less rapidly than the predictions of an uncertainty model (purple dashed line) that locates the target based on the strongest output. The bottom panel shows the proportion of responses for each location when the target tilt was correctly identified. Note that the axis goes to negative values, corresponding to the central grey circle, an artefact we have introduced to increase the visibility. Polar angle reflects the selected position, relative to the tilted flanker position, that in the plot is normalized to its north location. Flankers are numbered in a clockwise, progressive order (f1 to f7). The green circles show the mean of four observers and its standard error (smaller than the symbols). The blue solid line shows the guessing rate, coincident with the predictions of the averaging model, while the purple dashed line the prediction for the signed-max model. The position of the target was reported significantly more often (p<0.01) than the other locations for correct identifications and the locations adjacent to the target were reported more often than those farther
Abstract
Acknowledgements
I would like to thank all the people who, during the last several years provided me the support and encouragement I needed.
Firstly I must thank Michael Morgan for having welcomed me inside his workgroup and for his precious supervision. His experience and love for the science were worth more to me than thousands of papers.
Josh Solomon for his gentle support and for the constant help he offered me. Stefano Baldassi for giving me the opportunity of working in his lab in Florence and being able to collaborating with him.
Furthermore I have to really thank everyone I met at City, especially, Adrian, Brice, Valentina, Cristiano, Christophe, Franziska, Grace, Steve, Penny and Lucy. They have been with me during all this long experience and they shared with me both the difficulties and the beautiful moments I spent in London.
I would like to especially thank Marisa for her extraordinary friendship and for being there whenever I need her.
Declaration
Chapter 1
Introduction
1.1
Overview
In this thesis I will present and discuss my studies on visual perception, more specifically on the role of salience on crowding and visual search in the context of Synaesthesia. I will further discuss some modelling of crowding starting from the resulting evidence.
In this chapter I will introduce the main topics of the Thesis. It will be helpful to the reader to explain the actual historical progression of the topics studied, which differs from the order in which they will be described in the Chapters. The original intention of the work was to examine the claim that the subjective colours reported by Synaesthetes can aid them in early visual processing. I intended to use the techniques of visual search and of ‘crowding’ to examine this issue, and to devise experiments that would determine the stage of processing at which synaesthetic colours could influence performance measures. Unfortunately, a lengthy investigation of visual search in a sample of synaesthetes previously characterised in an fMRI study (2002), failed to confirm previous claims that synaesthetic colours influence visual search. It was therefore decided not to proceed with the intended study of ‘crowding’ in synaesthesia. Instead, it was decided to look at the role of ‘salience’ in general in normal subjects. I studied the definition and role of salience in visual search and crowding, and these are the investigations reported here. The experiment on synaesthesia has been relegated to the final Chapter. In addition, to studying the role of salience in visual search and crowding it was necessary to examine current theories of the set-size effect in search and crowding. This led to an experimental and theoretical investigation of the signal detection theory of the set size effect, which is reported in Chapter 4.
collaboration with Stefano Baldassi in Firenze, and is in press in Vision Research.
1.1.1 Salience
In any moment of our life the brain processes and elaborates a continuous flow of information that arrives through our senses. To be able to do that a filter is used so that only a part of the information flow is really taken into account.
The visual stream, for example, can be filtered in many different ways. Sometimes we can decide a priori which is the most important information we have to pay attention to. If you are asked to check the text on the green label of a bottle on a shelf you will concentrate on the writing and ignore most of the other information about the product, for example you will not notice a damaged cap. This type of filtering is called a top-down process in which the filter we apply to the information stream depends on the knowledge of the object/target that has to be found or analysed.
At other times objects just attract our attention because they are particularly salient. Saliency can be defined as how much an object stands out from the background. Going back to the example above, you cannot avoid noticing a bottle with a red label while you are checking all the green labels. This is called a bottom-up process and it depends on the saliency of the object. In psychophysics salience is usually studied in the context of search experiments (see below).
1.1.2 Visual Search
Visual Search is a classic psychophysical paradigm in which the observer is asked to detect, and possibly to locate an item, the target, that is different from all the others present in the visual scene, the distractors. The number of distractors can be varied. The sum of all the items is the set size. Usually reaction times are measured. For a salient target the response time is faster than to a less salient target, by definition. In some cases, reaction times do not vary when more distractors are added to the visual display. This is the pop-out effect (Treisman, 1985, Wolfe, 1998).
The target can differ from the distractor by a unique characteristic or feature: for example the observer has to detect a red line amongst green lines; this is usually called a simple feature search. It has been shown that in this case Reaction Times (RT) do not vary by adding more items to the display.
In other conditions, the target can have more than a characteristic that make it different from the distractors: for example the observer has to look for a horizontal green line amongst, vertical green lines and horizontal red ones. In this case the observer has to join two different features, colour and orientation, to detect the target. In this condition, called conjunction search, RTs are usually very sensitive to the number of distractors so that they are slower when more elements are added to the display: this is called the set size effect.
These findings and definitions represent the basis for one of the most important theories on the elaboration of the visual information: the Feature Integration Theory (FIT) (Treisman and Gelade, 1980). In this model the information can be processed either in a parallel way, as in the case of feature search, or in a serial way as in a conjunction task.
This FIT model has a number of known limitations, for example the asymmetry phenomenon. Given a target A, it can be easier (faster RT) to look for A amongst B’s than for B amongst A’s (Treisman and Gormican, 1988, Wolfe, 1998). This simple example gives evidence that measuring reaction time is not enough to define the salience of an object by itself (see Chapter 4).
Many computational models have been proposed trying to overcome the limitations of FIT theory. Several studies has been conducted to explain the mechanism of visual elaboration and giving salience a key role, but what really seems to be lacking is an objective measure of salience. The problem is that salience certainly effects the visibility and the detection of a target, but such a property is strongly related to the context in which the target is embedded and on the feature to which it is applied (Nothdurft, 2000a, Nothdurft, 2000b, Nothdurft, 2002).
1.1.3 Crowding
presented in the parofovea or in the periphery of the visual field. The observer has to keep fixation on the centre of the screen and has to identify the central target surrounded by other elements called flankers.
Crowding was first studied in the context of amblyopia (Ehlers, 1936) and in low vision patients in which central vision can be completely lost (Korte, 1923). Crowding has often been studied previously using letters as stimuli in the context of investigations of reading. Bouma (1970) suggested using simpler stimuli that could be controlled more easily, such as tilted lines. Such an approach permits a more precise investigation of the basic mechanism underlying the phenomenon of crowding. Quite a few models and ideas have been proposed, but none of them seems to completely explain all the effects that neighbouring items can have on the identification of the target. One of the initial aims of this work was to investigate whether the role of salience in crowding could help to solve some of the conceptual problems in this area.
1.1.4 Synaesthesia
Synaesthesia is a complex condition in which some people experience strong inter-modal perception. Examples include seeing colours and forms when listening to music or associating days of the week and months of the year with specific colours.
Synaesthesia has been reported historically by numerous artists who have attempted to describe their peculiar experience by painting, writing or composing music. Kandinsky has been claimed to be a synaesthete and Baudelaire and Rimbaud are well known for their poetry in which different senses are mixed together. Historically, Synaesthesia has been reported as more common in women than in men (Galton, 1880; Cytowic, 1989; Baron-Cohen, 1993).
Synaesthesia can be induced by using drugs as for example LSD (Hollister, 1968). There have been claims that Synaesthesia is just a normal period of brain development due to the interconnection between different cerebral areas that would generally disappear in older age (Maurer, 1993; Baron-Cohen et al, 1993), while others claim that Synaesthesia is a simple result of memory association created during childhood (Marks, 1975).
(1) If normal subjects try to find a ‘2’ amongst a set of ‘distracter’ digits such as 5’s their performance deteriorates as the number of distractors increases (the set-size effect). However, if the target is uniquely coloured it ‘pops out’ and performance shows little change with distracter number (Treisman and Gelade, 1980). Visual search with both real and synaesthetic colours was investigated by Palmieri, Blake, Marois, Flanery & Whetsell (2002) in a synaesthete WO, along with normal controls. WO responded more quickly than the mean of the controls, when the search item had a unique synaesthetic colour.
(2) A set of black 2’s forming a global shape such as a triangle does not, for normal subjects, stand out from a background of 5’s (Beck, 1982). However, if the 2’s are red and the 5’s are green, the global shape is seen much more easily. Ramachandran and Hubbard (2001b) investigated whether this was true for synaesthetic colours as well. They reported that two synaesthetes were significantly faster than 40 control subjects at reporting the shape formed by achromatic graphemes that had a different synaesthetic colour from the background graphemes. The experiment was later extended to six synaesthetes (Hubbard, 2005b) , five of whom showed superior performance to their control groups (n=20).
(3) Ramachandran & Hubbard (2001b, Ramachandran, 2001a) reported that synaesthetic colours could also reduce ‘crowding’. Graphemes presented in the periphery of vision are harder to identify when they are surrounded by other, flanking graphemes. Two synaesthetes were better than controls at identifying the target grapheme when it had a different synaesthetic colour. Subsequent research with six synaesthetes found the superior-to-normal effect in three of the six (Hubbard, 2005b).
1.2
Thesis Synopsis
The next Chapter (Chapter 2) will give a description of crowding. I will present a summary of different studies on the phenomenon and I will list several different effects that flankers can have on various aspects of of sensitivity and discrimination, by using different kinds of stimuli. In the last part of the chapter I will draw attention to some of the possible explanations given to describe the effect, in particular, the Averaging model, in which all signals are pooled together (Green and Swets, 1966) and the Maximum-of-outputs rule (Palmer et al., 1993) in which all signals are independently processed and compared so that the highest value is chosen. An experimental test of the two models of crowding will be described in a separate Appendix, so as not to disrupt the flow of narrative from crowding, through visual search, to synaesthesia.
Chapter 3 will give a review of Visual Search. It is very important to introduce this basic paradigm since most of the models discussed here in the context of crowding have been first tested for Visual Search tasks. Moreover this paradigm has been applied to an experimental study on Synaesthesia which will be described in Chapter 5.
Chapter 2
Review of crowding
2.1
General description
Spatial interactions are a critical feature of spatial vision that serve to sharpen perception of form and enable features to be grouped into forms. Spatial interactions may be inhibitory (reducing sensitivity) or facilitatory (enhancing sensitivity). Crowding is a form of inhibitory interaction in spatial vision that refers to the deleterious influence of adjacent flanks on visual discrimination.
Crowding has a practical significance in patients with low vision, due for example to age-related macular degeneration, one of the major causes of central vision loss. In these patients the central retina is damaged and they are forced to use the peripheral retina producing large deficits in normal everyday life tasks, such as reading. Slow reading in peripheral visual field is, in fact, mostly due to crowding among individual letters (Legge et al., 2001, Pelli, 2007); even when targets are scaled in size, the spatial extent and the intensity of the interaction are greater in peripheral than central vision (Legge et al., 2001).
Crowding has also been widely studied in normal observers. In traditional experiments the observer keeps his or her gaze on the fixation point and has to identify a target letter presented in the periphery. The target can appear either alone or surrounded by various number of letters, called flankers. In the condition when the flankers are present visual performance is worse than when the target is presented alone.
Early studies on crowding were carried out on letters and digits because these stimuli are widely used in various information displays in the real world. Crowding was discovered in the course of measuring letter acuity in patients with central field loss by Korte (1923) and in amblyopia by Ehlers (1936). Stuart and Burian (1962) coined the term “crowding” for the impairment of identification of a peripheral letter by neighbouring letters. A variety of other names have been used in the literature to describe the crowding effect, including: “contour interaction” (Flom et al., 1963), “interaction effects” (Bouma, 1970), “lateral inhibition” (Townsend et al., 1971), “lateral masking” (Wolford, 1983, Taylor, 1972, Geiger, 1986), and “masking” (Anstis, 1974).
Hauske, 1975, Levi et al., 1985, Levi and Klein, 1985), stereopsis (Butler and Westheimer, 1978) and line orientation sensitivity (Westheimer et al., 1976).
In foveal vision results showed that crowding only occurs over very small distances (Toet and Levi, 1992, Flom et al., 1963, Liu, 2000), or it does not occur at all (Strasburger et al., 1991). In peripheral vision, crowding occurs over distances several times larger than the target size. The mechanism for crowding is still not completely understood. The remainder of this Chapter reviews the theories and evidence.
2.2
What is the effect of flankers?
2.2.1 Letter Identification
2.2.1.1 Cortical Magnification
Historically, visual acuity was defined in terms of the smallest stimulus that can be identified with a specified level of accuracy. Aubert and Foerster (1857) showed that peripheral vision has a lower acuity than foveal vision, and that the decrease in visual acuity can be compensated for by increasing the stimulus size. More recently, visual acuity has also been measured in terms of contrast sensitivity, and the interaction between stimulus size and contrast is important in measuring the fall off in visual performance with retinal eccentricity.
The map of the visual field on the visual cortex is non-linear (Virsu and Rovamo, 1979, Cowey and Rolls, 1974 , Daniel and Whitteridge, 1961 , Van Essen et al., 1984); which means that changing the size of a stimulus changes the amount of cortical tissue stimulated, depending on the location of the target in the visual field. A simple scaling hypothesis suggests that, in order to have performance that is invariant with eccentricity, we have to be sure that the print size is appropriately scaled.
1999).
2.2.1.2 The effects of flanks on threshold size and contrast threshold for letter identification
Readability of character groups cannot easily be deduced from individual character recognition (Townsend et al., 1971). Specifically, as already mentioned, the recognition of a target character is more difficult in the presence of neighbouring characters. Crowding was in fact discovered measuring letter acuity in patients with central field loss by Korte (1923) and in patients with amblyopia by Ehlers (1936) and Woodrow (1938).
et al., 1991).
Crowding has often been compared to masking. Masking usually refers to the effects of spatially-overlapping masks on target identification or detection. Masking and crowding have sometimes been confused since they both impair visual
discrimination (see section 2.2.3.4). Chung et al (2001) aimed to compare the two phenomena in different experiments in order to highlight the spatial properties of crowding. They first measured contrast thresholds for identifying the middle target letters in trigrams for a range of letter spacing (from 0° to 5° eccentricity) while the flankers contrast was kept constant. Letters were digitally filtered using a set of bandpass filters. They found that crowding exhibits spatial-tuning functions like masking, but with generally broader bandwidths than those for masking. In the second experiment, they measured the contrast thresholds for identifying the middle target letters in trigrams for a range of flanking letter contrasts at 5° eccentricity. Thresholds for identifying the middle target were not affected by low contrast flankers while at high flanker contrast, the thresholds increased with contrast.
In the final experiment, they varied the contrast ratio between the flanking letters and the target letters. The aim of this experiment was to see if crowding would be highest when flankers and target had the same contrast. This prediction was based on previous studies showing that the crowding effect was stronger when flankers and target share the same properties (Andriessen and Bouma, 1976, Kooi et al., 1994, Nazir, 1992) (see section 2.2.2.4). The magnitude of crowding actually increased monotonically with contrast ratio, showing that contrast difference is not the important variable.
more on eccentricity and spacing.
Pelli et al (2004) also measured letter identification thresholds in the periphery varying the number of the flankers. Their results show that threshold elevation increased when flankers are increased from 1 to 2, but that thresholds do not vary much more if the number of flankers are increased from 2 to 4. These results are also confirmed by other studies not using letters (Wilson et al., 1997, Toet and Levi, 1992). Moreover Pelli et al (2004) varied the contrast of the flankers. They again measured contrast threshold to identify a middle letter in the trigram. They found what they called ‘mask threshold’, which is the level at which thresholds start to increase, and a ‘mask saturation’, at which contrast thresholds increase no further. The interesting finding was that these critical mask levels are not spacing dependant.
Finally they also investigated whether the shape or the complexity of the font could affect crowding, but threshold elevation in letter identification did not vary depending on the font of the letters.
2.2.1.3 Reading and Crowding
A more ecological context in which print size can have an important role in letter identification is reading. The idea that letter size limits reading is ancient. The classic reading rate curves are all plotted as a function of letter size. In general as text size increases, reading rate rises abruptly from zero to maximum rate. This classic reading-rate curve consists in fact of a cliff and a plateau, characterized by two parameters, critical print size and maximum reading rate (Legge, 1985); this basic result is well established but as yet unexplained.
sizes at each of six retinal eccentricities, from 0 (foveal) to 20 deg. Contrary to the simple scaling hypothesis, it was found that the maximum reading speed is not invariant with eccentricity, even when the print size was scaled, and it was concluded that print size is not the only factor limiting maximum reading speed in normal peripheral vision. The same authors obtained evidence that the visual span, the number of characters that can be recognised in a glance (Legge et al, 1997) reduces in size in the periphery (Legge et al., 1983, Legge et al., 2001). Such a reduction has been attributed to poorer spatial resolution caused by greater convergence of photoreceptors on to retinal ganglion cells (Virsu and Rovamo, 1979). The target was controlled in following studies to be equally detectable by either type of photoreceptor. The authors actually used a reading paradigm in which the text could only be seen by rods. Reading rates were measured with the text presented in different parts of the visual field. Observers were always faster reading the text when it was displayed in close proximity to the fovea. This actually proved that the intrinsic differences between cones and rods is unlikely to be a factor accounting for the slow reading speed in peripheral vision (Chaparro, 1993).
Pelli et al (2007) tried to give a complete explanation of visual span and of the reading rate curve by including crowding. They established a strong link between reading and crowding and showed that “visual span” is the “uncrowded span”, which is the number of characters that are not crowded. Finally, they demonstrated that only crowding determines the positions of the cliff (critical print size) and the plateau (maximum reading rate) of the reading rate curve. Their results suggested that crowding, and not acuity, determines the position of the cliff and that therefore performance of the flanked letter identification task depends on spacing, not size. Levi et al. (2007) confirmed this finding showing that doubling the normal letter spacing in the text shifts the reading rate curve, plotted as a function of size. This shows that letter spacing is important, even when size is controlled.
2.2.2 Orientation Acuity
crowding when letter identification is employed. Following an influential paper by Bouma (1970) there has been a move towards using simpler stimuli such as lines, gratings or Gabor patches.
2.2.2.1 Effects of flanks on orientation acuity
Studies of orientation identification of lines or Gabor patches have shown similar crowding effects to those using letters. (Korte, 1923, Stuart and Burian, 1962, Flom et al., 1963, Bouma, 1970). The extent of crowding varies with eccentricity, the distance from the fixation point, and with critical spacing i.e., the least distance target-flanker at which threshold elevation disappeared.
The crowding range is roughly half the target distance from fixation (Bouma, 1970, Strasburger et al., 1991, Toet and Levi, 1992). This result, that has been named Bouma’s rule, has been confirmed by other studies (Pelli et al., 2003), and it has been found to be independent of the target size (Strasburger et al., 1991, Tripathy and Cavanagh, 2002). One advantage of using gratings or Gabor patches as stimuli is that their spatial frequency content can be controlled separately from their overall size.
2.2.2.2 The effects of flanks on orientation biases
oblique flankers but in some cases their effects were significant. Oblique distractors responsible for the largest biases were also those responsible for the largest drops in sensitivity even though vertical distractors also produced sizeable losses of sensitivity. Horizontal and nearly horizontal distractors produced the smallest losses of sensitivity, but even these were significant in most cases. If the distractors were tilted in opposite directions, the biases were small but the sensitivities were similar to those measured when distractors had the same tilt.
Li et al. (2000) compared the effect of contextual stimuli on human orientation discrimination and on responses of neurons in V1 of monkeys. The stimulus was a line that was presented in various contextual conditions. Their data showed that contextual interference observed in human orientation discrimination can be related to contextual inhibition of neuronal activity in V1. Generally when human performance was impaired, for most of V1 neurons, responses elicited by the target line were suppressed by the contextual patterns. If the target was surrounded by orthogonal lines psychophysical discrimination was slightly better. Thresholds were elevated for randomly oriented lines and even more for lines parallel to the target. Correspondingly, the firing of V1 neurones to the target line were suppressed. Straight lines gave the strongest interference with human orientation discrimination and produced the strongest suppression of neuronal responses. The human psychophysical data and the single neurone recording were not always in agreement. Elevation of human orientation discrimination thresholds was highest when a mask covers only the immediate vicinity of the target line and increasing the masking area resulted in less interference. On the contrary, suppression of neuronal responses in V1 increased as the masking size became larger. The authors proposed that these results suggested a figure-ground segregation process that is not located in V1.
2.2.2.3 The effects of flanks on threshold contrast for orientation classification
asked to identify the orientation of the target. Thresholds were elevated only for narrow spacing (smaller than 1°-2°) in both kinds of task.
Other studies investigated the role of difference in contrast between target and flankers (Felisberti et al., 2005). The display consisted of a central target sounded by 4 flankers. Either the target contrast was kept constant and the flankers’ varied or the other way round. The array was flashed for 100 ms at 3.8 deg eccentricity. The tilt was sampled from 5 possible tilts; each block consisted of 100 trials, 20 for each tilt. The cue was present in some cases, and the location changed so that the target was equally presented in each position. No post-stimulus masks were used. The results showed that contrast threshold elevation was reduced by increasing the contrast of the target relative to the distractors, but targets of smaller contrast than the distractors were even harder to identify than those of the same contrast.
2.2.2.4 Other known effects of flanks on orientation classification
Wilkinson et al. (1997) reported that reducing the number of flanking gratings from 14 down to 2 did not significantly reduce their effect on the discriminability of the signal. Similarly Toet and Levi (1992) measured the effect on orientation discrimination of a ‘T’ target of one or two collinear ‘T’ flankers (composed by two lines of the same length) which were randomly oriented up or down with the effect of one flanker. They made measurements for three different eccentricities (0°, 2.5° and 10°). A threshold elevation was registered only when two flankers surrounded the target.
On the other hand, Poder (2006) demonstrated that the crowding effect was remarkably reduced by increasing the number of distractors (up to 168 elements). Similar results were observed when the target and distractors were of the same colour and when only a differently coloured circle indicated the target location. Poder suggests that the results can be explained by bottom-up ‘‘attention’’ that facilitates the processing of information from salient locations in the visual field (Poder, 2006). We shall consider this notion of bottom-up salience in a later section (see Chapter 3).
discrimination and contrast detection of the central Gabor were measured. These measurements revealed differences in the magnitude of the effect of crowding for different configurations, especially on the discrimination task. The crowding effect was stronger when random configurations were used and was reduced considerably when a smooth one was used.
In another study, Malania et al (2007) reported that interference caused by flankers in Vernier offset discrimination depends on their proximity. Both the length and the pattern of the flankers would influence this effect. Except for the equal-length condition in almost all configurations, the threshold elevation is reduced when the flankers are part of a more extended configuration.
Crowding shows a well-established spatial anisotropy, such that more peripheral flankers than the target have a greater effect than those nearer the fixation point (Shaw, 1969; (Bouma, 1970, Bouma, 1973, Chastain, 1983, Shaw, 1969). This result has been recently confirmed using Gabor patches as stimuli by Petrov and Popple (2007). In their experiment they asked the observers to identify the tilt of three horizontally aligned Gabors with 45° left or right from the vertical, shown to the left of fixation for 150 ms at 6° eccentricity. Next, a column with eight possible choices was shown to the right of fixation and the observer had to indicate the matching triplet. They found that the outmost target was much less crowded in comparison to the other two.
Another aspect that has been investigated is the target-flanker similarity. Kooi et al (1994) measured the effect of colour difference on crowding. Two out of six observers suffered crowding even when the target had a unique colour. The authors suggested that these two observers might not have experienced an enough strong perceptual difference between the target and the flankers. Following these results, Ramachandran & Hubbard (Ramachandran and Hubbard, 2001b, Ramachandran, 2001a) studied crowding in the special condition of colour-grapheme Synaesthesia. They found that two synaesthetes were better than controls at identifying the target grapheme when it had a different synaesthetic colour from the flanks. The same effect was also confirmed by (Hubbard, 2005b) in three of the six observers. These results are quite interesting because, if they can be confirmed, it would suggest that synaesthetic induced colours act as real ones. We will further discuss these results in the Chapter 5.
salience. A cue indicating the position of the target improved performance when the position was otherwise unknown and if the spatial separation between target and distractors was large, but the cue had no significant effect when separation was small. The ineffectiveness of the cue at small separations is evidence for crowding. Felisberti et al. (2005) also investigated differences in depth and showed that putting the target and distractors in different stereoscopic depth planes decreased crowding.
The relation between crowding and salience will be discussed in greater detail in a later section (see Chapter 3).
2.2.3 Contrast Detection
2.2.3.1 The effects of flanks on contrast detection
In a detection task, the target is randomly presented in one of two consecutive intervals. The flankers are displayed in both intervals, independently and randomly selected for each interval. Observers have to report in which interval the signal is present.
Polat and Sagi (1993) measured contrast detection thresholds for a foveal Gabor signal flanked by two high contrast Gabor patches (‘flankers’) as a function of their distance from the target. Their data showed a suppressive region extending to a radius of two wavelengths, in which the presence of high contrast masking signals had the effect of increasing target threshold. Beyond that, they describe a much larger facilitatory region where contrast detection threshold decreased again. They also showed that detection of a Gabor patch could be facilitated when flanked by low-contrast Gabors of similar orientation. Such a detection facilitation was maximal for flanking stimuli that were spatially proximal and oriented collinearly with the target (see also Solomon et al., 1999). Detection facilitation decreases as the target and flankers vary from collinear (Kapadia, 1995, Williams and Hess, 1998), although others have demonstrated significant target facilitation also occurs when flankers are oriented orthogonally to the target (Cass, 2005, Yu, 2002).
sensitivity to the central patch, in agreement with the results of Polat and Sagi (1993). In the periphery, however, they found no facilitation.
Their results were confirmed by Levi and Klein (2002a). They considered whether crowding in peripheral vision can be explained on the basis of contrast masking by flanks.To test this hypothesis, they measured and compared crowding in a direction of identification experiment with masking by flanks in a detection experiment. They examined the relationship between the suppressive and facilitatory interactions in peripheral contrast detection and crowding. The results show again that unlike the foveal results, peripheral crowding shows separate characteristics. Their results suggest that inhibitory spatial interactions in peripheral crowding extend over larger distances than in the fovea for targets of the same size (Levi et al., 2002a). It was found that the critical distance for crowding is approximately 0.1 times the target eccentricity. In general, the results show that observers can easily detect the features that compose the signal targets, in this case Gabor patches, even if crowding was very strong. The authors suggest that peripheral crowding happens because the target and flanks are combined or pooled at a second stage and that in peripheral vision; this pooling takes place over a larger distance. This suggestion was also made by Pelli, (2004).
2.2.3.2 The effects of surrounds on contrast discrimination
seen earlier, there are important differences between crowding and masking in other respects.
2.2.3.3 Other effects of flanks on contrast
Pelli et al. (2004) measured detection thresholds for a letter among letters as a function of flanker spacing. Contrast threshold elevation for the detection task was smaller than for the identification task and it extended over almost the same spatial range. Pelli et al. also assessed the effect of eccentricity and size on critical spacing: they measured detection thresholds for 0.75° Sloan letters for three different eccentricities (2°, 4°, and 8° in the right visual field). Results show that the critical spacing for detection is independent of eccentricity. They performed the same test for three letter sizes, 0.75, 1.5, and 3 deg, at 8 deg in the right visual field. The results showed that the critical spacing for letter detection is proportional to size. In summary, the authors showed that the critical spacing for letter detection was proportional to size while letter identification is independent.
These results confirmed previous data by other authors using different stimuli. Levi et al. (2002a) reported that observers could easily detect the features that compose the targets (Gabor patches) under conditions where crowding was strong. Threshold elevation for detection was much weaker and less extensive than threshold elevation for the identification task.
2.2.4 Crowding and masking
determining masking and crowding. In masking, critical spacing is proportional to signal size and it is independent of eccentricity (Pelli et al., 2004, Shani, 2005, Polat, 1993). This effect can be either positive (reduced contrast detection threshold) or negative (increased contrast detection threshold), depending on the target–flanker distance and the stimulus configuration (Polat, 1993). In crowding, on the other hand, the critical spacing is proportional to eccentricity but independent of size and, above all, it is always negative.
2.3
Possible explanations for crowding
Although crowding has been studied psychophysically since 1923 (Korte, 1923, Stuart and Burian, 1962, Flom et al., 1963, Bouma, 1970) its physiological basis is still not well understood. Here I will present some of the main theories that have been proposed.
2.3.1 Spatial resolution hypothesis
In their classical study, Flom, Weymouth, and Kahneman (1963) estimated the extent of crowding as a function of eccentricity by having observers judge the orientation of a near acuity threshold Landolt C while varying the distance of surrounding flanks from the ‘C’. Flom et al. suggested that the distance over which spatial interaction occurs is related to the size of the receptive fields that are most sensitive to the target. Because peripheral vision is characterized by reduced visual acuity, larger receptive fields will be engaged (because small receptive fields have low sensitivity), and this scale shift will result in proportionally larger crowding distances. This scale shift hypothesis makes several predictions. First, it predicts that in peripheral vision, the spatial extent of crowding (with broadband stimuli) will scale with (be proportional to) the uncrowded acuity. For letter acuity (Flom et al., 1963) and Vernier acuity (Levi et al., 1985, Levi and Klein, 1985), the spatial extent of crowding appears to scale with the unflanked letter or Vernier acuity in amblyopia and peripheral vision, respectively. Second, the scale shift hypothesis predicts that the spatial extent of crowding will depend on the size or spatial frequency of the target.
typically measured with larger (broadband) stimuli than in the fovea, and the resulting data may indeed reflect a shift in spatial scale. Levi et al (2002a) used a spatially band-pass filtered E stimuli composed of narrow-band features and showed that peripheral crowding extends over a greater distance even when tested with the same size (and spatial frequency) stimuli as the foveal stimuli. Thus the authors argued that it is unlikely that the extended peripheral crowding reflects a simple shift in spatial scale of first stage filters toward larger (low spatial frequency) filters at an early stage of processing in V1.
2.3.2 Lateral Inhibition (Masking) hypothesis
Crowding has also been often used as synonym of the broader term ‘lateral masking’ (Townsend et al., 1971, Wolford and Chambers, 1984, Mansfield, 1998). Lateral masking refers to any effect on the detectability, discriminability or recognition of a target by non-overlapping spatially adjacent patterns. The use of the term ‘lateral masking’ to refer to crowding leads to the implication that crowding can be a form of masking in which the visibility of a target is affected by a spatially superimposed masker. Therefore, as we have seen in some sections above, the goal of many different studies has been to compare several properties of crowding with those of masking, in order to determine if they share the same effects and, presumably some common underlying mechanisms (Levi et al., 2002b, Pelli et al., 2003).
For a long time the two effects have been confused and only lately some differences have been found. Several approaches agree in concluding that crowding and masking are likely to share the same first stage filtering process, and perhaps have similar second stage feature integration (Pelli et al., 2003, Chung et al., 2001).
Surround suppression and crowding have many similarities, and surround suppression could, in principle, cause crowding by eliminating weak but important features of the target (e.g., the difference between letters G and C). The lateral inhibition model was inspired by an observation that similar letters produce stronger crowding (Estes, 1974, Estes, 1972). Using the observation that confusable (similar) letters produce stronger crowding, Estes suggested that crowding happens because similar features of nearby letters inhibit each other.
does not explain the strong inward–outward anisotropy, in which there is greater crowding of stimuli nearer to the fixation point (Chastain, 1986, Petrov, 2007). Moreover, following this theory, we could assume that the high-contrast Gabor patches could suppress one another to such a point that the perceived contrast of the Gabor patches would be dramatically reduced. In fact, no such effect was observed by (Pelli et al., 2004, Petrov, 2007) who found that identification WAS impaired, when the target was still visible.
Polat and Sagi (1994) have argued that the facilitation by remote flankers observed in foveal detection is a consequence of excitatory long-range horizontal connections between neurons with like orientations in the cortical area V1. These horizontal connections may be excitatory and inhibitory (Fitzpatrick, 2000, Gilbert, 1998), and extend up to about 1 to 2 mm in the primate area V1 (Rockland, 1983, Blasdel, 1985, Lund, 1993, Amir, 1983). The long-range inhibitory connections have approximately the length to account for peripheral crowding. On the other hand, this close correspondence may be a coincidence, because long-range connections appear to be too short to account for foveal crowding (Levi et al., 2002b). Moreover, the fixed cortical distance of long-range connections predicts interactions over a fixed retinal distance, rather than interactions that are related to target size in the fovea. In addition, it is unclear why long-range interactions in masking should be different from long-range interactions in crowding.
2.3.3 Spatial averaging hypothesis
from averaging, echoing a previous result of Morgan, Ward and Castet (1998).
The averaging hypothesis has been challenged in recent papers by Baldassi et al. (2006) who claimed that spatial uncertainty (specifically, the ‘Max’ rule of signal detection theory) gives a better account of the results. We shall examine this issue experimentally in Chapter 4.
Similar to the suggestion of averaging, Levi et al. (2002a) and Pelli et al. (2004) argued that signal processing happens in two stages in the periphery. At the first stage, individual features are detected and surround suppression occurs. At the second stage, the feature information is pooled over an area of visual field proportional to the stimulus eccentricity, which results in crowding. To support this hypothesis, Levi et al. show that observers could easily detect the targets under conditions where crowding is strong. He et al. (1996) used adaptation to grating stimuli to show that detection and crowding are happening at different processing stages.
Pelli et al., (2004) also suggested that crowding occurs when subjects have to identify a complex feature in the stimuli. To do so, they have to integrate the outcome of several basic feature detectors. This integration is suggested to be carried out within an integration field, which operates over increasingly larger areas as one moves further into the visual periphery. As a result from this integration fields’ size limitation, in crowded displays, even when centred on the target, the integration process incorporates information also from flankers’ signals. Thus, according to this explanation, the extent of crowding is determined exclusively by target–flanker separation and its ratio with eccentricity. A consideration on configural effects strongly suggests that such an explanation may at least be incomplete. If crowding was the consequence of only such hard-wired spatial mechanisms, then no differences would be expected from the different configurations of the stimulus used, but this prediction seems not to be confirmed by experimental results (Felisberti et al., 2005, Livne and Sagi, 2007).
2.3.4 Attentional hypothesis
model of crowding. According to this explanation crowding represents the limits of attentional acuity, which is quite coarse in the periphery. When items are spaced more closely than the smallest possible region of attentional selection, more than one item will be selected as a group and access to the individual identities is not possible. If the target is the only item within the selection region, then it can be identified until it is too small to be visually resolved.
Yeshurun & Carrasco showed similar results (1998, 1999, 2000) without using a crowding paradigm. They used a peripheral precueing to explore the effect of covert transient attention on performance in spatial resolution tasks in the periphery, where the effect of crowding is usually found. They found that directing attention to the target location enhances performance where the resolution is too low . The authors suggest that attending to a location is similar to reducing the size of the corresponding filters.
2.3.5 Uncertainty hypothesis
Crowding can also be the result of positional uncertainty (Huckauf, 2002, Strasburger, 2005). According to this type of explanation, spatial localization is limited and thus crowding is the result of reporting the properties of a flanker instead of the target. Unlike in the feature integration account where features are free-floating, here complete objects rather than features are assigned wrong locations. This theory is supported by results showing that in letter crowding experiments, subjects incorrectly report a flanker letter present in the display more often than a letter not present (Strasburger, 2005, Huckauf, 2002). However, this result would also be predicted by selection of features from flanking letters and their inappropriate integration into the letter-identification stage.
2.4
Conclusion
Chapter 3
Review of Visual Search
3.1
General description
3.1.1 The classic paradigm
[image:43.595.231.465.329.538.2]In the classic visual search paradigm (Treisman and Gelade, 1980, Treisman and Souther, 1985) the observer has to decide whether a pre-specified target appears among some number of distractor items. The total number of elements in the display is known as the set size. The schematic representation of these components is shown in Figure 3-1.
Fig. 3-1: Schematic representation of a visual search task and of its main components.
In this case, the target differs in orientation
In some percentage of the trials, usually 50%, the target is present. In the other trials only distractors are present. Average reaction time is usually plotted as a function of set size. The slopes of these curves are used to quantify performance. The slope for target-present trials often differs from the slope for target-absent trials.
parallel processes. When set size did affect performance, the search was attributed to attentive, limited-capacity and serial processes (Neisser, 1967, Kinchla, 1974, Shiffrin, 1977, Schneider, 1977, Sternberg, 1969).
3.1.1.2 FIT theory : Feature search and conjunction search
[image:44.595.125.514.381.560.2]The notion of a division between parallel and serial search was central to the Feature Integration Theory (FIT), first proposed by Treisman and Gelade (1980). FIT was particularly influential because it offered an explanation for the difference between feature search, where the target differs from the distractors along only one stimulus dimension like orientation (Foster and Ward, 1991b), colour (D'Zmura, 1991, Carter, 1982) or curvature (Treisman and Gormican, 1988), and conjunction search, where the target differs from some distractors along one dimension and differs from others along another dimension (Treisman and Gelade, 1980).
Fig. 3-2: Example of search displays in which the target is defined by a single feature
(left panel), in this case horizontal orientation, or by a conjunction of features in a unique combination (right panel), in this case black polarity and horizontal orientation.
analysis is a family of spatially (or retinotopically) organised maps; one for colour content, another for orientation content, etc.
In a conjunction search, no single feature map carries information about the uniqueness of the target. Different features at a single location would have to be integrated first. This, according to FIT, happens when visual spatial attention is focused on a particular region of interest. Due to the limited capacity of attentional resources, separate regions of interest would be attended in sequence, one after another.
Serial searches like this were thought to be self-terminating. The slopes for target-present searches were usually roughly half those for target-absent searches (1:2 ratio). In the former case, on average, attention would need to process only half of the items before the target would be found. In the target absent condition, attention would need to pass through all items before observers could be confident that no target was present.
All subsequent theories of visual search can be considered either reactions to, or modifications of FIT. Most are concerned with one or more of FIT’s various limitations (described below). Most importantly, these newer theories make quantitative predictions and incorporate our greatly improved understanding of neuronal activity.
3.1.1.3 Limits of FIT theory
The serial-parallel dichotomy has been questioned by many authors (Neisser, 1963, Treisman and Sato, 1990, Duncan and Humphreys, 1989). One fundamental point is that there are cases where searches for a single feature, like a unique colour (Nagy and Sanchez, 1990) or orientation (Foster and Ward, 1991b, Foster, 1991a), can produce steep set size slopes. This happens when the difference between the target and the distractor is decreased.