JOURNALOFVIROLOGY, June 1967,p.514-522 Copyright©1967 AmericanSociety forMicrobiology
Replication of Bacteriophage
Ribonucleic
Acid:
Some
Properties
of
Native
and
Denatured
Replicative Intermediate
RICHARD M. FRANKLIN
ThePublic Health ResearchInstitute oftheCityofNew York,Inic.,
New York,New York10009
Receivedforpublication 18January 1967
Purified replicative form (RF) and replicative intermediate (RI) prepared from Escherichia coli cells infected with the ribonucleic acid (RNA) bacteriophage R17 weredenatured withdimethyl sulfoxideat 37C orinaqueoussolvents of lowionic
strengthat97 C. Denaturationwasdemonstrated for RF andRIby an increase in
specific infectivity and a striking change in the hyperchromicity curves after
treat-ment. RI denaturation wasalso demonstrated bya shift in the buoyant densityin
Cs2SO4 from 1.619 to the buoyant density of single-stranded R17 RNA (1.627). Analysis of the denatured RIhyperchromicitycurvesand the equilibrium
distribu-tions of denatured RI in Cs2SO4 gradients revealed, however, a residual double-strandedcomponent. Velocitysedimentation of denatured RI was performed, and the weight distribution of S values was calculated. From the known relation
be-tween molecularweight and S values, itwas possibleto transformthe weight
dis-tribution into a number distribution of chain lengths. This distribution was com-pared with that predicted from the steady-state hypothesis for RI. Deviations fromthe predicteddistributionmaybedueto the residualdouble-stranded
compo-nent.
The replication of single-stranded viral ribo-nucleic acid (RNA) has been investigated by studying thestructure ofreplicative intermediate (RI), which is double-stranded RNA template with boundnascentviralRNA(7,8).Thus,some
of the details of the kinetic process of RNA
synthesis canbe explored by structural analysis,
since RIisbelieved torepresent asteadystateof moleculesundergoing polymer synthesis (8).
In the first paper to enunciate this principle,
thestructureofRIwasexplored by measuringits
hydrodynamic properties and comparing them with theproperties of single-stranded viral RNA
andreplicative form (RF), which ispure
double-stranded RNA (8). In the present paper, the
emphasiswill beonthepopulation of molecules arising after denaturation of RI.Accordingtothe
theoretical analysis of RI, complete denaturation should yield a population of single-stranded
moleculeswithequalnumbers of molecules from
dinucleotidesupto a chainlength ofX-1, where
X = 3342isthenumber of nucleotides in the viral
RNA, plusalarger number of moleculesof chain length X,which isthe contributionof the
double-strandedtemplate.
There is no possibility for a priori prediction of the average number of single strands per
double-stranded template. When the theoretical analysis of RI was applied to the data on the
relative amounts ofsingle- and double-stranded
component inthepopulation of molecules of RI,
itwasestimatedthattheaveragenumber ofsingle
strandsofanylengthwas oneperRImolecule (8). Itmustbeemphasized that this numbermay vary
from batch tobatch of RI andmayalsodepend
on the method of preparation. Therefore, the
number of molecules of nascent viral RNA
could be more than one in native RI in vivo. After denaturation of preparations having one single strand per template, there should be 2X
moleculesof chainlengthX andXmolecules with
chainlengthsfromX-1to2(8).The 2X molecules
of length X derive from the template with a molecularweightof 2.2 X 10⁶.
As apreliminary toan analysisof the popula-tion ofmolecules derived from RI by
denatura-tion,it isnecessarytoinvestigatemeansbywhich
RI can be denatured. Denaturation of RI was
followed by increase in infectivity, changes in
buoyantdensity,andchanges inhyperchromicity.
514
Vol.1, No. 3 Printed in U.S.A.
on November 11, 2019 by guest
http://jvi.asm.org/
MATERIALS AND METHODS
Preparation of RNA. Growth of Escherichia coli
strain3000 andbacteriophageR17 has been described
(9).Preparationof RNA from purified bacteriophage R17 and preparation and purification of RF and RI
have beendescribed (7, 8, 20).
Denaturationi ofdouble-stranzded RNA (RF orRI).
(i) For heatdenaturation, approximately 20to40/Ag
of RNA per ml was dialyzed overnight against PE
[0.001 M potassium phosphate buffer, pH 6.6; 0.001
M sodium ethylenediaminetetraacetic acid (EDTA);
ionic strength0.0121. This RNAwasthenplaced ina
tightly stoppered tube, the total volume being 1 ml.
Thetubewasplunged intoaboiling-water bath,held
there for 3 min, and thenquick-frozen ina dry
ice-alcohol bath. (ii) For denaturation with dimethyl
sulfoxide (DMSO), double-stranded RNA was
de-natured with DMSO according to the method of
Katz and Penman (15). Approximately 200 to 400
flgof RNAwasdialyzed againstPE. Onepartof this
RNA was mixedwith six parts of DMSO
(Spectro-quality Reagent; Matheson, Coleman and Bell,
Cin-cinnati, Ohio), givingafinalDMSO concentration of
85.7% (v/v). This wasincubatedat37 Cfor 10 min
and thenquick-cooledinanice bath. NaCIwasadded
to afinalconcentration of 0.1 M (calculated onlyon
thebasis ofthe aqueousvolume), and the RNA was
precipitated byadditionof 2volumesofethylalcohol
followedbyincubationovernightat -20 C. The
pre-cipitated RNA was taken up in PE and dialyzed against PEbefore infectivity tests oranalytical
sedi-mentation studies.
Inifectivity ofRNA.Thesetestswerecarried outby
infecting spheroplasts with RNA and plating the
sphereoplasts for infective centers, byuseof standard
assay techniques. The preparation and infection of
spheroplastswerecarried outby modifications of the
procedure of Francke and Hofschneider(6). Aculture
ofE.coli 3000wasgrownovernightin TC Glmedium
(7),diluted 1:2,000 in TCGl,and allowedtogrowto
atiter of2 X 108cells per ml. The cellswereharvested
by centrifugation (5,000 rev/min) at room
tempera-turefor 10 min, andwerethen taken up in one-tenth
the original volume in five partstris(hydroxymethyl)
aminomethane (Tris) buffer(0.1 M,pH 7.7) andthree
parts 40% sucrose. Then EDTA and lysozyme were
added todigest the cell wall and form spheroplasts.
Anexample of thisprocedure, for 100 ml of original
culture, was asfollows. (i) A 6.25-ml amount of 0.1
MTrisbuffer (pH 7.7)wasadded; (ii) 3.75mlof
40%7o
sucrose was added; (iii) 0.26 ml of 0.1 M EDTAwas
added; (iv) 0.26 ml of lysozyme (Worthington
Bio-chemical Corp., Freehold, N.J.) was added at 2
mg/ml. The cells wereincubated for 10 min at room
temperature, resulting in a complete conversion to
spheroplastsasobservedby dark-fieldmicroscopy. At
this stage, further lysozyme action was inhibited by
addition to the above sample mixture of 0.14 ml of
0.5 MMg2SO4and 0.16 mlof30%bovineserum
albu-min (Fraction V from bovine plasma, Armour
Pharmaceutical Co., Kankakee, Ill.).
The spheroplasts were kept at room temperature
for30min. Then0.2-ml samples were exposed to 0.05
ml ofappropriate dilutions of RNA (usually 10, 1,
and 0.1 Mig/mlin 0.1 M Tris buffer, pH 7.7). After an
additional 30 min at room temperature, 0.2 ml ofan
E. coli 3000 suspension (108 cells per ml) wasadded,
followed immediately by the addition of 2 ml of
spheroplast soft agar; this mixture was poured onto
nutrient agar plates. The spheroplast soft agar had
thefollowingcomposition: Difco agar, 0.75%;
suc-rose, 3%,; CaC12, 0.01 M; MgSO4, 0.01 M; NaCl,
0.5% .
After autoclaving, the pH was adjusted between 7
and 8with 1NNaOH. Bottom agarwas the modified
MSagarpreviously used (9).
Hyperchromicity. Hyperchromicity curves were
recorded on aGilford model 2000 spectrophotometric
recorder. Glycerin was circulated through Beckman
thermospacers, and the temperature of the circulating
bath was set athigher than 100 C. The temperature,
measured directly in the cuvettes, increased from 25
to 100C inless than 45 min. The data werecorrected
for the expansion of water and plotted as optical
density (OD) at 260 mM at any given temperature relative to that at 25 C.
Analytical centtrifugationi. Sedimentation velocity
experimentsandanalysis of the results were described
in a previous paper (8).
Distribution functions in the Cs2SO4 equilibrium
gradient were determined by use of a 12-mm
alumi-num centerpiece. The solvent contained 0.001 M
potassium phosphate buffer (pH 6.6) with 0.001 M
sodium EDTA (PE). Solvent saturated at 25 Cwith
Cs2SO4 (optical grade; StanleyH. CohenAssociates,
Yonkers, N.Y.) wasadded toIto 2Mugof RNAin PE,
andthedensity of the solution was thendeterminedby
refractometry(high accuracy Abbe '60'refractometer,
Bellingham and Stanley) by use of the equation p25 =
13.6986 [nD]25 - 173233 (13, 21). Thefinal solvent
density wasadjusted to the appropriate value to band
theparticularRNAapproximately in the center of the
cell. Equilibrium centrifugation was carried out at
42,040 rev/min at25 Cfor 24 to 48 hr. Under these
conditions, no change in the concentration
distribu-tionof nucleic acid occurred after 24 hr.
Densitometer tracings of the photographic record
of theequilibrium distributionweremade by use of a
Spinco model RAnalytrol with a microdensitometer
accessory. Thedistribution ofCs2SO4 in the analytical
cellwascalculated from the usual equation (21):po =
p+ (12$) w2(ro + r'e) (ro- r'e), where po = density
atband center; p = original density of the solution;
c = angularvelocity;ro = distancefrom rotor center
toband center; r'e =
[12
(rb2 - ra2) 1/2; rb =distancefrom rotor center to bottom of thecell;ra = distance
fromrotorcentertomeniscus; 1
/O
=constant.Theconstant 1/dwas determined from the
collec-tion ofdataontheposition of the band center for a
given species of RNA centrifuged inCs2SO4 solutions
ofvariable original density. The average value of 1/d
was 1.252 X 10⁻⁹ (cgs), which differs from that
re-ported by Erikson and Szybalski (5). This may be due
to several factors, such as the relative purity of the
Cs2SO4. The purity of the Cs2SO4 would affect the
determination of p and thus alter the value of
1/7.
on November 11, 2019 by guest
http://jvi.asm.org/
FRANKLIN
RESULTS
Demonstration of denaturation of RF and RI:
Infectivity assays. According to Amman, Delius, and Hofschneider (1), double-stranded RNA (RF) fromcells infected with an RNA bacterio-phage is not infectious by itself but canbe con-verted to infectious material by heating. The conversion is due to denaturation of the double-stranded RNA, yielding at least one infectious single-strandedRNA, the"+"strand(1,6, 12a). This conversionhas beendemonstrated for both RFandRI(6,12a). There is alsosomesuggestion that RI is infectious before heatdenaturation and thatthe specific infectivity increases after heating (R. Erikson, E.Erikson, andJ. Gordon,J. Mol. Biol. 22:257-268, 1966).
[image:3.461.44.236.326.447.2]Data onthe increase ininfectivity afterDMSO denaturation of preparations ofRF or RI are reported in Table 1. The infectivity of a single batch of viral RNA varied by a factor of10 in individualexperiments,twoof which arereported in Table 2. This variation was probably due to variation in competence of the spheroplasts.
TABLE 1. Infectivity ofviral-specific RNA species
PFUperpAg Increase(fold)
Prepn of RNA ~afterDMS0
Prepn of RNA
Ictreatment
R17 RNA(A)a... 1.22X 10⁵
R17 RNA (B)a... 1.35 X 10⁴
Replicative form
(RF)... 492
DMSO-denatured RF.. 6,644 13.5
Replicative
inter-mediate
(RI)
... 41DMSO-denatured RI.. 474 11.6
aStandard RNA samples wereassayed on two
differentbatchesofprotoplasts. Batch Awasused
in the RF assayand batch B in the RI assay.
TABLE2. Buoyant density ofnative and denatured
viral RNA species
Exptno. Sample PO
5 R17 RNA 1.627
7 R17 RNA 1.627
13 R17RNA 1.628
1 RI 1.619
3 RI 1.619
8 RI 1.619
16 Denatured RIa 1.631
17 Denatured RIa 1.625
10 Denatured RIb 1.633
15 Denatured RIc 1.627
aTreated for 3 min at97 C.
bTreated with
85.7%
DMSOfor10minat37 C.cTreated with85.7%DMSOfor10minat45C.
Everytest of infectivity of RF or RI was accom-panied by a test of viral RNA. In a typical experi-ment, there was a 10- to 20-fold increase in infectivity after DMSO treatment of either RF orRI.Thus, the experiments of Hofschneider and co-workers onheat denaturation of RF and RI (12a, 15) and the present experiments withDMSO suggest that both methods may be useful in investigating the pattern of single-stranded mole-cules derived from RF and RI bydenaturation. Most of thepresent data areconcernedwith RI, since conversion of RF to 27S single-stranded RNA has been well established (12a). Some comparativedata on the denaturation of RF and RI are also presented.
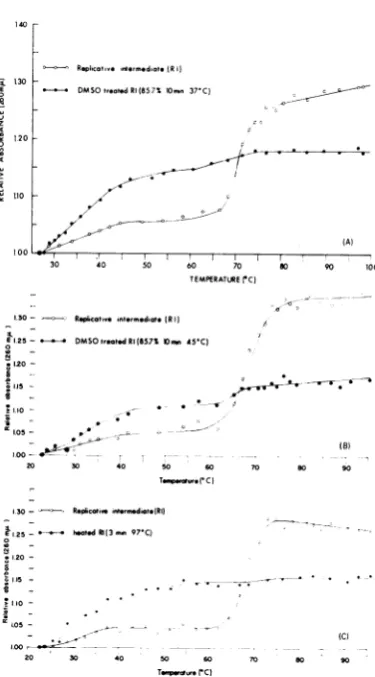
Hyperchromicity. Figure 1 presents a compari-son ofhyperchromicity of R17 RNA, RF, and RI. As expected, the single-stranded RNA dena-tures over a very broad range of temperadena-tures (2), thedouble-strandedRNA over a very short range (11, 16), and RI has a complex hyperchromicity owingto itspartially single-stranded and partially double-stranded properties (7). Thus, denatura-tion ofRF or RI should result in alterations in the hyperchromicitycurve. This wasbest demon-strated with RF (Fig. 2), which appears to be completely converted to single-stranded RNA after DMSO denaturation (10min at 37 C), at least according to the criterionemployed in this experiment.
RIdenaturedby treatment for 10minat 37 C with 85.7%DMSO still retained a small amount of double-stranded character as determined by the hyperchromicity test (Fig. 3A). This was retained even after more drastic treatment with DMSO (10minat 45 Cwith85.7%DMSO,Fig. 3B), or after heat denatdration (3 minat 97 C, Fig.
3C).
The smallest amount of residual- 130
t
. 120
110
-Bacteroph.geR17 RNA
-- Replicotwoih. .ed..to
RWpic.ti,efo___.
-/
-X
!
TI
30 40 50 60 70
TEMPERATURE('C)
80 90 100
FIG. 1. Temperaturedependence ofOD at 260m,u
ofR17 RNA, RF, and RI, all in PE (ionic strength
0.012). TheODat260m,uisplottedasrelativeincrease
in OD at260m,uatany given temperaturecompared
withthatat25 C.
516 J. VIROL.
on November 11, 2019 by guest
http://jvi.asm.org/
[image:3.461.246.445.378.608.2] [image:3.461.44.237.463.645.2]DM5
Replicat.4efo (RF)(5
-^ DMSOtreatedRF(85.7X10min 37'C
double-strandedcomponent was found after heat denaturation.
Equilibrium
distributions inCS2SO4.
Thebuoy-ant density of a single-stranded viral RNA was invariably lower than that of double-stranded RF isolated from cells infected with that virus (cf. 4). Since RI seems to have an intermediate value of buoyantdensity accordingtoequilibrium data in the preparative ultracentrifuge (3), buoyant density provides another criterion for denaturation. With the availability of highly
30 40 50 60 70 80 90 100
TEMPERATURErc)
FIG. 2. Relative increase in OD at 260 m,u as a
function of temperature of native RF (0) and RF
treated with DMSO(@).Bothsamplesweremeasured
inPE.
E 670 665
uJ
06560
655
I 00.50
u 645 5 640 635
DMSOt5e0t RI(857%IO..37-C)
BACTERIOPHAGE R17 RNA
(A) Il 0.1 05 2 510 20 40 60 80 95 99
CUMULATIVE f X 100
(A)
.1 I
30 40 50 60 70
TEMPERATURErc)
130- Rpqicati* int*8*doato(RI)
E1.25~ 4 DM50orta4dRi8(57%10m.i 45C)
110
1.20
1.05-
o-20 30 40 50 60
To_stwe(-C
E 665 -' 660
Z 655 6)50
s0eo vo90 100loo ~~~~0I 6.45
u 640
635
630
REPLCATIVE INTERMEDIATE
(B)
001 01 05 2 5 10 20 40 60 80 95
CUMULATIVEf X 100
(B)
70 80 90
i30- - Eplicativeinhrm7di3t9(RE)
E1.25- ~ heat dRl(3
97C)-20
S1-2
1.00 5(-CI~~~~
20 30 40 50 60 70 80 90
[image:4.461.28.214.51.209.2]Twwa,*rc)
FIG. 3A-C. Relative increasein ODat260ml asa
function oftemperatureofnativeRIand RItreatedas
indicated. All samples were measured in PE. InFig.
3C, heatingat97 Cwasfollowed byquick-freezingat
-70 Cpriortodeterminingthehyperchromicitycurve.
E 670
cRE 3c6h inrmediateR17RNA
665 -Z 660
-0655 0 6.50
-645
e 6A0
-(C) 0.01 GI 05 12 5 10 20 40 60 80 95 99 99.9 9999
CUMULATIVEF x100
FIG. 4. Cumulative distribution of the equilibrium
concentration ofR17 RNA and RIpreparations in a
Cs2SO4 gradient. Thecumulativedistributionona
prob-ability scale isplotted versus distance from the rotor
center. (A) R17RNA; (B) native RI; (C) mixtureof
RIandR17 RNA (ratioof RItoR17RNA,1.01).
140
5 130
-vu_
z
O 1.20
-010 _
130 _
<t
>0
!i oc° R*plicoatiei4*so.*dito.(Ri)
99.9 9999
A .
J
140
_-i.
a,
on November 11, 2019 by guest
http://jvi.asm.org/
[image:4.461.224.418.190.602.2] [image:4.461.29.217.265.604.2]FRANKLIN
purified RI, the buoyant density of RI was carefully compared with that of R17 RNA in Cs2SO4 in the analytical cell.
Some of the data on the buoyantdensities are shown in Table 2. The average buoyant density of single-stranded R17 RNA was 1.627 and of RI, 1.619, values consistent with the reported values of 1.630 and 1.616, respectively (3). After denaturation, the values scattered somewhat but were all close to the value for single-stranded RNA. Ananalysis oftheequilibriumdistribution, however, indicated that double-stranded RNA was still present in the heated or DMSO-treated RIpreparations. This analysis was carried out by
.12 r
f 10
.08 F
02 k
* DMSO 857%37-C,10 ,,
x xDMSO 85.7%45'C10min
\97-C 3min
/
*W----I c. T I
6/3 i
6.3 64 6.5 66 67
Distance from rotor center r Incm)
plotting on probability paper the cumulative distribution of the equilibrium concentration of nucleic acid versus distance from the rotor center. The height above base line of the densitometer tracing was taken as a measure of nucleic acid concentration.Thedistributionwasstartedatthe point nearest the rotor center. This plot has several advantages: (i) a Gaussian distribution is transformed intoastraight-line plot; (ii) a- can be read directly as the abscissa height between ordinate values of0.500 and0.841; (iii) themean, which should correspond to the peak for the Gaussian distribution, is read directly from the ordinate value of0.50; (iv) ascomparedwiththe
(B)
E 67 Denatured replcot,einte,medolte
c --- 857° DMSO I10m8 37°C
665 -- 85 7%DMS0 l08n845'C
No DMS0 38in 97°C
Z 660 -0
655
-0 0 650 -J 645
-0 640
635
-x
O01 01 05 2 5 10 20 40 60 80
CUMULATIVEf x 100
[image:5.461.49.440.231.426.2]95 99 49 9 99.99
FIG. 5. (A)Distributionof theequilibriumcontcentrationofdenatured RI. (B)Sameas5A,plottedas a
cumula-tivedistributiononprobabilitypaper.
(A)
)o 0
6
z 4
25 75 125 175 100
S20,.
200 400 600 1000
Choi.length(N)
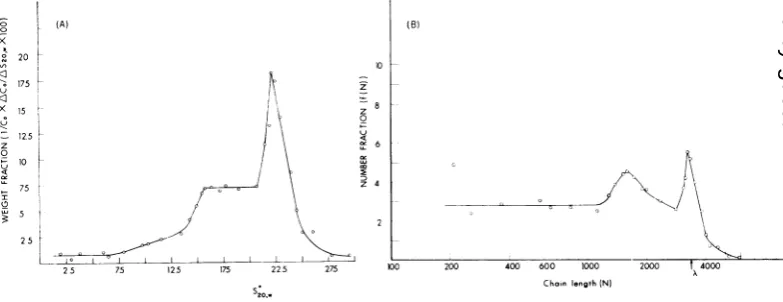
FIG.6. (A) WeightdistributionofSvalueforRI denatured with85.7%70DMSOfor10minat 37 C. This RI was
centrifugedinasolvent ofionicstrength0.06 at 52,640rev/min. (B) Numberdistribution ofchain lengths forRI denaturedwith 85.7% DMSOfor10minat 37 C. This isatransformation ofthe datapresentedinFig. 6A. The
arrowindicatesthepositioni ofR17RNA (molecularweight, 106to 1.1 X10⁶;chaiinlength, X =3,342).
518 J.VIROL.
0
x
ci
2
x
0
u
x:
(D 20 175 15 125 10 75
25
(B)
yAv/ \
2000 14000
--,W-A 'X
x
on November 11, 2019 by guest
http://jvi.asm.org/
[image:5.461.49.441.463.614.2]plot of band
height
versus(bandwidth)2/8j
(19), theprobability plot
is more accurate, since it avoids thelargeerrorsduetosquaring the largest bandwidths, whichare mostdifficult to measure because theyareclosesttothebaseline.The Gaussian plot of the equilibrium distribu-tion of
bacteriophage
R17 RNA is shown in Fig. 4A; that ofRI, in Fig. 4B; and that ofan artificial mixtureof
R17 RNAand RI, ina ratio of1.01 RI to 1 R17RNA,
is shown inFig.
4C. TheR17RNAdistribution isGaussian,
asisthe RIdistribution. The Gaussian distribution ofRI isunexpected
and will be commented on in the Discussion. The two-component distribution of the mixture of RI and R17 RNA wasclearly
demonstrated by
theprobability plot (Fig.
4C). The peak of this distribution was located at adensityof 1.614g/cm3. The
equilibrium
concen-trationdistributionsfordenatured
RI are shown inFig.5A, and theprobability plot
of the cumula-tivedistributions,
inFig.
5B. Under all conditions ofdenaturation,
the distributions are skewedtoward
thebuoyant
density of
single-stranded
RNA, and the
departure
from the Gaussian distribution isclearly
showninFig.5B.Theposi-tion of the
peak
inrelationtodistance
from the rotor centerdepended
on p and theposition
of themeniscus intheultracentrifuge
cell.Thus, theexperiments designedtodemonstrate denaturation ofRI and RF indicated that there was aresidual double-stranded component pres-ent in RI,
although
themajor
component wasdenatured
single-stranded
RNA. Thehyper-chromicity
curves indicated that heat-denatured RI hada smaller residualdouble-stranded
com-ponentthanDMSO-denatured
RI.Velocity sedimentation
analysis of
denatured RI. The aboveexperiments, although interesting
inthemselves,
werepreliminary
to theanalysis
of denatured RI. Thefollowing
strategy was used. Since the theoreticalanalysis
ofRI viewed as asteady-state population predicted equal numbers offragmentswithchain
lengths
of2toX-1,
then themostmeaningful
analysis would bea plot of the number distribution of chainlengths.
This distribution can be derived from the weight distribution ofS values (17)provided
that therelationship
between molecular weight and S value is known. Single-stranded R17 RNA in solutions of high ionic strength has, however, a sedimentation constant which is higher than thatexpected fromtheSpirin or Gierer relation-ship between S and M (7). Therefore, the ionic strength ofthe viral RNA was carefully adjusted according to the curve of dependence of the S value ofthis RNA on ionic strength (8) so that the Svalueofthecompletemolecule of molecular weight 106 to 1.1 X 10⁶would correspond to thevalue predicted from thewell-knownrelationship betweenSandM.In
particular,
anionic
strength
of
0.06M wasusedtoobtain S = 22.5. Toclarify
and recapitulate, RI was
denatured
in solutions of low ionic strength as described in Materials andMethods. Just beforeperforminga standard velocity sedimentationanalysis,the ionicstrength
wasadjustedto0.06Mbyadding the
appropriate
amountofNaCl.Aweightdistribution
of
Svalues [q(S) =1/Co
xAC0/.SO,30
x100]
was cal-culated (17), plotted, and then transformed into a number distribution of chainlengths.
The weight distributions [q(S)] areshown inFig.
6A and Fig. 7A. The number distributions[N(S)]
areshowninFig. 6Band7B.
The transformationfroma weight distribution to a number distribution [N(S)] was
done
asfollows.
Amolecularweight
wasassigned
toeach Svalue byuseoftheSpirinequation,
M =1,550-20
-z8
6
(A) 28r
24
121
to0 30
S.
B)
o
I--,1
-T
I-
11
K)O 200 400 600 1000
Choi.lgth (N)
[image:6.461.230.419.280.604.2]2000 14000
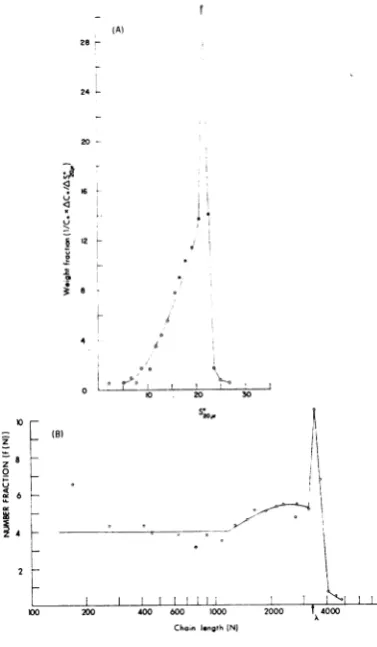
FIG. 7. (A) Weight distribution ofS valuefor RI
denaturedbyheating inPEfor3 minat97 C.
Condi-tionsforcentrifugation,same as inFig. 6A. (B)
Trans-formation of the data presentedinFig. 7A tothe
num-berdistributionofchainlengths. Thearrowindicates the
positionofR17 RNA.
(E
on November 11, 2019 by guest
http://jvi.asm.org/
FRANKLIN
521(cf. 7). Theweightdistribution q(S)wasthen divided by the chain length toobtainN(S). The chain length (number of nucleotides) was cal-culated for each S value by first calculating M and then multiplying this by 3,342/1.1 X 106, since the single-stranded RNA of molecular weight 1.1 x 10⁶ has 3,342
nucleotides
(18).Figure 6A shows the weight distribution ofS
for
RIdenatured
with DMSO, andFig.
6Bshows thetransformationtothe number distribution of chain lengths. Figures 7A and B show, respec-tively, the weight distribution of S and thetransformation
to the number distribution of chainlengths
forheat-denatured
RI. There was apronouncedbulge
inthe numberdistribution ofDMSO-denatured
RI (Fig.6B)
and a smallerbulge
in the numberdistribution
of heat-de-natured RI (Fig.7B).
Sinceheat-denatured
RI hadlessresidualdouble-stranded
componentthan DMSO-denatured RI, it is not unreasonable to speculate that this prominentdeviation
from the predicted distribution maybe due
tothedouble-stranded
component.The
height of the
peakof
complete
viral RNA(N
=X)
was about twice that ofthe
plateau
region
for DMSO-denatured RI and 2.5 times the plateau region forheat-denatured
RI.DIscuSSION
As a
preliminary
to ananalysis
ofdenatured
RI,
several
criteria for denaturationwerestudied.
The
infectivity
ofRIaftertreatmentwith DMSOunder conditions
which result indenaturation
of thepoliovirusreplicative
form(15)
ledto a10- to14-fold
increase inspecific
infectivity
forsphero-plasts,
measured
asplaque-forming
units(PFU)
per
microgram
of RNA. This increase iscom-parabletothe ninefold increase in RI
infectivity
after heat
denaturation, reported
by Erikson, Erikson, and Gordon(J.
Mol. Biol.22:257-268,
1966).A
similar
increaseinspecific
infectivity
wasfound
forRFdenatured
withDMSO.Changes
inoptical
density
during
thermal denaturation of R17RNA, RF,
andRIprovide
abasis for a further
analysis
of thedegree
of denaturation.Single-stranded
RNA denatures over a wide temperature range(2),
whereas RF and other types of double-stranded RNA de-nature athighertemperaturesand overa narrowtemperature range
(11, 14,
16).
RIhyper-chromicity curves havetwo distinct components
owing
to thesingle-
and double-stranded prop-ertiesof themolecules(7).
All thesefeatures areillustratedin
Fig.
1.Whereasthehyperchromicity
ofDMSO-denatured RF increases
continuously
with no detectable step, that of RI denatured underanyconditionhasastep inthetemperature range where double-stranded RNA denatures.
This suggests a residual double-stranded com-ponent, and the amount of this component can be estimated from the percentage increase in absorbance of the step region. The residual double-stranded component varied between 17 and25% ofthe total withDMSO-treated RI and was6.4% withheatedRI.
Equilibrium distributions of both R17 RNA and RI in gradients ofCs2SO4 conformed to the Gaussian distribution.Althoughthiswasexpected for the single-stranded RNA, itwas not entirely expected for RI, which is composed of single-strandedRNA of
po
= 1.629 anddouble-stranded RNAofpo
= 1.608to 1.606 (3, 4). The variable lengthsofsingle-stranded RNA might be expected toconferadensityheterogeneity on RI which has anaverage buoyant density of 1.619, intermediatebetween
that of single-stranded R17 RNA and RF. However, it may be that the intermediate buoyant density ofRI is not entirely dueto the averaged contributions ofRFandR17 RNA, but also dueto some structural features peculiar to RI, such asthe structure atthe point where the single-stranded branch deviates from the double strand.From the probability plot of the cumulative distribution, the
a2
forR17RNA was 2.02 X10⁻³, leadingto amolecularweightestimate of0.77 x 106.TheU2forRI was1.37 X 10-3to1.51 X 10--3 leadingto amolecular weight estimate of1.01 x 106to1.14 x 106.The
molecular weight estimate for R17 RNA istoolowbyafactor
1.4and that forRIby
afactor
2.5, byuseof
1.1 X 10⁶ asthe best estimatefor R17RNA(10,18)
and 2.9 x 10⁶ asthe theoretical weightaveragemolecular weight ofRI(7). Themolecular weight
estimates derived from theband
widthofequilibrium distributions ofT2andT4deoxyribonucleic
acidareknowntobe low bya factor of2 (19), and the deviation found in the present determinations may be assumed to be due to the same type of error, whatever that may be. This
fact,
plus
the pro-nounced deviationof
the distributions of de-naturedRIfrom the Gaussiandistribution,
made itpointless toattempt an estimateof
the molec-ularweight
ofthe denatured RI from the band width of theequilibrium distribution inCS2SO4
. However, the distributionsclearly
showedthat,
whereas the bulk of denatured RI was
single-stranded
(po
= 1.627to1.631),
there was stilladouble-stranded
component.The number distribution ofchain
lengths
waspredicted to be
composed
ofequal
numbers of molecules with chainlengths
of 2 to X-1plus
alargernumber of molecules with chain
lengths
of X (cf.7).
The relative number of molecules of chain length Xdepends
on two factors.(i)
The first factor is the average number ofsingle
520 J.VIROL.
on November 11, 2019 by guest
http://jvi.asm.org/
strandsperdouble-stranded template, whichwas about 1 for the present preparations of RI (7). On this basis, therefore, there should be two molecules of chain length X for every molecule of chain length less than X. (ii) This assumes, however,that completion of chains, i.e., addition of the terminal nucleotide to a nascent chain of length X-1, results in displacement from RI, so that thelongest chaintobefoundassociated with RI maybe oneof length X-1.
Fromthenumber distribution, it isdifficult to obtainmorethan a first-order approximation of the ratio of numbers of molecules of length Xto the number of molecules of length less than X. This is because there is considerable inherent error in the estimate of the number distribution used here, especially at chain lengths less than about200(see nextparagraph).Also,thevariable amountof residual double-stranded RNA inthe population
of
denatured RI will affect the result (see nextparagraph). Anestimate of the relative amountsof material of chain length X andlengths<X
wasmade by planimetry ofa linear plot of Nversuschainlength.Notethat forconvenienceonly
semilogarithmic plots areshownin Fig. 6B and7B.This ratio is0.4rather than thepredicted
value of 2. This would indicatean uppervalueof five single strands (or five growing points) per replicative intermediate. Thus, thepresent experi-mentsandearlierexperiments (7,8) indicate that thereareprobably betweenoneand five growing
points
perRI molecule.Betweenchain lengths of200and 1,100, there isasatisfactory fit of the numberdistribution to that predicted. Deviations occurring at very low chain lengths are due to two factors. Chains of very short length may be lost during dialysis of denaturedRI.Also, the slopeoftheconcentration distribution during velocity sedimentation isvery small and, therefore,very difficultto measure at values corresponding to the smallest chain lengths. Thus, large errors arise inthisportionof theweightdistribution curveand subsequentlyin the number distribution transformation. The deviation from equal numbers ofmolecules be-tween1,200 and3,000 was seen inallexperiments. The amount of material in this region was some-what higher in DMSO-denatured RI than in heat-denatured RI. Thisleads to thespeculation that thisrepresents the residual double-stranded material. When analysis of hyperchromicity curvesforheat-denaturedRIledto anestimateof 6.4%double strand, the area under the bulge in the number distribution curve was 6.2%. On the other hand, RI treated with
DMSO
for 10 min at 37 C had a 16% residual double-stranded component when analyzed by hyperchromicity, but the area under the bulge in the numberdistribution curve was only 7%. In view of the difficulties inherent in this experiment and the problem of the residual double-stranded com-ponent, the fit of the number distribution of denatured RI to the predicted distribution is quite satisfactory. It is not clear asyet whether the double-stranded residue is a special class of double-stranded molecules or some partially denatured RI. No evidence of a special type of double-stranded RNA, suchascircular RNA,was seen inelectron micrographs of RF and RI (12) or denatured RI (Granboulan and Franklin, in preparation).
ACKNOWLEDGMENTS
I am grateful toJohn Cann, Department of
Bio-physics, University of Colorado SchoolofMedicine,
for the useofhis model Eanalytical ultracentrifuge.
Elizabeth Hinckleypreparedthenucleic acidsused in
this study, and additional technical assistance was
providedby MarianneSalditt.
Thisinvestigation wassupported by PublicHealth
Service grant AI 07645fromtheNationalInstituteof
Allergy and Infectious Diseases and by grant GB
5365 from theNationalScience Foundation.
LITERATURE CITED
1. AMMAN, J., H. DELIUS,ANDP. H. HOFSCHNEIDER.
1964. Isolation and properties of an intact
phage-specific replicative form of RNA phage
M12.J. Mol. Biol. 10:557-561.
2. DoTy, P., H. BOEDTKER, J. R. FRESCO, R.
HASELKORN, AND M. LITT. 1959. Secondary
structureinribonucleicacids. Proc. Natl.Acad.
Sci. U.S. 45:482-499.
3. ERIKSON, R. L. 1966. Fractionation of
viral-specific ribonucleic acid by cesium sulfate
equilibrium density-gradient centrifugation. J. Mol. Biol. 18:372-381.
4. ERIKSON, R. L., AND R. M. FRANKLIN. 1966.
Symposiumonreplicationof viralnucleicacids. I. Formation and properties of a replicative intermediate in the biosynthesis of viral
ribo-nucleicacid. Bacteriol. Rev. 30:267-278.
5. ERIKSON, R. L., AND W. SZYBALSKI. 1964. The
Cs2SO4 equilibrium density gradient and its
application for the study of T-even phage DNA: glucosylation and replication. Virology
22:111-124.
6. FRANCKE, B., AND P. H. HOFSCHNEIDER. 1966.
Infectious nucleic acids of E. coli
bacterio-phages.IX.Sedimentationconstantsand strand
integrity of infectious M12 phage replicative
form RNA. Proc. Natl. Acad. Sci. U.S. 56:
1883-1890.
7. FRANKLIN, R. M. 1966. Purification and
prop-erties of the replicative intermediate of the
RNA bacteriophage R17. Proc. Natl. Acad.
Sci. U.S.55:1504-1511.
8. FRANKLIN, R. M. 1967. Replication of
bacterio-phage RNA:somephysical propertiesof
on November 11, 2019 by guest
http://jvi.asm.org/
FRANKLIN
stranded, double-stranded, and branched viral
RNA. J.Virol. 1:64-75.
9. FRANKLIN, R. M., AND N. GRANBOULAN. 1966.
Ultrastructure of Escherichia coli cellsinfected
with bacteriophage R17. J. Bacteriol. 91:834-848.
10. GESTELAND,R.F.,ANDH. BOEDTKER. 1964. Some
physical properties of bacteriophage R17 and
itsribonucleic acid. J. Mol. Biol. 8:496-507.
1t. GOMATOS, P. J., AND I. TAMM. 1963. The
sec-ondarystructure of reovirus RNA. Proc. Natl.
Acad.Sci. U.S. 49:707-714.
12. GRANBOULAN, N., AND R. M. FRANKLIN. 1966.
Electron microscopy of viral RNA, replicative
form, and replicative intermediate ofthe
bac-teriophage R17. J. Mol. Biol. 22:173-177.
12a. HOFSCHNEIDER, P.,J.AMMAN, AND B. FRANCKE.
1967. Infectious M12 phage replicative form
RNA: A tool for studyingviral RNA
replica-tion. In J. S. Colter [ed.], Proc. Symp. Mol.
Biol. Virus, Academic Press, Inc., New York,
inpress.
13. JENSEN, R. H.,ANDN. DAVIDSON. 1966.
Spectro-photometric, potentiometric, and density
gradient ultracentrifugation studies of the
binding ofsilver ionby DNA. Biopolymers 4:
17-32.
14. KAERNER, H. C., AND H. HOFFMAN-BERLING.
1964. Synthesis of double-stranded RNA in
RNA-phage infected E. colicells. Nature 202:
1012-1013.
15. KATZ, L., AND S. PENMAN. 1966. The solvent
denaturation of double-stranded RNA from
poliovirus infected HeLa cells. Biochem.
Bio-phys.Res. Commun. 23:557-560.
16. MONTAGNIER, L., AND F. K. SANDERS. 1963.
Replicative form of encephalomyocarditis
virusribonucleic acid. Nature199:664-667.
17. SCHUMAKER, V. N.,ANDH. K. SCHACHMAN. 1957.
Ultracentrifugal analysis of dilute solutions.
Biochim.Biophys. Acta 23:628-639.
18. SINHA, N. K., R. K. FUJIMARA,ANDP. KAESBERG.
1965. Ribonuclease digestion of R17 viral
RNA. J. Mol.Biol. 11:84-89.
19. THOMAS, C. A., JR., AND K. I. BERNS. 1961. The
physical characterization of DNA molecules
releasedfrom T2 and T4 bacteriophage.J.Mol.
Biol. 3:277-288.
20.
VASQUEZ)
C., N. GRANBOULAN, AND R. M.FRANKLIN. 1966. Structure of the ribonucleic
acid bacteriophage R17. J. Bacteriol.
92:1779-1786.
21. VINOGRAD, J., AND J. E. HEARST. 1962.
Equilib-rium sedimentation of macromolecules and
viruses inadensity gradient. Fortschr. Chem.
Org. Naturstoffe 20:372-422.
522 J.VIROL.