_
DESIGN OPTIMISATION OF A REGENERATIVE PUMP USING
NUMERICAL AND EXPERIMENTAL TECHNIQUES
Francis Quail, Thomas Scanlon, Matthew Stickland
Department of Mechanical Engineering, Strathclyde University, James Weir Building, 75 Montrose Street, Glasgow, G1 1XJ, United Kingdom
[email protected] [email protected] [email protected]
Abstract
Regenerative pumps are the subject of increased interest in industry as these pumps are low cost, low specific speed, compact and able to deliver high heads with stable performance characteristics. The complex flow-field within the pump represents a considerable challenge to detailed mathematical modelling. This paper outlines the use of a commercial CFD code to simulate the flow-field within the regenerative pump and compare the CFD results with new experimental data. A novel rapid manufacturing process is used to consider the effect of impeller geometry changes on the pump efficiency. The CFD results demonstrate that it is possible to represent the helical flow field for the pump which has only been witnessed in experimental flow visualisation until now. The CFD performance results also demonstrate reasonable agreement with the experimental tests. The ability to use CFD modelling in conjunction with rapid manufacturing techniques has meant that more complex impeller geometry configurations can now be assessed with better understanding of the flow-field and resulting efficiency.
Keywords: CFD, regenerative pump, helical flow, impeller
INTRODUCTION
Pumps are the single largest user of electricity
in industry in the European Union and energy savings of 3% would result in a 1.1TWH p.a. reduction in consumption or a
saving of 0.54 Mton of production as outlined at the IMechE Fluid Machinery Symposium (2007). As industry attempts to make energy savings and reduce environmental impact, this paper considers a computational and experimental analysis of a regenerative pump to simulate the flowfield and match pump performance. There is limited published data and insufficient design guiding criteria to allow more intuitive industrial selection of this pump type, particularly to meet more stringent European pump selection criteria defined in EU Directive 2005/32/EC (2005).The existing numerical models are limited in matching the flow characteristics across a running characteristic. The complex flow-field within the pump represents a significant challenge to detailed analytical modelling, as described by Badami (1997), Engeda (2003), Raheel et al. (2005) and Song et al. (2003). To date, the most fruitful research work has come from experiments on specific units, e.g. Wilson et al. (1955), and corresponding flow visualisation studies conducted by Engels (1940), Bartels (1947), Lazo et al. (1953) and Lutz (1953).
This paper presents the use of a commercially available solver; FLUENT version 6.3.26, in conjunction with new experimental testing to resolve the flowfield. The University of Strathclyde departmental experience
in parallel-architecture computation was used to run the CFD model of the regenerative pump with a High Performance Computer facility. The HPC system consists of 100 Opteron processors accessing a total available memory of 236 GB RAM.
The main characteristic of such pumps is the ability
to generate high discharge pressures at low flowrates. Although the pump has other advantages the main limitation is its inherent lack of efficiency, typically 35-50%. The highest ever reported efficiency for the regenerative pump of 50% was given by Crewdson
in (1956).
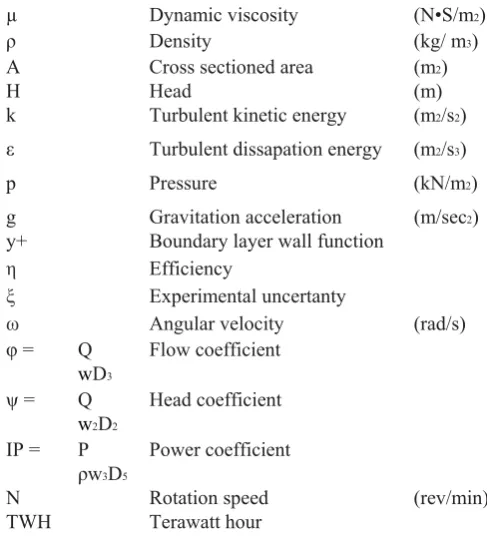
figure 1: Regenerative Pump Schematic NOMENCLATURE
A Cross sectional area (m²) CFD Computational fluid dynamics CO2 Carbon dioxide
D Impeller diameter (m)
HPC High performance computer
P Power (kW)
Q Volume flow rate (m³/s)
Re UA µ
Reynolds number
µ Dynamic viscosity (N•S/m2)
Density (kg/ m3)
A Cross sectioned area (m2)
H Head (m)
k Turbulent kinetic energy (m2/s2)
Turbulent dissapation energy (m2/s3)
p Pressure (kN/m2)
g Gravitation acceleration (m/sec2)
y+ Boundary layer wall function
Efficiency
Experimental uncertanty
Angular velocity (rad/s) = Q
wD3
Flow coefficient
= Q
w2D2
Head coefficient
IP = P w3D5
Power coefficient
N Rotation speed (rev/min)
TWH Terawatt hour
THE REGENERATIVE PUMP
[image:2.595.51.295.50.319.2]The pump uses an impeller with turbine-type blades mounted on the periphery running in an
annular channel surrounding the periphery of the wheel (figure 1).
figure 2:
Regenerative Pump Helical flowpath
figure 3:
Regenerative Pump Impeller
In the standard design, the impeller has radial teeth machined into the impeller periphery (figure 3)
and the fluid passes through an open annular channel and circulates repeatedly through the impeller
vanes (figure 2). This paper also considers the effect of impeller blade geometry changes on (figures 4
& 18) the pump efficiency (figure 17).
figure 4:
Regenerative Pump Vector Allignment
figure 5:
Regenerative Pump Pressure Contours.
The regenerative pump is sometimes also referred to as a peripheral pump, turbulence pump,
friction pump, turbine pump, drag pump, side channel pump, traction pump or vortex pump. The
suction region is separated from the discharge region by a barrier on the casing known as a Stripper
(figure 1). The repeated fluid circulation during the flow process or ‘multistaging’ principally allows
regenerative pumps to generate high heads at relatively low specific speeds (figures 5 & 6).
In spite of having operating characteristics that mimic a positive displacement pump, (power
directly proportional to head, with maximum power required
at shutoff, and a steep head-capacity curve), the regenerative pump is a kinetic pump (e.g. figure 6).
That is kinetic energy is imparted to the fluid by the series of impulses given to the fluid by the rotating
impeller blades. The regenerative pump will develop significantly higher heads than a centrifugal pump
with comparable impeller size (Muller 2004).
figure 6:
Head coefficient v’s flow coefficient experimental results
figure 7:
Head coefficient v’s flow coefficient CFD predictions
of the flowfield only observed in visualisation testing to date e.g., (figures 13, 14 and 15).
Figure 8:
Regenerative Pump Rig Schematic
Experimental Procedure
The experimental rig, (figure 8), is a closed loop arrangement, where a reservoir tank stores and
ultimately receives the working fluid, in this case water. The fluid is drawn to the pump from the tank
via a flow control valve. The fluid flowrate is measured using a Hall Effect turbine flowmeter situated
downstream of the flow control valve and upstream of the pump. The pump itself was driven by a 3kW
induction motor operating at a constant speed of 3000rpm. The motor housing is coupled to a
dynamometer containing a load cell to measure strain and hence indicate input torque to be used in the
pump efficiency calculations. The loadcell (using a Wheatstone bridge arrangement) strain
measurement has been calibrated against force and is converted to a reaction torque. The fluid flowrate
is adjusted via a flow control valve metering the flow to allow a range of measurements to be taken to
develop a running characteristic. This enables a range of flows and the corresponding pump inlet /
outlet pressures and input torque values to be measured.
The test impeller have 30 blades of width 12 mm and diameter 74.5mm. The pump is of double
suction shape designed with alignment of the blades to balance axial thrust (figures 1, 3). In this design
the impeller
has radial teeth or vanes machined into each side at
its periphery.
The measurements are collected using a data acquisition unit and pump characteristic flow, head,
power and efficiency coefficients can be calculated as expressed in equations (4), (5),(6) and (7). Every
independent measurement
xi
will have an associated uncertainty xi .
When measurements are combined the “stack-up” of uncertainties determines the final experimental uncertainty. To estimate the overall experimental uncertainty R, the root of the sum of the squares is
used, Kirkup (1994)
(1)
Where R the dependent variable of interest, i is the index representing the measured variable and is the sensitive coefficient of R with respect to Xi given as:
(2)
For pump efficiency, input power and head we have:
(3)
For a typical case of the regenerative pump, a 5% error was determined for the flowrate, a 0.6% error for the head and 4.3% error in the power calculation. Applying equation (3) this equates to a pump efficiency error of 6.6%. The random scatter was evaluated from repeatability tests and sensitivity analyses. The systematic inaccuracy due to aggregate systematic errors in transducers and changes in performance due to build-to-build differences are difficult to evaluate, e.g. Woollatt et al. (2005). To achieve this it is essential that the data acquisition system incorporates procedures which evaluate the quality of the data as it is acquired. This allowed comparison of the actual data with expected, and when necessary analysis of the raw measurements to verify accuracy (figure 9).
figure 9: Data Acquisition Layout
figure 10: NPSH vs. Flow Coefficient
In the rig arrangement, (figure 8), measures where taken to minimise effects which could reduce the inlet pressure to the pump. Selection of optimal inlet line length, and bore were considered as well as pump elevation and upstream discontinuities that affect inlet pressure. Regenerative pumps, typically, require lower net positive suction heads than other kinetic pumps, e.g. centrifugal pumps, Muller (2004). Indeed as shown in (figure 10) the lowest NPSH requirement for the pump is 0.25m. The very low NPSHR is typical of regenerative pumps, which, under similar conditions, would require a typical volute pump to have an additional 6–8 times NPSH requirement. The regenerative pump can handle fluids with 20% entrained gases. Under the same conditions a centrifugal pump would experience cavitation.
CFD MOdelling
Fluent Best Practices for Rotating Machinery (2006), recommends that for complex turbomachinery geometry, a non-conformal hybrid hexahedral / tetrahedral mesh is appropriate where the rotation of the rotor is treated as a steady-state in a multiple reference frame model (MRF). In the case of the regenerative pump separate meshes
then solved in local rotating reference frames where fluxes are locally transformed from one frame to another at the pump zone interfaces.
figure 11: Casing Fluid Region Tet Mesh
figure 12: Impeller Fluid Region Hex Mesh
For the regenerative pump application a pressure-based solver was chosen as the current analysis only considers incompressible flow. The velocity formulation selected was to use Absolute Velocity Formulation (AVF) as the fluid inflow comes from a stationary domain. In this case absolute total pressure was measured during the regenerative pump testing. The MRF model is appropriate for incompressible flows as the flowfield responds instantly to changes in rotor position. A different approach would be required, to consider compressibility of the fluid e.g. in regenerative blowers, Hollenberg et al. (1979), Sixsmith et al (1977), but for the current analysis where the fluid is treated as incompressible then use of MRF at multiple fixed rotor positions is a suitable and a recommended approach, e.g. Fluent guidelines (2006), FLUENT application briefs (2001) and (2005).
For modeling turbulence, realizable k - e was chosen, Spalart (2000) and Shih et al. (1995), for the regenerative pump as it is suitable for complex shear flows involving rapid strain, swirl, vortices and locally transitional flows (boundary layer separation and vortex shedding). Unlike many pump cases the clearances are very small between the impeller and the casing in the regenerative pump stripper region. In considering the above there is a balance to achieve good convergence, satisfying the performance matching and in modeling turbulence the mesh should be made either coarse or fine enough to prevent the wall-adjacent cells from being placed in the buffer layer (y+ = 5 - 30). Using excessive stretching in the direction normal to the wall was avoided. It is important to have at least a few cells inside the boundary layer and for the pump this was kept to a minimum of 5 cells. For the wall functions, each wall-adjacent cell’s centroid should be located within the log-law layer, 30 < y+ < 300. A y+ value close to the lower bound (y+ ~ 30) was sought. When using adaption this can result in large cell size changes which was to be avoided. In Fluent application briefs EX 143 (2001), EX 164 (2001) and EX 232 (2005) water pump MRF simulations made use of tetrahedral and hybrid meshes
of between 1 million cells to 2.4 million cells.
It is essential to minimize cell skewness and aspect ratio. Skewness was kept below 0.9 and aspect ratios of greater than 5:1 was avoided. Initially the model was a complete Tet mesh (impeller and casing) which resulted in a 753,000 cell model; however the impeller was decomposed to prevent numerical error (false diffusion) across the flowfield and for greater post-processing control (impeller surfaces plots). The grids were adapted until there was only small differences in (< 1% change) parameters. Four adapted grid sizes where assessed, 400,000; 800,000; 1.6 million and 2.4 million cells.
Grid independence was established at around 1.9 million cells. The results where comparable in accuracy with those published by FLUENT (2001) and (2005). There was no significant change in the solution at around 1.9million cells, and as grid independence is of importance, quality of the mesh (particularly in the buffer region) and performance results are also important.
Most of the published data until now suffers from two fundamental problems which limit their use as a design tool. The first is a reliance on empirically derived loss factors which are not directly related to design parameters and the second defect is that they are an essentially one dimensional tool and take no account of spanwise variation.
results
figure 13: Regenerative Pump Helical Pathlines Plot
Therefore no indication of how the design might be modified to reduce the losses is indicated or methods given to evaluate designs which significantly differ from the geometry on which the models are based. Until this point the best interpretation of the flowfield came from flow visualisation work for regenerative pumps as described by Engels (1940), Bartels (1947), Lazo et al. (1953), Lutz (1953) and Wilson et al. (1955). Their work indicates a helical flowfield observed within the pump which can’t be explained in the work from Senoo (1948), Pfleiderer (1961), Iverson (1955), Crewdson (1955). The modelling presented in this paper takes account of this characteristic flowfield (figures 13, 14) and extends the understanding with further information, (figure 14). The pathlines plot illustrates the spiral flow patterns and leakage flows across the stripper (figure 12).
figure 14: Regenerative Pump Helicity Contours
This is extended with a plot of the helicity contours across the impeller / casing flow area (figure 14). This illustrates how the flow in the side channel unites with the circumferential flow in the impeller forcing the helical flow pattern (figures 13, 14). It is not only in the ability of CFD to represent the flowfield within the pump but the ability to reasonably match the overall experimental test performance that defines the merits of this approach, e.g. (figures 19, 20). Experiments conducted by Lazo et al. (1953) and Lutz (1953), used small thread probes at different points in the annular flow passage of the pump to determine the direction of the flow velocity. They were able to corroborate the helical streamlines when plotting the results. Engels (1940) demonstrated that with decreasing flowrate, pump circulation is considerably increased reaching a maximum as the flow from the pump is reduced. Previous work, e.g. Pfleiderer (1961), that does not describe the helical flow nature instead conclude a constant circulation rate with reducing the flowrate.
These theories conclude that the circulation is only dependant on the resistance of the flow in the side channel and the impeller and is independent of the pressure in
the working channel. The current study can discount this,
distribution presented, e.g. Wilson (1955), Badami (1997), Song et al. (2003), Engeda (2003) and Raheel et al. (2005), (figure 16). The veracity of the current matching approach presented in the current paper captures not only the overall pump performance but in doing so relates local pressure variations in the flowfield in a more precise manner to the observed helical contour.
figure 15: Local pressure variations from inlet port to outlet port
figure 16: Typical presented pressure distribution of regenerative pump (e.g. Raheel et al. 2005)
figure 17: Pump efficiency v’s flow coefficiency
figure 18: Vector alignment plot inlet port
Figure 6 and 7, indicates the CFD and experimental head vs. flow coefficients are in good agreement. The slope follows the established characteristics of a regenerative pump. The dimensionless plots are used to illustrate the regenerative pump is a hydrodynamic unit obeying the same similitude laws as centrifugal and axial pumps, turbines and compressors. In conventional dimensionless terms:
(4)
(5)
(6)
(7)
In Fluent application briefs EX 143 (2001), EX 164 (2001) and EX 232 (2005) water pump MRF simulations made use of tetrahedral and hybrid meshes of between
1 million cells to 2.4 million cells. The steady-state MRF model is used to simulate the rotation of the moving parts. In the current study the experimental results and the CFD predictions are within a 3 % indicating that the meshing strategy was reasonable, Woollatt et al. (2005). The examples referenced above Ex143(2001) Ex 164 (2001) at best achieved a 7% matching marging. Typical experimental spread even in calibrated data was found to be around 6% indicating a reasonable matching procedure presented in the current paper.
Geometric features of the impeller blade were modified after an analysis of flow allignment carried out by the author in (ii) QUAIL (2009) (e.g. fig 18).
The same initial matching approach was performed for the modified blade as is detailed for the standard radial blade to assess flow alignment, flow direction and performance distribution. Modified blade profiles where then manufactured for assessment based on aligning the flow and trying to reduce losses. (i) QUAIL (2009). Most authors have concluded that substantial efficiency and performance improvement would be attained with better understanding of the flowfield in the regenerative pump e.g. Wilson (1955), Badami (1997), Song et al. (2003), Engeda (2003) and Raheel et al. (2005).
Whilst the current work indicates a reasonable concurance with experimental data figures (19, 20) it is important to comment on the possible sources of error. In matching there is often some simplification of geometry, or the mesh may be left relatively coarse in the tip region, and other smaller features such as fillets may not be fully represented. The simplification of the true geometry, due to difficulties in obtaining grids, or restrictions on the numbers of nodes which may be used due to the limitations in processing power, leads to unquantifiable errors. These errors could become significant relative
to the performance increments now being sought.
There is a trade off to ensure mesh quality, near wall modelling, and the computational cost of the mesh. MRF may be difficult to solve because of large flow gradients resulting from the rotation of the fluid domain. MRF grid interfaces introduce some error due to the nature of the MRF approximation (i.e. local transfer of flow properties across the interface with no account for grid motion). Steady-state simulation changes in relative position between stationary and rotating meshes (e.g., interaction and interference) are not accounted for in the MRF model. It is not accurate if recirculation exists at the interfaces. This is known to under-predict the flow rate (1-3%) due to losses, FLUENT (2006).
Accuracy and repeatability are major and inescapable issues in testing and have been considered in the experimental section of this paper. Pump efficiency error for the indicated case can be of the order of 6.6%. Whilst accuracy is an issue in CFD repeatability should not be, given the same solution starting conditions. The mesh definition and quality (clustering, orthogonallity, cell aspect ratio, etc.) have a considerable influence on accuracy; with highly skewed cells in particular have a large impact Hirsch (1994).
figure 19: Circulations v’s Flow coefficient
CONCLUSIONS
There are a number of conclusions which may be drawn with regard to effectively matching the regenerative pump CFD model with the experimental data. CFD results produced a reasonable representation of the flow in a regenerative pump and are being utilised to focus investigation for unit performance improvement (figures 1, 18). As the capabilities of CFD continue to develop, it is to be expected that the uncertainties associated with CFD prediction should also reduce. At the very least it is to be expected that there will be a continuing growth in processing power for the foreseeable future, which will reduce and perhaps remove the geometric simplifications which have to currently be made. There is a need for significant developments in instrumentation technology and novel approaches which enable detailed data to be acquired over large regions at higher accuracy, (particularly for flow in the current study), but at a reasonable cost.
This work has been useful to not only benchmark current regenerative pump design, but gives confidence
in the ability of CFD optimisation for the design to increase the performance of the pump in the future. The ability of the CFD to establish a reasonably good representation of the pump under steady state incompressible conditions is the starting point to investigate the design modifications that are making
the pump more efficient. An optimised blade profile has matched the highest ever reported regenerative pump efficiency of Crewdson (1956) (Fig 17).
References
BADAMI, M.: “Theoretical and experimental analysis of traditional and new peripheral pumps” SAE Technical Papers Series, No 971074 (1997)
BARTELS, j.,“Performance of peripheral pump” -Associate Professor Polytechnic Institute of Brooklyn (1947)
CREWDSON, E.“Water-ring self -priming pumps.” -Proceedings of the Institution of Mechanical Engineers Vol. 170 No. 13, pp. 407–415. (1956).
ENGEDA, A.:“Flow analysis and design suggestions for regenerative flow pumps” ASME FEDSM2003-45681 (2003) ENGELS, H.:“Investigations of Ring pumps”, Tech Hoch Hannover. (1940)
EUROPEAN PARLIAMENT. “Establishing a framework for the setting of ecodesign requirements for energy-using products”, DIRECTIVE 2005/32/EC (2005)
FLUENT version 6.3.26.: © ANSYS Inc. All Rights Reserved (2006)
FLUENT - Best Practices For Rotating Machinery (2006).: © ANSYS Inc. All Rights Reserved
FLUENT.“Backward inclined Centrifugal Fan”- Ex143 Application briefs from FLUENT – (2001)
FLUENT. “Automotive Water Pump”- Ex164 Application briefs from FLUENT – Courtesy of TESMA Engine Technologies (2001)
FLUENT. “Mixed Flow Pump”- Ex232 Application briefs from FLUENT – (2005)
HIRSCH, C.H.,: “CFD Methodology and Validation for Turbomachinery Flows”, Paper 4 in: AGARD-LS-195, Turbomachinery Design Using CFD. (1994)
HOLLENBERG, J.W,. POTTER, J,H., “ An Investigation of Regenerative Blowers and Pumps” Trans ASME Vol 101pp 147-152 (1979)
I MECH E – “Energy Saving in pumps and Pumping” Fluid Machinery Group Symposium (2007) IVERSON, H. W.:“Performance of the Periphery Pump” –Trans ASME Vol 77 pp 19-28 (1955)
KIRKUP, L.,“An introduction to the analysis of presentation of data” – Experimental Methods – John Wiley and sons
(1994).
LAZO, L., HOPKINS, T., “Theoretical and experimental analysis of a regenerative turbine pump”.– Massachusetts Institute of Technology (1953).
LUTZ G.F., “Experimental Investigation of the pressure distribution in a regenerative turbine pump”.. – Massachusetts Institute of Technology (1953).
Muller, S.:“Consider regenerative pumps for low flow/low NPSH applications.” -Hydrocarbon Processing pg 55-57 (2004)
PFLEIDERER, G.:“Pumps for liquids and gases” Springer - Verlag, 5th edition (1961)
(i) QUAIL, F.J., SCANLON, T.J., STICKLAND, M.T. : “Rapid Manufacturing Technique used in the Development of a Regenerative Pump Impeller”- Proceedings of World Congress On Engineering - London (2009)
(ii) QUAIL, F,J. : - PhD Thesis - “ Design optimisation of a regenerative pump using numerical and experimental techniques” - University Of Strathclyde - (2009)
RAHEEL, M., ENGEDA, A. : “Systematic design approach for radial blade regenerative turbomachines” Journal for Propulsion and Power Vol. 21 (2005)
SHIH, T.H., LIOU, W.W., SHABBIR, A., YANG, Z., and ZHU, J. :, “A New k- Eddy-Viscosity Models for High Reynolds Number Turbulent Flows-Model Development and Validation”, Computers Fluids, 24 (3), pp. 227-238. (1995) SIXSMITH, H., ALTMANN, H.,“A Regenerative Compressor” Trans ASME Vol 99pp 637-647 (1977)
SONG, J. W., ENGEDA, A., CHUNG, M.K. :“Modified theory for the flow mechanism in a regenerative flow pump” Proceedings IMECHE, Vol 217 (2003) Power and Energy
SPALART, P.,“Trends in turbulence treatments” .AIAA paper (AIAA 2000-2306) (2000)
WILSON, W.A., SANTALO, M.A., OELRICH, J.A. : “A Theory of the fluid dynamic mechanism of regenerative pumps” Trans. ASME Vol 77 PP1303-1316 (1955)
WOOLATT, G., LIPPETT, D., IVEY, P.C., TIMMIS, P., and CHARNLEY, B.A, “The Design, Development and Evaluation of 3d Aerofoils for High Speed Axial Compressors, Part 2: Simulation and Comparison with Experiment”, ASME TURBOEXPO, Paper GT-2005-Nevada. (2005)
OUTLET INLET