Elements of Urban Form
Nicola Dempsey, Caroline Brown, Shibu Raman, Sergio Porta, Mike Jenks, Colin Jones and Glen Bramley
Introduction
This chapter provides a common platform for the research presented in this book and is divided into two parts. The first section examines the elements of urban form identified for the purposes of the research and explains how they were measured. The second section profiles the five case study cities and fifteen case neighbourhoods which were the focus for the empirical research discussed in later chapters. These profiles provide an outline of both the urban form and socio-economic characteristics of the areas studied. The chapter concludes with a review of the urban form features of the case study cities and neighbourhoods, and shows how the different physical elements integrate together with socio-economic characteristics.
Elements of Urban Form
The term ‘urban form’ can be used simply to describe a city’s physical characteristics. At the broad city or regional scale, urban form has been defined as the spatial configuration of fixed elements (Anderson et al., 1996). Features of urban form at this scale would include urban settlement type, such as a market town, central business district or suburbs. However, urban form is closely related to scale and has been described as the ‘morphological attributes of an urban area at all scales’ (Williams et al., 2000). Characteristics therefore range from, at a very localized scale, features such as building materials, façades and fenestration, to, at a broader scale, housing type, street type and their spatial arrangement, or layout.
It should be noted that urban form does not simply relate to physical features, but also encompasses non-physical aspects. One can see this in the example of density. Simply put, density is used as a measure of the number of people living in a
N. Dempsey (B)
Oxford Institute for Sustainable Development, Oxford Brookes University, Oxford, UK
21 M. Jenks, C. Jones (eds.), Dimensions of the Sustainable City, Future City 2,
given area: it is not just a physical, tangible element. Density is also closely linked with the configuration of the social environment and interaction within residential neighbourhoods: flats and apartments are examples of high-density housing whereas detached and semi-detached properties tend to be of lower densities. There are therefore non-physical economic, social and political processes in place which are physically manifested in housing, schools, parks and other services and facilities.
The scales at which urban form can be considered or measured include the individual building, street, urban block, neighbourhood and city. These levels of spatial disaggregation influence how urban form is measured, analyzed and ultimately understood. The issue of scale is discussed throughout this chapter (and the book) as it constitutes an underlying dimension of any examination of urban form.
[image:2.439.168.383.272.496.2]Urban form generally encompasses a number of physical features and non-physical characteristics including size, shape, scale, density, land uses, building types, urban block layout and distribution of green space. These are categorised here as five broad and inter-related elements that make up urban form in a given city (Fig. 2.1).
Transport Infra-structure
Land Use Layout Housing/
Building Type Density
Urban Form
Fig. 2.1 Elements of
urban form
Density
Density is a deceptively complex concept with a number of inter-related dimensions. While it may provide an objective, spatially-based, measure of the number of people (living) in a given area, it is also assessed subjectively; it is a social interpretation dependent on individual characteristics and so may differ from resident to resident (Churchman, 1999). For example, while the density of Trafalgar Square in London may be reported as low (density usually being a measure of residential occupancy), the perceived density, and extent of crowding, may be very high (after Rapoport, 1975).
Density entered the consciousness of UK policy makers in the nineteenth century when urban areas were growing rapidly and overcrowding and appalling living conditions were prevalent among the poor (Jenks and Dempsey, 2005). There is also a more cultural dimension to density, where the densities at which people live may be considered as relative. Current English housing policy states that new residential building should be at a minimum of 30 dwellings/ha which for some may be an unacceptably high density (DCLG, 2006). In Hong Kong however, a minimum of ten times that density would be considered low (after Jenks, 2000; Breheny, 1997; Jenks and Dempsey, 2005).
Density is also closely associated with other elements of urban form, such as land use and access to services – for example, for a service or facility to be viable, it needs to serve a population of a particular size. Density on the one hand can be seen as an outcome of the competition between land uses within a given urban transport infrastructure and its associated pattern of accessibility. On the other hand it is a policy goal as it is also an input into the quality of urban life through the viability of services provision and availability of public and private space. Density has therefore been used as a tool to measure the viability of public transport infrastructure and other service provision, the feasibility of certain land uses, particularly commercial and service, in urban design and construction. At what point density becomes high (or too high) is unclear, but in recent years planning policy and practices in many countries have been attempting to increase the average density of new development.
Land Use
areas (Healey, 1997). Planners have traditionally attempted to separate land uses because of potential undesirable externalities but are now in favour of mixed use developments. For example current UK policy promotes easily accessible services and facilities for residents (DCLG, 2006); both ‘horizontally’ – at ground floor level – and, increasingly in new city centre developments, ‘vertically’ – within the same building (DETR, 2000). However, land use patterns are dynamic rather than static phenomena and are subject to real estate market forces.
A key component of local land use is the availability of local neighbourhood services. The provision of services and facilities is dependent on the resident population’s requirements so a particular land use mix therefore differs from neighbourhood to neighbourhood (Urban Task Force, 1999). The local urban context and the requirements of the population are therefore important in this matter. It is not however clear which services and facilities can and should be provided at which spatial scale. An ‘everyday eight’ local neighbourhood services and facilities identified by Winter and Farthing in the UK context includes post office, supermarket, primary school, newsagent and open space (1997, p. 127). Other services to which residents need local access, albeit on a less frequent basis, include a doctor’s surgery (Barton et al., 2003; Urban Task Force, 1999), chemist; bank (Burton, 1997); and community centre (Aldous, 1992). There is extensive prescriptive UK guidance on what those land uses should be for a given neighbourhood however there is no consensus (Dempsey, 2008).
Accessibility and Transport Infrastructure
Transport infrastructure is closely associated with accessibility as it determines the ease with which buildings, spaces and places can be reached. The level of accessibility describes the area residents and users are able to reach, as well as the extent to which they have the means to access places, services and facilities that are outside their local area (after Talen, 2003).
Urban Layout
Layout describes the spatial arrangement and configuration of elements of streets, blocks and buildings, often referred to at the street scale, such as grid or tree-like (cul-de-sac) street patterns. Layout has an important influence on pedestrian movement and the way in which different places and spaces are connected to each other (ODPM, 2005; CABE and DETR, 2000). The layout, whether or not it is ‘permeable’ and easy to find the way, controls access and movement for pedestrians, and could influence other aspects of urban form such as land use or density (Hillier and Hanson, 1984; Hillier, 1996).
The layouts of today’s cities are largely artifacts of their historical development and planning and building regulations. The configuration of the street network, in terms of its urban block sizes, their overall location within the city, pedestrian and vehicular connectivity, can affect the functioning of a city by, for example, influencing the location intensity of activities (Penn et al., 1998; Porta et al., 2008). The connectedness and permeability of urban layouts are claimed to determine the nature and extent of routes between and through spaces which in turn has an influence on how lively and well-used a space is (Cowan, 1997). Streets which are well-connected to services, facilities etc. and/or the means for the pedestrian of reaching them, are argued to be more frequently used than deserted or quiet options (Gehl, 2001; Gehl et al., 2004).
Housing and Building Characteristics
The characteristics of housing and other buildings in urban settlements can have an important bearing on everyday living: it has already been noted that residents living in low-density detached dwellings with large gardens will have a distinct experience of the urban environment from high-rise city centre apartment dwellers. However, the influence of building characteristics extends beyond the density of urban living. Factors such as building type, height and age may have an effect on a number of issues. These might include a building’s orientation and exposure to sunlight and daylight (Mardaljevic, 2005) and the potential for modifications, such as changes to living space to work space or individual room conversion to continue accommodating an ageing resident as in the ‘lifetime homes’ model (Holmes, 2007). Other factors such as the amount of living space in dwellings, number and types of particular rooms and lowest level of living space may also have significant influences on the efficiency of buildings in terms of its embodied, operating and life cycle energy (Newton et al., 2000).
Integrated Elements
uses within. A neighbourhood is not accessible without viable services and facilities available for residents to use. Neither is it accessible without pedestrian, cycling and public transport networks through which the neighbourhood is connected both to its own services and to services outside. When planning and constructing new residential areas, housing type and size may be dictated by the proposed density of a site, which for example, in line with recent UK policy, will also provide a range of land uses (including different services and facilities and open space) and a connected and permeable urban layout. This message is endorsed by a series of US studies that have sought to develop measures of urban sprawl (Ewing et al., 2002; Cutsinger et al., 2004).
The interrelated associations between these elements have wide-reaching implications for the research. Firstly, there is a need for compatibility in how the different elements of urban form are measured. This is to ensure that, secondly, the statistical (and other) analyses conducted can account for the individual effect that each element may have on a particular aspect of sustainability, as well as the collective influence of the elements of urban form. In this way, the main research question which looks to explain how urban form affects sustainability can be answered in as robust and reliable a manner possible. The next section examines outlines the methodological approach used in the research to measure these elements of urban form.
Measuring Urban Form
A largely quantitative approach was adopted in this research, although qualitative methods were used in parts of the project and are detailed in the relevant chapters. To measure robustly the features of urban form outlined above, a two-pronged process of data collection was followed. Firstly, existing datasets such as the 2001 Census, the Valuation Roll and Ordnance Survey data were examined to provide information on, for example, initial density measures, non-domestic properties and their location. Secondly, after ascertaining gaps in the data, e.g. building heights and information on transport infrastructure (e.g. bus stop location and type of car parking), a site survey was conducted in the study neighbourhoods on a street-by-street basis.
The site surveys were undertaken by researchers using an innovative method employing PDAs (personal digital assistants) with GPS (global positioning system) modules which allowed geocoded survey data to be directly downloaded into a GIS (geographic information system) platform. A useful innovation was the production of prototype software to automatically link separately sourced data tables from Ordnance Survey and Valuation Data. This allowed site surveyors easily to identify, locate and check business and mixed use premises. The data collected in this way included details about: buildings such as condition and height; land uses; the presence of litter and graffiti; position of bus stops and shelters.
over time, it offers new and valuable data on how and to what extent current urban forms in UK cities can be described as sustainable. The following sections outline how each element of urban form was measured in the research.
Measuring Density
A wide range of different measurements have been used to calculate the density of a given area, such as persons per hectare (pph), dwellings per hectare (dph), bed spaces per hectare and habitable rooms per hectare (Woodford et al., 1976). Employing a number of density measures has been argued to be more robust than using one single density indicator which cannot accurately measure the density of a given area (Jenks and Dempsey, 2005).
A range of density indicators was selected to provide as complete a picture as possible of the overall density of the case studies, while accounting for the different scales of urban form (the city, neighbourhood, ‘sub-area’ and street). Examples of these indicators are presented in Table 2.1. It should be noted that the indicators of net residential density used here are based on a definition of residential which includes outdoor space such as gardens, but excludes streets and footpaths. This method of calculation results in density figures which are higher than those usually reported.
It is clear from the table that the indicators measure physical density and not perceived density. Aspects of perceived density are measured in Chapters 9.
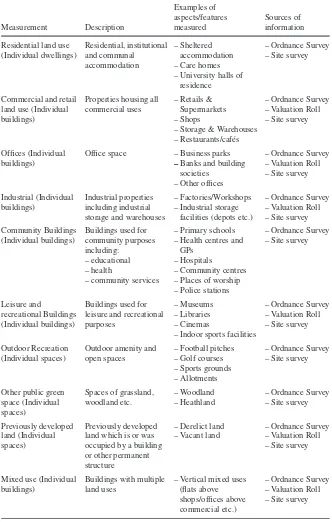
Measuring Land Use
In order to measure the extent of mixed land uses in the case study neighbourhoods, a number of appropriate land uses were selected, excluding land uses which are not relevant for the purposes of the research, e.g. telecommunications, energy and waste infrastructure. Data on a number of particular services and facilities are not always specified in secondary data sources (e.g. name of supermarket, newsagent and children’s nursery), indicating a need to conduct primary data collection.
Table 2.1 Indicators of density Measurement Description Examples of aspects/features measured Sources of information
Gross Density (City) The ratio of persons, households, or dwelling units to the entire area of the city regardless of land use.
– Total city population – No. of households – No. of dwellings – City area
– Census data – Local authorities
Gross Density (Neighbourhood)
Number of persons, households, or dwelling units per hectare of the total neighbourhood area.
– Total population – No. of households – No. of dwellings – Case study area
– Census data – Local authorities – Valuation Roll – Ordnance Survey
Gross Residential Density (Sub-area)
Number of persons, households, or dwelling units per hectare of the total sub-area area.
– Total population – No. of households – No. of dwellings – Sub-area
– Census data – Valuation Roll – Ordnance Survey
Net Residential Density (Neighbourhood)
Number of persons, households or dwellings per hectare of the total land area devoted to residential land use.
– Total population – No. of households – No. of dwellings – Total residential
land area
– Census data – Ordnance Survey
Net Residential Density (Sub-area)
Number of persons, households or dwellings per hectare of the total land area devoted to residential land use within the sub-area.
– Total population – No. of households – No. of dwellings – Total residential
land area
– Census data – Ordnance Survey – Valuation Roll
Net Residential Density (Street & Plot)
Number of dwellings per plot.
– No. of dwellings per plot
– Plot area
– Ordnance Survey
Floor Area Ratio (Neighbourhood & Sub-area)
Ratio of floor area to site area.
– Floor area (of each building)
– No. of storeys – Site area (of each plot)
– Ordnance Survey – Site survey
Coverage Ratio (Neighbourhood & Sub-area)
Ratio of building footprint to site area.
– Building footprint (each building) – Site area (of each plot)
– Ordnance Survey
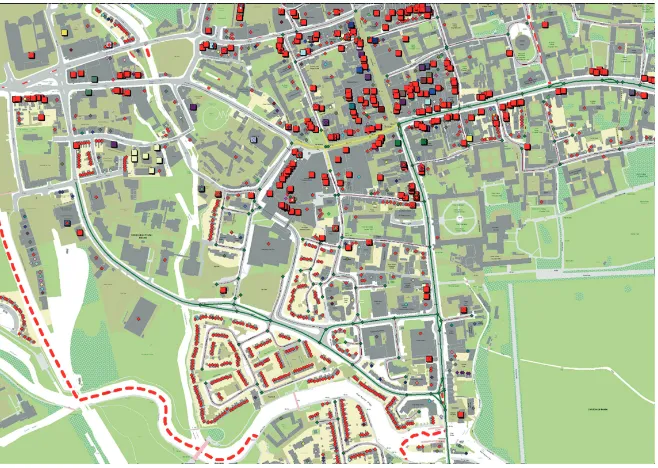
Measuring Accessibility and Transport Infrastructure
Fig. 2.2 Example of GIS-generated land use map (Oxford) (© Ordnance Survey)
characteristics of public transport infrastructure and journey times and distances. These indicators (and others such as socio-economic characteristics of residents and employment location) were included in a transport model (discussed in detail in Chapter 3) to provide as accurate a picture of accessibility in the case study neighbourhoods.
Measuring Housing/Building Characteristics
It is not possible or desirable to measure the characteristics of every building in the case study neighbourhoods. An efficient method of measuring the characteristics involves the identification of predominant housing types per street, and highlighting where there were exceptions to this. It is also useful to make use of the household questionnaire in measuring these characteristics. While the focus of the questionnaire is to measure aspects of sustainability, it proved to be a useful tool to collect urban form indicators, such as housing type, lowest level of living accommodation and a household’s access to a garden/residential outdoor space.
Table 2.2 Indicators of land use Measurement Description Examples of aspects/features measured Sources of information
Residential land use (Individual dwellings) Residential, institutional and communal accommodation – Sheltered accommodation – Care homes – University halls of
residence
– Ordnance Survey – Site survey
Commercial and retail land use (Individual buildings)
Properties housing all commercial uses
– Retails & Supermarkets – Shops
– Storage & Warehouses – Restaurants/cafés
– Ordnance Survey – Valuation Roll – Site survey
Offices (Individual buildings)
Office space – Business parks
– Banks and building
societies – Other offices
– Ordnance Survey – Valuation Roll – Site survey
Industrial (Individual buildings)
Industrial properties including industrial storage and warehouses
– Factories/Workshops – Industrial storage
facilities (depots etc.)
– Ordnance Survey – Valuation Roll – Site survey Community Buildings
(Individual buildings)
Buildings used for community purposes including:
– educational – health
– community services
– Primary schools – Health centres and
GPs – Hospitals
– Community centres – Places of worship – Police stations
– Ordnance Survey – Site survey
Leisure and
recreational Buildings (Individual buildings)
Buildings used for leisure and recreational purposes
– Museums – Libraries – Cinemas
– Indoor sports facilities
– Ordnance Survey – Valuation Roll – Site survey
Outdoor Recreation (Individual spaces)
Outdoor amenity and open spaces
– Football pitches – Golf courses – Sports grounds – Allotments
– Ordnance Survey – Site survey
Other public green space (Individual spaces)
Spaces of grassland, woodland etc.
– Woodland – Heathland
– Ordnance Survey – Site survey
Previously developed land (Individual spaces)
Previously developed land which is or was occupied by a building or other permanent structure
– Derelict land – Vacant land
– Ordnance Survey – Valuation Roll – Site survey
Mixed use (Individual buildings)
Buildings with multiple land uses
– Vertical mixed uses (flats above shops/offices above commercial etc.)
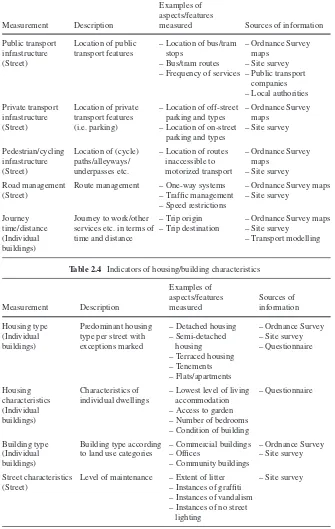
Table 2.3 Indicators of accessibility
Measurement Description
Examples of aspects/features
measured Sources of information
Public transport infrastructure (Street)
Location of public transport features
– Location of bus/tram stops
– Bus/tram routes – Frequency of services
– Ordnance Survey maps
– Site survey – Public transport
companies – Local authorities Private transport
infrastructure (Street)
Location of private transport features (i.e. parking)
– Location of off-street parking and types – Location of on-street
parking and types
– Ordnance Survey maps
– Site survey
Pedestrian/cycling infrastructure (Street)
Location of (cycle) paths/alleyways/ underpasses etc.
– Location of routes inaccessible to motorized transport
– Ordnance Survey maps
– Site survey Road management
(Street)
Route management – One-way systems – Traffic management – Speed restrictions
– Ordnance Survey maps – Site survey
Journey time/distance (Individual buildings)
Journey to work/other services etc. in terms of time and distance
– Trip origin – Trip destination
– Ordnance Survey maps – Site survey
[image:11.439.55.385.343.602.2]– Transport modelling
Table 2.4 Indicators of housing/building characteristics
Measurement Description Examples of aspects/features measured Sources of information Housing type (Individual buildings) Predominant housing type per street with exceptions marked
– Detached housing – Semi-detached
housing – Terraced housing – Tenements – Flats/apartments
– Ordnance Survey – Site survey – Questionnaire Housing characteristics (Individual buildings) Characteristics of individual dwellings
– Lowest level of living accommodation – Access to garden – Number of bedrooms – Condition of building
– Questionnaire
Building type (Individual buildings)
Building type according to land use categories
– Commercial buildings – Offices
– Community buildings
– Ordnance Survey – Site survey
Street characteristics (Street)
Level of maintenance – Extent of litter – Instances of graffiti – Instances of vandalism – Instances of no street
lighting
Measuring Layout
Urban layouts are difficult to quantify. Spatial network analysis is one of the ways in which spatial layouts can be objectively described and quantified to identify similarities or differences. Typically in a spatial network analysis, relationships between spaces in a city/settlement/building are represented as relational graphs similar to social network graphs. These graphs can then be analyzed to identify patterns and to quantify the relationships between spaces.
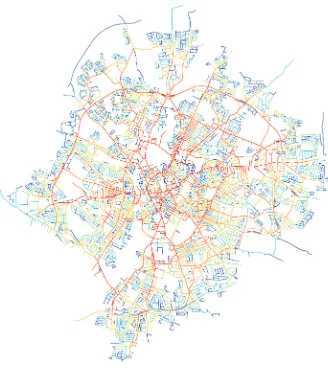
For this research, Multiple Centrality Assessment (MCA) is employed to measure layout (see Porta et al., 2006). MCA operates on a standard (or primal) graph representation based on street network systems which accounts for metric distances while analyzing the relationship between spaces. The final output provides a set of simple and compound measures of centrality numerically expressing the relative importance of a space in relationship to other spaces in the city. The output also includes a network map that shows the location and clustering patterns of spatial centrality (Fig. 2.3). A more detailed description of MCA and a table of the indicators employed to measure urban layout can be found in Appendix 1.
Measuring Overview
The elements of urban form link the constituent and distinct parts of this research together. This is the first time empirical research has examined the effect that urban form has on sustainability in a holistic manner. Indicators employed to measure urban form include both simple and complex measures collected or derived from secondary sources, primary data collection or detailed computer modelling. The range of indicators described above allows us to determine the relative influence that differing elements of urban form – land use, density, accessibility, housing/building characteristics and layout – have on economic, environmental and social sustainability.
The relationships that the elements of urban form, both individually and as a whole, have on the different aspects of sustainability are analyzed and outlined later in the book. The next section describes the case studies in detail and outlines the features of urban form in each area.
Case Study Areas: Profiles
Fig. 2.3 Example of an MCA-generated map of Leicester
Case Study Cities
General Characteristics of the Five Cities
Glasgow and Sheffield are the largest of the cities, with populations of more than 500,000. They are both traditional industrial cities that grew dramatically in the nineteenth century and now have important commercial roles. Edinburgh is the next largest with a total population of approximately 450,000 and is one of the few large provincial cities in the UK whose population is growing. It is the capital of Scotland and an important administrative and financial services centre. Both Leicester and Oxford are significantly smaller; Leicester with a population of 280,000 and Oxford with a population of 134,000. Leicester has quite a diverse economic structure and a thriving ethnic minority community that accounts for more than a third of its population. Oxford is most well-known as a university city, but is also a thriving tourist and business centre.
Demographically, the five cities tend to have a younger than average population with a high proportion of people in their twenties. This may be linked to their status as university towns, with the effects most noticeable in Oxford where one quarter of local people are aged between 20 and 29 and the average age of Oxford residents is 35 years 4 months. The most affluent of the five cities are Edinburgh and Oxford and they also have the highest proportion of young adults. Glasgow and Sheffield residents tend to be slightly older (38 and 39 years respectively), while Leicester has the youngest population profile with an average age of 35 years – more than 3 years younger than the UK average.
All of the case study cities – with the exception of Edinburgh – have a lower proportion of owner occupiers than the UK average (70%). Sheffield has the lowest proportion of private renters (10%), while in Oxford almost a quarter of households are private renters. Social renting on the other hand is most prevalent in Glasgow, where 40% of households have a social landlord, while just over one in six households in Edinburgh are in this situation.
Driving to work by car or van is the most popular mode of travel in all five cities with more than half of commuters using a car in Leicester and Sheffield. Glasgow is the only one to have an underground system and 4% use it while Sheffield has a tram network which attracts 3% of commuters. More than a quarter use the bus in Edinburgh but the city with the highest proportion of commuters using (all types of) public transport is Glasgow. Another notable difference is the high percentage, 15%, of people who travel to work on bicycle in Oxford, which is much higher than the other four cities (3% in Edinburgh).
Some Physical Characteristics of the Five Cities
Table 2.5 Density and housing types: case study cities
Density Housing types (%)
People per Dwellings Semi- Flats/ City hectare per hectare Detached detached Terraced apartments
Edinburgh 17.1 8.2 11 14 15 60
Glasgow 33.1 16.1 3 13 13 70
Leicester 38.3 15.8 10 37 36 17
Oxford 29.5 11.5 10 32 31 27
Sheffield 14.0 6.1 14 37 30 18
Source: Census 2001
populated city of the five, both in persons per hectare and dwellings per hectare. Leicester has the greatest number of persons per hectare and Glasgow has the greatest number of dwellings per hectare. Edinburgh has a comparably low density, similar to that of Sheffield. These statistics also show that there is no clear divide between England and Scotland despite the distinctive tenemented housing stock prevalent in both Scottish cities. Edinburgh and Glasgow both have much higher numbers of flats than the English cities with around 60% and 70% of households living in flats in these two cities. However, there are differences between the English and Scottish cities studied in the number of rooms per dwelling. The English cities all had an average of more than 5 compared with 4 in Glasgow and 4.6 in Edinburgh. As Table 2.5 shows the densities of these cities range from 29 to 38 persons per hectare which places them at the lower end of the international spectrum of urban densities but much higher than most North American cities. The densities are at the low end of the range of densities of European cities and substantially below the densities of Asian cities that are typically over 200 people per hectare (Bertaud, 2003).
Case Study Neighbourhoods
The starting point for the empirical research is the neighbourhood and fifteen case studies were chosen to represent inner, between and outer neighbourhoods within the five cities. The case study neighbourhoods are chosen to provide a slice through each of the cities and to represent a wide range of neighbourhoods. The overview of these neighbourhood characteristics also provides a useful insight into the spatial socio/demographic and housing stock structure of (British) cities.
reflect relative homogeneity of urban form within their boundaries. Each case study neighbourhood is divided into 6–7 sub-neighbourhoods, giving a set of 97 in total (a few of which contain only a small number of households, because they are dominated by non-residential land uses).
Characteristics of Neighbourhoods
A range of information was collected about the case study neighbourhoods. This includes a site survey capturing information about the built environment and a questionnaire survey providing information about household characteristics, behaviour, feelings about the neighbourhood and use of local facilities (e.g. parks, shops, public transport). An overview of the 15 neighbourhoods is profiled at the end of this chapter (Table 2.6), and more details on individual localities are included in Appendix 2.
At one level these areas represent a set of diverse neighbourhoods but a number of regularities can also be discerned. Gross population densities follow a negative gradient spatial structure from inner to outer neighbourhood. There are also consistent spatial demographic patterns: younger people with few children living in inner areas and older households and families predominating in outer areas. Between areas are more diverse. Private rented housing is focused in the inner areas and outer areas are almost exclusively owner occupied. Social housing in British cities is spatially concentrated, and this is reflected in our case study areas, being located mainly in a few inner areas. These findings show the spatial structure of the five cities, as given by the characteristics of the case study areas, conform to an urban system diffusing from a central core, and that the different physical urban form elements integrate together with socio-economic characteristics.
Layouts of Neighbourhoods
The spatial analysis is carried out at the city level, neighbourhood, sub-area and street level. Most of the comparative analysis to determine the performance of various types of urban form is at the neighbourhood and sub-area level. The spatial characteristics of the neighbourhoods reveal a range of layout types ranging from the predominantly gridded to those that are largely culs-de-sac. The characteristics are quantified using MCA analysis as it permits the calculation of many indices that measure street networks and allow systematic comparison of the case study neighbourhoods (see Appendix 1 for details). There are measurable differences between the neighbourhoods and none can be said to represent one layout type or another, as all have a complex mixture of layout forms (Fig. 2.5).
Fig. 2.5 Shows the spectrum of complexity index scores across the fifteen neighbourhoods. Lower
values indicate higher choice-grid like pattern that are predominantly in inner neighbourhoods and higher values indicate low choice-tree like pattern in the suburbs. (light blue=suburban; medium
blue=between; dark blue=inner city)
dimension index ranges from 1 to 2 – a score of 1 would be a perfect linear system where intersections lie on a straight line, while a score of 2 would be a system where intersections are distributed evenly throughout the space covering the whole neighbourhood. The range in the neighbourhoods from a more compact form in Sheffield inner area to the sprawling layout of Glasgow outer has a relatively narrow spread of values is again due to the fact that many case study areas have both compact and spread areas within them (Fig. 2.6).
Compact layout: Sheffield Inner Sprawling layout: Glasgow Outer
Fig. 2.6 Examples of compact and sprawling neighbourhoods
Summary and Conclusions
[image:18.439.55.386.332.476.2]to quantify urban form using complicated measures and advanced statistical techniques the findings of these studies have emphasised the overlapping nature of the elements and the results have not justified the complexity. The study has chosen in general to apply as simple measures as possible as the best way to elucidate the issues on sustainability. The analysis reported in this book is based on five cities in the UK. The urban form characteristics of these cities in terms of population density are very similar within the spectrum of world cities. These densities are at the low end of the range of densities of European cities and substantially below the densities of Asian cities.
The fifteen case study neighbourhoods selected for deeper study and located at inner, middle and outer points to represent slices through each of the five cities. There are a number of pointers that arise from the various measures of the elements of urban form of these neighbourhoods:
• The inner neighbourhoods tend to be well connected and complex, with predominately grid-like structures;
• The inner neighbourhoods tend to have more compact layouts in comparison with suburban neighbourhoods;
• The suburban neighbourhoods have tree-like structures with a single or limited number of main roads acting as a spine or trunk with culs-de-sac;
• The gross population densities also follow a similar spatial structure; a broadly consistent negative gradient from the city centre;
• There are consistent spatial demographic patterns: younger people with few children living in inner neighbourhoods and older households and families predominating in outer neighbourhoods. Between neighbourhoods are more diverse.
• Private rented housing is focused in the inner neighbourhoods and outer neighbourhoods are almost exclusively owner occupied.
• Social housing in British cities is spatially concentrated, and this is reflected in our case study areas, being located mainly in a few inner neighbourhoods.
Table 2.6 Profile of the case study neighbourhoods
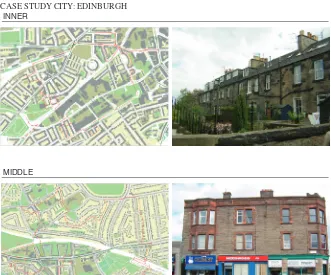
CASE STUDY CITY: EDINBURGH
INNER
MIDDLE
Table 2.6 (continued)
INNER
General description Social characteristics and housing A high density neighbourhood dominated by
traditional tenements and modern flats. The area has very little green space and few residential gardens. There is a busy high street with shops and cafes. The area also includes a large hotel, multiplex cinema and associated leisure uses.
The area is home to many single person households, young couples and homes in multiple-occupation (together about 75% of households). Around one-fifth of residents are retired, and there are relatively few families in the area. More than 90% of households live in flats.
Layout is compact with grid and cul-de-sac form.
Just over half of homes here are owner occupied and one quarter privately rented. 20% of local stock is social rented. MIDDLE
General description Social characteristics and housing Much of the area is characterized by post-war
housing: detached and semi-detached homes with gardens. Flats, some of them built recently, occur in parts of the neighbourhood. The area lies to the north of the city centre and is bisected by a major road and railway line. A large supermarket, car park, cemetery and school dominate one part of the area.
Layout is predominantly gridded, not orthogonal.
Almost 40% of residents in this area are retired, and around 15% of households include children. Half of homes in this area are flats, and the other half are a fairly even mixture of detached, semi-detached and terraced houses.Two-thirds of these homes are owner occupied and less than one-tenth are privately rented. Social renting accounts for around 17% of the stock.
OUTER
General description Social characteristics and housing A largely residential area, dominated by
detached and semi-detached houses with private gardens. The area includes part of a university campus and is bisected by a major arterial road. This road functions as a local high street with a variety of shops and services. It is extremely busy with vehicular traffic, but provides easy access to bus services.
A large proportion of residents in this area are retired (40%) and almost one-quarter of households include children. Around one-third of homes are detached and one-third are semi-detached. Flats account for 17% of stock and terraced houses 11% of local homes. Almost all homes in this area are owner-occupied (97%).
Table 2.6 (continued)
CASE STUDY CITY: GLASGOW
INNER
MIDDLE
[image:22.439.54.388.72.381.2]Table 2.6 (continued)
INNER
General description Social characteristics and housing A very diverse area, including city centre
shops, bar, restaurants, cultural facilities and a least one large open space.
Residential uses are spread unevenly across the area, with pockets of high density flats – including student accommodation – in some parts. Not all parts of the area are doing well, and there are derelict buildings and underused sites. Residents here have very little private green space.
Layout is deformed compact grid.
The area is home to many single person households, young couples and homes in multiple-occupation (together about 87% of households). Very few families live in this part of the city, and one-tenth of residents are retired. More than 90% of households live in flats.
Almost 60% of homes here are owner occupied and one quarter privately rented. 16% of local stock is social rented.
MIDDLE
General description Social characteristics and housing The area has two distinct parts. One part is
very low density, with large houses (some subdivided into flats) set in large gardens and leafy streets. The other part has tenement flats, shops and a greater mix of uses. A local park contributes to the leafy feel.
Layout is a deformed grid with some compact grids.
Around one third of residents in this area are retired and almost one-quarter of households include children. Around 80% of households are living in flats. Most of the other homes in the area are terraced or semi-detached.
86% of homes here are owner occupied and only a very small proportion of housing is privately rented. Social renting accounts for around 6% of the stock.
OUTER
General description Social characteristics and housing Close to the edge of the city, this area is
bordered by farmland and has a river running through it. Many of the houses are semi-detached with private gardens and many families live in this area. Part of the area includes an industrial estate and a school.
Layout is clustered dispersed culs-de-sac.
Just over one quarter of residents in this area are retired and around one-third of households include children. Around 40% of homes are semi-detached and the rest are evenly divided between flats, terraced houses and detached homes.
Table 2.6 (continued)
CASE STUDY CITY: LEICESTER
INNER
MIDDLE
[image:24.439.54.387.62.564.2]Table 2.6 (continued)
INNER
General description Social characteristics and housing A very diverse area, including the city
hospital, museum, art gallery and university campus. Residential uses are unevenly spread, with pockets of high-density flats and student accommodation. There is little private green space here, although there are some public open spaces. A significant proportion of residents are non-white; and there is a high number of single person households.
In terms of layout, the area has a deformed wheel, radial pattern.
The area is home to many single person households, young couples and homes in multiple occupation (together about 80% of households). There are relatively few families in the area and around 15% of residents are retired. This area is notable for its high level of unemployment (13%). Just under 90% of households live in flats.
Only one-fifth of homes here are owner occupied and one quarter privately rented. More than half of homes in this area are social rented.
MIDDLE
General description Social characteristics and housing This part of the city is dominated by terraced
housing. It is close to the university and has a significant proportion of private rented properties. Some parts of the area are slightly lower density with semi-detached houses, and there are some flats. A significant proportion of local residents are non-white.
In terms of layout, the area has a deformed grid.
Around two thirds of homes in this area are terraced, and just over 10% are flats.
74% of homes here are owner-occupied and one quarter are privately rented.
OUTER
General description Social characteristics and housing Residential density is low in this part of the
city. Detached and semi-detached houses with gardens dominate, although there are a few flats in places. There is some public open space, but most residents have access to private gardens.
In terms of layout, the area has a very deformed grid with culs-de-sac
In this area around one third of households are older (one or more adults aged 60+), but only 20% of residents are retired. In most other case study areas the proportion of retired and older households are roughly equal. A quarter of households in this area include children. This area is dominated by semi-detached homes, which account for more than 60% of local housing stock. There are few flats or terraced houses here and almost all the other homes in the area are detached houses.
[image:25.439.50.387.55.587.2]Table 2.6 (continued)
CASE STUDY CITY: OXFORD
INNER
MIDDLE
[image:26.439.55.384.58.538.2]Table 2.6 (continued)
INNER
General description Social characteristics and housing The area includes a high number of
non-residential buildings including university colleges, a library and museum. A significant proportion of residents are single and young, although some families and older people live in the southern part of the area. The proportion of private and public open space varies enormously, with very little private open space in the most central parts.
Layout is in crucifix form, with small blocks at the centre
Around one quarter of residents are retired, and 15% of households include children.
Around one half of homes are flats, and most of the remaining housing stock is terraced, with a very small proportion of detached and semi-detached homes.
Around half of homes here are
owner-occupied and one-third are privately rented.
MIDDLE
General description Social characteristics and housing The area includes a mixture of housing types.
Open spaces include allotments, a cricket ground, a river and private gardens. It is bound to the west by the railway line and a canal runs through the area. A number of non-residential uses include a community centre, hospital and numerous cafes and restaurants. A number of the residential properties are owned by the university.
Layout is an elongated deformed grid with compact grid within.
Around one third of residents in this area are retired and almost one-fifth of households include children. Just under half of homes are terraced and one quarter of households live in flats. Semi-detached homes account for almost all the other houses in the area.
Roughly 60% of homes are owner-occupied and one third are privately rented. Social renting accounts for less than 10% of stock.
OUTER
General description Social characteristics and housing This area is a large housing estate, laid out
with culs-de- sac and a mixture of detached, semi-detached and terraced houses. Density is high for an outer case study area. The area includes a number of public buildings, e.g. school, stadium and business park. There is a mixture of public and private open space, with many of the houses having access to private gardens.
In this area one-fifth of residents are older, and more than one-third of residents are retired. In most other case study areas the proportion of retired and older households are roughly equal. One third of households in this area include children. Just under half of homes in this area are terraced, and the rest are split equally between semi-detached homes and flats.
Layout is predominantly culs-de-sac. Around 40% of homes here are
Table 2.6 (continued)
CASE STUDY CITY: SHEFFIELD
INNER
MIDDLE
[image:28.439.55.386.401.571.2]Table 2.6 (continued)
INNER
General description Social characteristics and housing This part of the city includes a number of
non-residential buildings including: a sports stadium, university buildings, a school, cafes and restaurants. Residential buildings include student accommodation and both high and low-rise blocks of flats. There are also a number of open spaces, including parks and sports fields.
Layout is a deformed compact grid.
Around one quarter of residents are retired and about 15% of households include children. Unemployment is slightly higher here than in other areas (5%).
This area is dominated by flats - around 80% of households living in flats. Most of the other homes in the area are terraced or semi-detached. Just over one-quarter of homes here are owner occupied and almost one-fifth are privately rented. More than half of homes in this area are social rented
MIDDLE
General description Social characteristics and housing A largely residential area with the majority of
residents living in terraced houses. Public open space is concentrated in specific areas, although most houses have some form of private garden. Sheffield’s topography is particularly relevant in this area, with the main road from the city centre lying at the top of a steep hill.
Layout is a deformed compact grid.
Just over one-fifth of residents are retired and 15% of households include children. Around 60% of homes in this area are terraced and the rest are a fairly even mixture of detached, semi-detached and terraced houses.
Three-quarters of homes here are owner-occupied and just under 20% are privately rented. Social renting accounts for around 12% of housing stock.
OUTER
General description Social characteristics and housing This area is on the edge of the city close to
farmland and open countryside. Residential density is fairly low, with many detached and semi-detached houses with large gardens. Non-residential uses are limited and concentrated in specific areas along the bus route. There is a housing estate to the north of the area made up of flats and houses which has access to shared open space.
Layout is curvilinear with culs-de-sac.
Just over 40% of households in this area are older, and one-quarter include children. Just over half of homes in this area are semi-detached and around 30% are detached. The rest of the housing stock is almost all made up of flats.
References
Aldous, T. (1992) Urban Villages: a concept for creating mixed-use urban developments on a
sustainable scale. Urban Villages Group, London.
Anderson, W. P., Kanargoglou, P. S. and Miller, E. (1996) Urban Form, Energy and the Environment: A Review of Issues, Evidence and Policy. Urban Studies, 33, pp. 17–35 Barton, H. (2000) Sustainable Communities: the potential for eco-neighbourhoods, Earthscan,
London.
Barton, H., Grant, M. and Guise, R. (2003) Shaping Neighbourhoods: a guide for health,
sustainability and vitality, Spon Press, London.
Bertauld, A. (2003) Metropolitan Structures around the World, http://alain-bertaud.com/ #B.ComparativeUrbanStructures
Breheny, M. (1997) Urban compaction: feasible and acceptable? Cities, 14(4), pp. 209–217 Burton, E. (1997) The Compact City: just or just compact? Unpublished PhD thesis, Oxford
Brookes University, Oxford.
Churchman, A. (1999) Disentangling the Concept of Density. Journal of Planning Literature,
13(4), pp. 389–411.
Commission for Architecture and the Built Environment and Department of the Environment Transport and the Regions (2000) By Design: urban design in the planning system: towards
better practice, Thomas Telford, London.
Cowan, R. (1997) The Connected City: a new approach to making cities work, Urban Initiatives, London.
Cutsinger, J., Galster, G., Wolman, H., Hanson, R. and Towns, D. (2004) Verifying the
Multi-dimensional Nature of Metropolitan Land Use: Advancing the Understanding and Measurement of Sprawl, Wayne State University, Detroit, Michigan.
Dempsey, N. (2008) Quality of the built environment in urban neighbourhoods, Planning Practice
and Research, 23(2), pp. 249–264.
Department for Communities and Local Government (DCLG) (2006) Planning Policy Statement 3
(PPS3): Housing, DCLG, London.
Department of the Environment Transport and the Regions (DETR) (2000) Planning Policy
Guidance Note 3: housing, DETR, London.
Ewing, R., Pendall, R. and Chen, D. (2002) Measuring Sprawl and its Impact, Smart Growth America, Washington, D.C.
Gehl, J. (2001) Life Between Buildings: using public space, Arkitektens Forlag, Copenhagen. Gehl, J., Gehl, A., Transport for London and Central London Partnership (2004) Towards a Fine
City for People: public spaces and public life - London 2004, Gehl Architects, Copenhagen.
Grant, J. (2002) Mixed Use in Theory and Practice: Canadian experience with implementing a planning principle, Journal of American Planning Association, 68(1), pp. 71–84
Gray, D. E. (2004) Doing Research in the Real World, Sage, London.
Healey, P. (1997) Collaborative Planning: Shaping Places in Fragmented Societies, MacMillan Press Ltd, Basingstoke.
Hillier, B. (1996) Space is the Machine: a configurational theory of architecture, Cambridge University Press, Cambridge.
Hillier, B. and Hanson, J. (1984) The Social Logic of Space, Cambridge University Press, Cambridge.
Holmes, C. (2007) New Opportunities for an Ageing Population, Town and Country Planning,
76(11), pp. 382–384
Jenks, M. (2000) The Acceptability of Urban Intensification. In. Achieving Sustainable Urban
Form, (eds. K. Williams, E. Burton and M. Jenks), E & FN Spon, London, pp. 242–250.
Jenks, M. and Dempsey, N. (2005) The Language and Meaning of Density. In Future Forms and
Design for Sustainable Cities, (eds. M. Jenks and N. Dempsey), Architectural Press, Oxford,
Liu, S. and Zhu, X. (2004) Accessibility analyst: an integrated GIS tool for accessibility analysis in urban transportation planning. Environment and Planning B: Planning and Design, 31(1), pp. 105–124.
Mardaljevic, J. (2005) Quantification of Urban Solar Access. In Future Forms and Design for
Sustainable Cities, (eds. M. Jenks and N. Dempsey), Architectural Press, Oxford, pp. 371–391.
Newton, P., Tucker, S. and Ambrose, M. (2000) Housing Form, Energy Use and Greenhouse Gas Emissions In Achieving Sustainable Urban Form, (eds. K. Williams, E. Burton and M. Jenks), E & FN Spon, London, pp. 74–83.
Office of the Deputy Prime Minister (ODPM) (2003) National Land Use Database (NLUD): Land
Use and Land Cover Classification, HMSO, London.
Office of the Deputy Prime Minister (ODPM) (2005) Sustainable Communities: homes for all, The Stationery Office, Norwich.
Penn, A., Hillier, B., Banister, D. and Xu, J. (1998) Configurational modelling of urban movement networks, Environment and Planning B: Planning and Design, 25(1), pp. 59–84.
Porta, S., Crucitti, P. and Latora, V. (2006) The Network Analysis of Urban Streets: a primal approach, Environment and Planning B: Planning and Design, 33(5), pp. 705–725.
Porta, S., Latora, V., Wang, F., Strano, E., Cardillo, A., Scellato, S., Iacoviello, V. and Messora, R. (2008) Street centrality and densities of retails and services in Bologna, Italy. Environment and
Planning B: Planning and Design, 36(3) pp.450–465.
Rapoport, A. (1975) Toward a Redefinition of Density, Environment and Behavior, 7(2), pp. 133– 158.
Schoon, N. (2001) The Chosen City, Spon Press, London.
Talen, E. (2003) Neighbourhoods as Service Providers: a methodology for evaluating pedestrian access, Environment and Planning B, 30, pp. 181–200
Urban Task Force (1999) Towards an Urban Renaissance, E & F Spon, London.
Williams, K., Burton, E. and Jenks, M. (eds.) (2000) Achieving Sustainable Urban Form,. E & FN Spon, London.
Winter, J. and Farthing, S. (1997) Coordinating Facility Provision and New Housing Development: impacts on car and local facility use. In Evaluating Local Environmental Policy (ed. S. M. Farthing), Avebury, Aldershot, pp. 159–179.
Woodford, G., Williams, K. and Hill, N. (1976) Research Report 6: The Value of Standards for the