City, University of London Institutional Repository
Citation
:
Calitri, R., Pothos, E. M., Tapper, K., Brunstrom, J. M. and Rogers, P. J. (2010). Cognitive biases to healthy and unhealthy food words predict change in BMI. Obesity, 18(12), pp. 2282-2287. doi: 10.1038/oby.2010.78This is the unspecified version of the paper.
This version of the publication may differ from the final published
version.
Permanent repository link: http://openaccess.city.ac.uk/1973/
Link to published version
:
http://dx.doi.org/10.1038/oby.2010.78Copyright and reuse:
City Research Online aims to make research
outputs of City, University of London available to a wider audience.
Copyright and Moral Rights remain with the author(s) and/or copyright
holders. URLs from City Research Online may be freely distributed and
linked to.
City Research Online: http://openaccess.city.ac.uk/ publications@city.ac.uk
Cognitive biases to healthy and unhealthy food words predict change in BMI
Author Note
Dr. Raff Calitri, Dr. Emmanuel M. Pothos, & Dr. Katy Tapper, Department of
Psychology, Swansea University, United Kingdom; Dr. Jeffrey M. Brunstrom & Prof. Peter J.
Rogers, Department of Experimental Psychology, University of Bristol, United Kingdom.
Correspondence concerning this article should be addressed to Raff Calitri, Department
of Psychology, Vivian Tower, Swansea University, Singleton Park, Swansea, SA2 8PP.
Electronic mail: R.Calitri@swansea.ac.uk.
Running head: COGNITIVE FOOD BIASES PREDICT BMI CHANGE
Abstract
The current study explored the predictive value of cognitive biases to food cues (assessed by
emotional Stroop and dot probe tasks) on weight change over a one year period. This was a
longitudinal study with undergraduate students (N=102) living in shared student
accommodation. After controlling for the effects of variables associated with weight (e.g.,
physical activity, stress, restrained eating, external eating, and emotional eating), no effects of
cognitive bias were found with the dot probe. However, for the emotional Stroop, cognitive
bias to unhealthy foods predicted an increase in BMI whereas cognitive bias to healthy foods
was associated with a decrease in BMI. Results parallel findings in substance abuse research;
cognitive biases appear to predict behaviour change. Accordingly, future research should
consider strategies for attentional retraining, encouraging individuals to reorient attention
away from unhealthy eating cues.
Cognitive biases to healthy and unhealthy food words predict change in BMI
A high Body Mass Index (BMI) is associated with a wide range of health problems
(e.g., increased risk of cardiovascular disease, diabetes, cancer and arthritis (1)). A high BMI
usually reflects a sedentary lifestyle and/or unhealthy eating habits (i.e. overeating or a
tendency to eat high calorie foods). A range of variables are associated with overeating and
the consumption of high calorie foods. These include eating style(2), stress(3) and sensitivity
to reward (4). The aim of our research was to consider the role of cognitive biases: can
cognitive biases for food-related information predict changes in BMI?
In the literature on eating pathology, associations between cognitive biases and
behavioural outcomes (i.e., obesity) have already received some attention. Braet & Crombez
(5), for example, found that, compared to normal weight children, obese children displayed a
greater interference effect for food words on a food version of the Stroop task. Likewise,
Soetens & Braet (6) found that overweight adolescents displayed a memory bias for high
caloric foods whereas normal-weight individuals did not. Some investigators have suggested
that there might be a causal role between such cognitive biases and the development and
maintenance of eating pathologies (7-8). A related key question, and the focus of the present
work, is whether food-related cognitive biases can predict changes in weight change (BMI).
To date, this issue has not been addressed in eating research, even though there have
been promising parallel findings regarding other psychopathologies. Cox, Hogan, Kristian,
and Race (9)showed that alcoholic patients in a treatment centre who displayed an increase in
attentional bias during their four weeks of treatment were more likely to relapse three months
later compared to those whose attentional bias remained stable during the four weeks. Cox,
Pothos, and Hosier (10) also found that excessive drinkers with a lower attentional bias for
drinking six months later, when compared to drinkers with a higher attentional bias. Such
encouraging results have led some researchers to pursue cognitive-style interventions, that is,
interventions for a substance abuse problem which work by attempting to reduce
corresponding cognitive biases (11).
In appetite research there have been cross-sectional studies showing how the
magnitude of attentional biases to food-related stimuli differ between individuals who adopt
different eating styles (12-15). Eating styles have typically been measured using the Dutch
Eating Behaviour Questionnaire (DEBQ (2)). For example, Francis et al. (13) reported that
restrained eaters (individuals who restrict their food intake) displayed higher interference on a
food version of the Stroop task than non-restrained eaters. However, attentional biases for
food-related information have been very poor predictors of current BMI (16). This
cognitive-behavioural association (or lack thereof) is in contrast to corresponding research on alcohol
abuse. Accordingly, we consider whether food-related attentional biases will predict future
changes in BMI. Given that eating style, stress, and physical activity are all possible
determinants of BMI change (3, 17) we take account of these factors in assessing the
predictive value of attentional biases for BMI change.
A controversial issue has been how to measure cognitive biases in psychopathology.
Early studies employed the emotional Stroop task, in which slower reaction times for
alcohol-related words relative to neutral words would indicate a processing bias for alcohol-alcohol-related
words and a difficulty in disengaging attention from such words. The dot probe task was
proposed as a better measure in that (in principle) it would separate the effects of initial
orientation and sustained attention (18). Competing stimuli (e.g., a food cue and a neutral
cue) are simultaneously presented side-by-side on a computer screen. After the stimuli
disappear, a dot appears in the location of one of the stimuli and participants are required to
dot when it appears in the attended location. However, the dot probe has not been without
criticism, since inhibition of return effects often confound the interpretation of dot probe
results (19) - indeed, many laboratories today employ the dot probe in conjunction with eye
tracking.
Research into attentional or cognitive biases to food-related information has routinely
employed either the dot probe (12) or the emotional Stroop(20). One may question whether
the emotional Stroop and the dot probe are capturing the same underlying construct or reflect
different aspects of food related information processing. Empirical evidence supports the
latter possibility. Johansson, Ghaderi, and Andersson (14) found that participants classified as
high versus low external eaters (i.e., those who have a strong versus a weak tendency,
respectively, to noticing food cues) exhibited different patterns of attentional bias for food
words (respectively directing attention away or toward cues) on a dot probe but showed no
differences in cognitive bias captured by the emotional Stroop. Furthermore, Pothos, Calitri,
Tapper, Brunstrom, & Rogers (21) have reported very low correlations between food versions
of the Stroop and dot probe tasks.
Given that the Stroop and dot probe are likely to measure different aspects of
cognitive bias it becomes difficult to decide on the most appropriate tool to employ. The
emotional Stroop has been the only measure to demonstrate predictive ability with respect to
behaviour change in excessive drinking (9-10). Moreover, its widespread adoption
particularly in the addiction literature has led to a good understanding of the factors which
may affect participants’ performance (22, 23). Equally, the dot probe has been a commonly
used alternative to assess more specific aspects of attentional biases related to substance
abuse or related behaviours. Relevant research does not recommend suitable alternatives.
Accordingly, we adopted an exploratory approach and tested participants with food versions
Method
Pilot Phase
A pilot study was conducted using 25 participants (19 female, 6 male, Mage = 21 years, SD =
4). The purpose of the pilot was two-fold. Firstly, we sought to identify suitable healthy and
unhealthy food words and appropriate control words for inclusion into the cognitive bias
measures. Secondly, we wanted to establish important psycholinguistic information about the
candidate words so that we could match the food and control words. Using the MRC
Psycholinguistic Database, potential food and office (control) words were matched according
to their length, Kucera-Francis written frequency, and number of syllables. A questionnaire
was generated and the shortlisted matched food and office words were individually rated on
their familiarity (participants expressed agreement with the statement: “this word is familiar
to me”: 1= strongly disagree, 6= strongly agree); whether the word belonged to the category
of “things found in the office” (participants expressed agreement with the statement: “this
word belongs to the category of things found in the office”: 1= strongly disagree, 6= strongly
agree); and whether the word belonged to the category of “food” (participants expressed
agreement with the statement: “this word belongs to the category of food”: 1= strongly
disagree, 6= strongly agree). Subsequently, participants judged each food word and decided
whether people in general think the food is healthy or unhealthy (-3= very unhealthy, 0=
neither unhealthy or healthy, +3= very healthy). Participants also rated the valence of the
category of “things found in the office” (-3= very negative, 0= neither negative or positive,
+3= very positive). Office words were rated as neutral. An equal number of healthy and
unhealthy foods were selected (see Appendix for stimuli).
We made the decision to distinguish between healthy and unhealthy foods as it was
increases in BMI. Intuitively, diets high in fruits and vegetables and low fat proteins such as
fish and lentils are likely to be associated with lower BMIs than diets high in saturated fats
and sugars, such as cakes and kebabs. We recognise that some of our unhealthy items might
be potentially categorised as ‘healthy’ foods depending upon the constituent ingredients. For
example, kebabs or pizzas could have a high vegetable concentration and be low (or
relatively low) in fats and sugars. However, as far as our sample was concerned these items
provided clear examples of unhealthy foods.
Phase 1
Participants and procedure
One hundred and fifty one, first year students from a UK University (88 female, 63
male; Mage=19 years, SD=1), who identified themselves as living in shared student
accommodation, native English speakers, and not colour-blind, were recruited to take part in
the research for £10. Participants still living with their parents were not recruited since it was
assumed such individuals would have less control over their diet. Prior to testing, participants
were told that they would have to be tested again 12 months later. Testing involved the
measures described below. Time 1 testing also included additional measures the results of
which are reported elsewhere (21, 24). The other published results focus on cross-sectional
data unique from the current research paper. One (21)focused mainly on comparing
associations between different cognitive bias measures. The other (24) looked at predictors of
a new measure of portion size preference. Here we report only measures relevant to our
longitudinal analysis. Participants completed the food Stroop and the dot probe (the order of
administration was counterbalanced between the two tasks) and then completed a booklet
containing questionnaires relating to eating behaviour and lifestyle. Following this,
Materials and measures
Cognitive Bias Measures. The visual display and response collection was controlled
by SuperLab, software for presenting stimuli and recording reaction times. Participants
responded using a Cedrus RB-730 7-button response box to ensure millisecond accuracy.
Characters in the stimuli were approximately 5-7 mm tall.
Stroop. Participants were required to identify the colour of the word that appeared on
the computer screen by pressing the corresponding button on the response box (red, blue,
green, yellow). Each trial ran as follows: an initial fixation point (‘+’) appeared in the screen
centre for 500 ms. Next the word was presented in the screen centre and remained there until
participants made their response. There was a 1000 ms inter-trial interval. Participants first
completed an introductory (12 trials) and a buffer block (4 trials) of number words to practice
identifying ink colours. The experimental block consisted of 160 trials where each of the 20
food words (10 healthy and 10 unhealthy) and 20 office words were presented in each of the
four colours. Following recommendations of Cox et al. (22)food and office words were
blocked: participants responded to all food words first or all office words first; block order
was counterbalanced. Words were presented in a random order within each block.
The average response latencies to the office words were subtracted from the average
response latencies to the corresponding healthy and unhealthy food words. This resulted in
two cognitive bias indices, one for healthy and one for unhealthy foods. Higher (more
positive) scores indicated greater interference in colour naming and thus indicated more
cognitive bias towards healthy or unhealthy foods.
Dot probe. Participants were required to identify the location of a dot (‘.’). Each trial
ran as follows: a fixation point (‘+’) appeared in the screen centre for 500 ms, followed by the
word pair. The word pair remained on screen for either 500ms (in a version measuring initial
dot was presented in one of the word locations. The dot remained on screen until the
participant responded. There was a 1000 ms inter-trial interval. Following an introductory (8
trials) and buffer (4 trials) block, participants completed the initial orientation block and the
sustained attention block (the latter preceded by another 4 buffer trials).
The location of the food/office words and the dot probe was fully counterbalanced: on
half of the trials the dot appeared in the same location as the food word and on the other half
of the trials in the opposite location to the food word. Trials where a food word and the probe
appeared in the same location are referred to as congruent. Trials where the food word and
the probe appear in the opposite location are referred to as incongruent. Therefore, each of
the 20 food words (10 healthy, 10 unhealthy) appeared 4 times (congruent top, congruent
bottom, incongruent top, incongruent bottom), resulting in 80 experimental trials. All word
pairs were presented in random order for each participant.
Attentional bias scores for healthy and unhealthy foods were computed by subtracting
the mean response latencies for congruent trials from the mean response latencies for
incongruent trials. Positive scores indicated attention toward the specific (healthy or
unhealthy) food cues, with higher scores reflecting stronger bias.
Eating Styles. The Dutch Eating Behaviour Questionnaire (DEBQ (2)) consists of 33
items, 13 of which assess emotional eating (eating in response to emotions), 10 external
eating (eating in response to food-related cues such as the sight or smell of palatable food),
and 10 restrained eating (attempting to limit ones food intake). Each question was answered
on a 5-item rating scale (never; rarely; sometimes; often; very often). Participant scores for
each subscale of the DEBQ were computed following van Strien et al. (2). For all subscales,
scores ranged between one and five with higher scores indicating higher levels of restrained,
Stress. Participants completed the 14 item stress scale taken from Lovibond &
Lovibond’s Depression, Anxiety and Stress Scale (25). The questions were answered on a 4
point scale (did not apply to me at all; applied to me to some degree, or some of the time;
applied to me to a considerable degree, or a good part of the time; applied to me very much,
or most of the time). A stress score was created for each participant by summing responses to
each of the 14 items. Higher scores indicated greater levels of stress.
Physical Activity. Using the scale of Smith, Marshall, & Huang (26)participants
recorded both the frequency of walking and moderate-intensity physical activity engaged in
for 30 minutes or more (4-point scale: 5 or more times a week; 3-4 times a week; 1-2 times a
week; none), and the frequency of vigorous-intensity physical activity engaged in for 20
minutes or more (3-point scale: 3-4 times a week; 1-2 times a week; none). Participant
responses were reverse scored so that higher values represented greater physical activity. All
items were reliably inter-correlated (rs from .43 to .73) and so were subsequently averaged to
create a single index of physical activity.
BMI. BMI scores were computed as weight (kg)/height (m2).
Phase 2
Participants
One year later (+/- 4 weeks) participants were asked to attend Phase 2 and 102
participants (67.5%) returned. There were 58 females and 44 males (mean age=19 years,
SD=1 year). Participants received £4 for their time.
Measures & procedure
DEBQ measures, physical activity, and stress were all calculated in the same manner
as at Phase1. All Phase 2 measures were highly, positively associated with their Phase 1
activity r=.59; stress r=.63) indicating that these psychological and behavioural
characteristics were highly similar at both test phases). Accordingly, we averaged Time 1 and
Time 2 scales together (scale reliabilities: emotional eating α=.95; external eating α=.91;
restrained eating α=.96; physical activity α=.82; stress α=.94). Participants also had their
height and weight measured, so as to compute the Phase 2 BMI.
Results
Data preparation and preliminary analyses
Dot probe. Following Mogg, Bradley, and Williams (27), latencies less than 100 ms
or greater than 4000 ms were excluded. Latencies were log transformed and those more than
two standard deviations above each participant’s own mean were removed. Log scores were
then retransformed back into a millisecond scale.
BMI. We examined whether there was sufficient variance in BMI between Phase 1
and Phase 2. Results of a paired-sample t-test revealed a modest yet significant increase in
BMI, t(101)=2.02, p=.05 (MBMI Phase 1=23.32, SD=3.52; MBMI Phase 2=23.64, SD=3.50). Accordingly, a change variable was computed by subtracting participants’ BMI at Phase 1
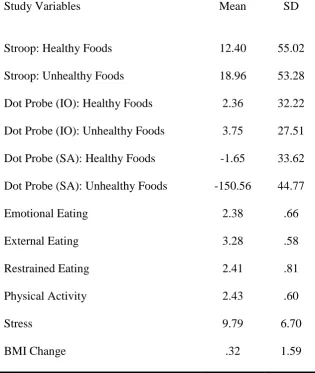
from their BMI at Phase 2. Higher scores indicated greater increase in BMI. Table 1 shows
descriptive statistics for all study variables.
Main analyses
Our objective was to examine whether attentional bias at Phase 1 could predict BMI
change across a 12-month period, taking into account (controlling for) additional possible
predictors of BMI change. However, initially, we wanted to assess whether there was any
zero-order association between each of the cognitive bias variables and BMI change prior to
exploring partial relationships in a regression model. This was done to ensure that any
relationship between each of the six cognitive biases measures (emotional Stroop, initial dot
probe x 2 for healthy and unhealthy foods, sustained dot probe x 2 for healthy and unhealthy
foods) and BMI change. Results revealed that cognitive bias for unhealthy foods measured
using the emotional Stroop was positively associated with BMI change (r= .23, p< .03. None
of the other cognitive bias measures were reliably correlated with BMI change (emotional
Stroop healthy, r= -.08, p> .43; dot probe initial orientation healthy, r= .15, p> .13; dot probe
initial orientation unhealthy, r= .12, p> .22; dot probe sustained attention healthy, r= -.04, p>
.69; dot probe sustained attention unhealthy, r= .10, p> .30).
However, these individual correlations can be misleading because of any possible
interrelation between the healthy/unhealthy cognitive bias variables for each of the three tasks
and also because BMI change in our sample is plausibly a function of variables other than
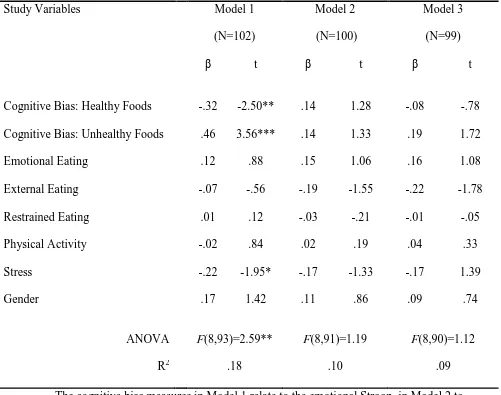
cognitive bias as well. Accordingly, we next performed three multiple regression analyses, a
separate one for each of the cognitive bias measures (Stroop, dot probe initial orientation, dot
probe sustained attention). For each regression model, cognitive bias for healthy foods,
cognitive bias for unhealthy foods, emotional eating, external eating, restrained eating,
physical activity, stress, and gender were concurrently entered as predictors. BMI change was
the dependent variable (see Table 2). Accordingly, each model provided an estimate of the
contribution of each predictor variable to BMI change, in the context of a range of other
possible predictors of BMI change. The only model that reliably predicted BMI change better
than chance was the model containing the emotional Stroop. This model accounted for 18%
of the variance in BMI change. Cognitive bias for unhealthy foods and cognitive bias for
healthy foods and stress were the only significant predictors of BMI change (that is, they
were the only predictors in the model with a significant coefficient). A bias for unhealthy
foods was associated with an increase in BMI whereas a bias for healthy foods and stress
Discussion
Understanding the factors that lead to BMI change is an issue of considerable
practical importance. For the first time, we have demonstrated that cognitive biases for
healthy and unhealthy foods predict BMI change across a 12 month period. This finding
closely parallels analogous results in alcohol abuse (10). Our research allows a number of
important additional conclusions: First, cognitive biases had predictive utility when measured
by the emotional Stroop task but not when measured by the dot probe (capturing either initial
or sustained attention). There has recently been considerable controversy regarding the
relative merits of the emotional Stroop and dot probe paradigms when applied to health
psychology or substance abuse. Our research shows that in the context of eating behaviour
the former has more predictive power. Second, cognitive biases for healthy and unhealthy
foods could account for more variance in BMI change, compared to a range of other possible
predictors, such as physical activity, stress, and emotional, restrained, and external eating.
Additionally, the pattern of associations between Stroop cognitive biases and BMI was
compelling: a bias for unhealthy foods was linked with an increase in BMI whereas a bias for
healthy foods was actually linked with a decrease in BMI. These finding underwrite the
importance of cognitive biases for food-related information in eating behaviour.
These findings need to be considered in the light of two key issues. Firstly, the effect
sizes associated with cognitive biases to healthy and unhealthy food words and BMI change
are, at best, modest. This is particularly the case when the proportion of variance accounted
for by cognitive bias toward unhealthy and healthy food words are considered in isolation
(both account for less than 5% of the variance in BMI change). Secondly, as the sample
populations. Accordingly, for this population, it is likely that there are additional key
predictors of BMI change.
One way to understand our findings is with the Cognitive Theory (CT) approach in
eating pathology. CT asserts that thinking is organised into knowledge structures which guide
information processing. These knowledge structures are assumed to reflect an over-concern
with weight-, shape-, and food–related information (7). Accordingly, selective attention (5) or
memory biases (6) for food-related information are likely consequences of the activation of
these knowledge structures. Cox and colleagues (e.g., 10) have proposed an analogous
hypothesis in a motivational framework, according to which pre-occupation with an issue,
such as alcohol consumption, would lead to cognitive biases for related information.
We expected that measures of eating behaviour (e.g., the DEBQ indices) would
predict BMI change. For example, according to Fairburn and Wilson (28) it is restrained
eating which leads to food-related attentional biases: Concerns about body weight, lead to
restriction of food, greater feelings of hunger, increased pre-occupation with food and
associated attentional biases. DEBQ indices have been used to successfully predict current
BMI in other research (16) and previous studies have found that measures of restrained eating
prospectively predict weight gain (29-31). These results were not replicated in our research. It
is possible that eating style (as measured by the DEBQ) is a less important predictor for BMI
change in our particular population sample (which consisted mostly of early 20s university
undergraduates).
Instead, our results are consistent with other attempts to use eating style in order to
predict BMI change. For example, Lowe et al. (32) found that whereas a history of dieting
and weight suppression predicted weight increase in students in their freshman year, none of
the traditional eating style measures such as emotional eating (measured by the DEBQ),
Questionnaire: TFEQ) and restrained eating (Restraint Scale) were associated with weight
gain. Also, De Lauzon-Guillain et al. (33)found that restrained eating (measured by TFEQ)
could not predict BMI over a two year period.
Overall, the relationship between stress, eating behaviour (DEBQ), and food intake
(and so presumably BMI changes) is not straight forward. Some investigators have reported
that in a laboratory setting female participants scoring high on measures of restrained eating
consume more food after an ego-threatening task, when offered either a single food (34) or a
variety of foods (35). Survey results of Wallis and Hetherington (36) showed that females
who scored high on measures of emotional eating were more likely to consume high fat
snacks in response to stress. However, a laboratory manipulation, by the same investigators,
in which participants were presented with both a high fat and a low fat food led to somewhat
conflicting results. Participants high on restraint consumed less of the low fat food after an
ego threatening Stroop task (which involved words like ‘worthless’), compared to low
restrained participants and there was no corresponding effect in relation to emotional eating.
Such results highlight a complex relationship between stress, the DEBQ characteristics of
eating behaviour, and the type and range of food available. It is possible that the limited
resource model of control offers some insight (37, 38). This literature suggests that
self-regulatory abilities are important for a range of behaviours and cognitive processes including
behavioural control (e.g., resisting tempting foods), emotion regulation (such as stress
reduction) and attentional control (as is required by Stroop and dot probe tasks). However,
according to this model self-regulation is a limited resource. As such, an individual who has
depleted their self-regulatory resources on, for example, emotion regulation, may have less
resources available for other behaviours requiring self-control, such as resisting tempting
From a practical point of view, if higher cognitive biases for food-related information
can predict an increase in BMI, one can ask whether (artificially) reducing the cognitive bias
would prevent the BMI increase. Cognitive-style interventions are currently being
enthusiastically pursued in alcohol abuse. Such interventions typically involve training
excessive drinkers to reorient their attention away from alcohol-related information (39).
Preliminary results from such efforts have been encouraging and offer the promise for a
relatively cost-effective intervention, to supplement more clinically-oriented approaches.
Similar attentional retraining might be useful for individuals demonstrating food-related
attentional biases. However, Dejonckheere, Braet, and Soetens (40), found an interference
effect for sweet words after the suppression of thoughts about sweets. Therefore, ironically, if
deliberate attempts at cognitive avoidance of unhealthy food cues enhance corresponding
attentional biases, then, as our results show, this may lead to weight gain! Clearly,
interventions against weight change need to be designed with great care.
Acknowledgements
This work was supported by the Wales Office of Research & Development (WORD)
grant Ref 05/1/010 awarded to Emmanuel M. Pothos and Katy Tapper.
References
1. Callee, E.E., Thun, M.J., & Petrelli, J.M. (1999). Body-mass index and mortality in a
prospective cohort of U.S. adults. New England Journal of Medicine, 341, 1097-1105.
2. Van Strien, T., Frijters, J.E.R., Bergers, G.P.A. & Defares, P.B. (1986). The Dutch Eating
Behavior Questionnaire (DEBQ) for assessment of restrained, emotional and external
3. O’Conner, D.B., Jones, F., Conner, M., McMillan, B., & Ferguson, E. (2008). Effects of
daily hassles and eating style on eating behavior. Health Psychology, 27 (suppl.), s30 –
s31.
4. Davis, C., Patte, K., Levitan, R., Reid, C., Tweed, S. & Curis, C. (2007). From motivation to
behaviour: a model of reward sensitivity, overeating, and food preferences in the risk
profile for obesity. Appetite, 48, 12-19.
5. Braet, C. & Crombez, G. (2003). Cognitive interference due to food cues in childhood
obesity. Journal of Clinical Child and Adolescent Psychology, 32,32-39.
6. Soetens, B. & Braet, C. (2007). Information processing of food cues in overweight and
normal weight adolescents. British Journal of Health Psychology, 12, 285-304.
7. Cooper, M. & Fairburn, C.G., (1992). Selective processing of eating, weight and
shape-related words in patients with eating disorders and dieters. British Journal of Clinical
Psychology, 31, 363-365.
8. Williamson, D.A., White, M.A., York-Crowe, E., & Stewart, T.M. (2004).
Cognitive-behavioral theories of eating disorders. Behavior Modification, 28, 711-738.
9. Cox, W. M., Hogan, L. M., Kristian, M. R., & Race, J. H. (2002). Alcohol attentional bias as
a predictor of alcohol abusers' treatment outcome. Drug and Alcohol Dependence, 68(3),
237-243.
10. Cox, W. M., Pothos, E. M., & Hosier, S. G. (2007). Cognitive-Motivational Predictors of
Excessive Drinkers’ Success in Changing. Psychopharmacology, 192, 499-510.
11. Wiers, R. W., Stacy, A. W., Ames, S. L., Noll, J. A., Sayette, M. A., Zack, M., & Krank,
M. (2002). Implicit and explicit alcohol-related cognitions. Alcoholism: Clinical and
12. Boon, B., Vogelzang, L. & Jansen, A. (2000). Do restrained eaters show attention toward
or away from food, shape and weight stimuli? European Eating Disorders Review, 8,
51-58.
13. Francis, J.A, Stewart, S.H., & Hounsell, S. (1997). Dietary restraint and the selective
processing of forbidden and nonforbidden food words. Cognitive Therapy and Research,
21, 633-646.
14. Johansson, L., Ghaderi, A., & Andersson, G. (2004). The role of sensitivity to external
food cues in attentional allocation to food words on dot probe and Stroop tasks.
Eating Behaviours, 5, 261-271.
15. Tapper, K., Pothos, E. M., Fadardi, J. S. & Ziori, E. (2008). Restraint, disinhibition and
food-related attentional biases. Appetite, 51, 335-338.
16. Pothos, E. M., Tapper, K., & Calitri, R. (2009). Cognitive and behavioral correlates of BMI
among male and female undergraduate students. Appetite, 52, 797-800.
17. Serlachius, A., Hamer, M., & Wardle, J. (2007). Stress and weight change in the United
Kingdom. Physiology and Behaviour, 92, 548-553.
18. MacLeod, C., Mathews, A, & Tata, P. (1986). Attentional bias in emotional disorders.
Journal of Abnormal Psychology, 95, 15-20.
19. Rafal, R., Davies, J., & Lauder, J. (2006). Inhibitory tagging at subsequently fixated
locations: Generation of “inhibition of return” without saccade inhibition. Visual
Cognition, 13, 308-323.
20. Newman, E., O’Connor, D.B., & Conner, M. (2008). Attentional biases for food stimuli in
external eaters: Possible mechanisms for stress-induced eating? Appetite, 51, 339-342.
21. Pothos, E.M., Calitri, R., Tapper, K., Brunstrom, J. M., & Rogers, P.J. (in press).
Comparing measures of attentional bias relating to eating behaviour. Applied Cognitive
22. Cox, W. M., Fadardi, J. S., & Pothos, E. M. (2006). The addiction-Stroop test: Theoretical
considerations and procedural recommendations, Psychological Bulletin, 132, 443-476.
23. Mckenna, F.P., & Sharma, D. (2004). Reversing the emotional Stroop effect reveals that it
is not what it seems: The role of fast and slow components. Journal of Experimental
Psychology: Learing, Memory, and Congnition, 30, 382-392.
24. Brunstrom, J. M., Rogers, P.J., Pothos, E.M., Calitri, R., & Tapper, K. (2008). Estimating
everyday portion size using a ‘method of constant stimuli’: In a student sample, portion
size is predicted by gender, dietary behaviour, and hunger, but not BMI. Appetite, 51,
296-301.
25. Lovibond, S. H., & Lovibond, P. T. (1995). Manual for the Depression Anxiety Stress
Scales (2nd Ed). Sydney: Psychology Foundation.
26. Smith, B.J., Marshall, A.L. & Huang, N. (2005). Screening for physical activity in family
practice. Evaluation of two brief assessment tools. American Journal of Preventive
Medicine, 29, 256-264.
27. Mogg, K., Bradley, B., & Williams, R. (1995). Attentional bias in anxiety and depression:
the role of awareness. British Journal of Clinical Psychology, 34, 17-36.
28. Fairburn, C.G., & Wilson, G.T. (1993). Binge eating: Nature, assessment, and treatment.
New York: Guilford.
29. Klesges, R.C., Isbell, T.R., & Klesges, L.M. (1992). Relationships between dietary
restraint, energy intake, physical activity, and body weight: A prospective analysis.
Journal of Abnormal Psychology, 101, 668-674.
30. Stice, E., Cameron,R., Killen, J.D., Hayward, C., & Taylor, C.B. (1999). Naturalistic
weight reduction efforts prospectively predict growth in relative weight and onset of
obesity among female adolescents. Journal of Consulting and Clinical Psychology, 67,
31. Stice, E., Presnell, K., Shaw, H., & Rohde, P. (2005). Psychological and behavioral risk
factors for obesity onset in adolescent girls: a prospective study. Journal of Consulting &
Clinical Psychology, 73, 195-202.
32. Lowe, M.R., Annunziato, R.A., Markowitz, J.T., Didie, E., Bellace, D.L., Riddell, L,
Maille, C., McKinney, S., & Stice.E. (2006). Multiple types of dieting prospectively
predict weight gain during the freshman year of college. Appetite, 47, 83-90.
33. De Lauzon-Guillain, B., Basdevant, A., Roman, M., Karlsson, J., Borys, J-M., Charles,
M.A., & FLVS Study Group (2006). Is restrained eating a risk factor for weight gain in a
general population? American Journal of Clinical Nutrition, 83, 132-138.
34. Wallis, D.J., & Hetherington, M.M. (2004). Stress and eating: the effects of ego-threat and
cognitive demand on food intake in restrained and emotional eaters. Appetite, 43, 39-46.
35. Lattimore, P., & Maxwell, L. (2004). Cognitive load, stress, and disinhibited eating. Eating
Behaviours, 5, 315-324.
36. Wallis, D.J., & Hetherington, M.M. (2009). Emotions and eating. Self-reported and
experimentally induced changes in food intake under stress. Appetite, 52, 355-362.
37. Baumeister, R.F., Bratslavsky, E., Muraven, M. & Tice, D.M. (1998). Ego depletion: is the
active self a limited resource? Journal of Personality and Social Psychology, 74,
1252-1265.
38. Muraven, M., Tice, D. & Baumeister, R.F. (1998). Self-control as limited resource:
regulatory depletion patterns. Journal of Personality and Social Psychology, 74,
774-789.
39. Wiers, R. W., Cox, W. M., Field, M., Fadardi, J. S., Palfai, T. P., Schoenmakers, T., &
Stacy, A. W. (2006). The search for new ways to change alcohol-related cognitions in
40. Dejonckheere, P.J.N., Braet, C., & Soetens, B. (2003). Effects of thought suppression on
List of Tables
Table 1. Descriptive statistics for all study variables.
Appendix
Stroop practice words (word colour in parentheses): One (red), Two (red), three (blue), Five (green),
Thirteen (green), Ninety (yellow), Six (red), Ten (blue), Eight (blue), Nine (green), Fourteen (yellow),
Thirty (yellow). Stroop buffer words (colour in parentheses): Four (red), Eighteen (blue), Nineteen
(blue), Zero (yellow). Dot Probe practice words: One-Six, Two-Ten, Three-Eight, Five-Nine,
Thirteen-Fourteen, Ninety-Thirty, Fifteen-Sixteen, Fifty-Sixty. Dot Probe buffer words: Four-Zero,
Eighteen-Nineteen, Twelve-Twenty, Seven-Forty. Stroop & Dot Probe Healthy Foods (with matched
office words): Spinach-Stapler, Apples-Pencil, Salad-Paper, Lentils-Scanner, Vegetables-Calculator,
Fish-Lamp, Carrot-Webcam, Peas-Pins, Broccoli-Calendar, Grapes-Stamps. Stroop & Dot Probe
Unhealthy Foods (with matched office words): Cake-Desk, Sugar-Ruler, Doughnut-Scissors,
Hamburger-Envelopes, Chips-Files, Caramel-Monitor, Crisps-Blinds, Kebab-Memos, Pizza-Table,
Table 1. Descriptive statistics for all study variables.
Study Variables Mean SD
Stroop: Healthy Foods 12.40 55.02
Stroop: Unhealthy Foods 18.96 53.28
Dot Probe (IO): Healthy Foods 2.36 32.22
Dot Probe (IO): Unhealthy Foods 3.75 27.51
Dot Probe (SA): Healthy Foods -1.65 33.62
Dot Probe (SA): Unhealthy Foods -150.56 44.77
Emotional Eating 2.38 .66
External Eating 3.28 .58
Restrained Eating 2.41 .81
Physical Activity 2.43 .60
Stress 9.79 6.70
BMI Change .32 1.59
Note: IO=Initial Orientation; SA=Sustained Attention.
Table 2. Three multiple regression models predicting BMI change
Study Variables Model 1
(N=102)
Model 2
(N=100)
Model 3
(N=99)
β t β t β t
Cognitive Bias: Healthy Foods -.32 -2.50** .14 1.28 -.08 -.78
Cognitive Bias: Unhealthy Foods .46 3.56*** .14 1.33 .19 1.72
Emotional Eating .12 .88 .15 1.06 .16 1.08
External Eating -.07 -.56 -.19 -1.55 -.22 -1.78
Restrained Eating .01 .12 -.03 -.21 -.01 -.05
Physical Activity -.02 .84 .02 .19 .04 .33
Stress -.22 -1.95* -.17 -1.33 -.17 1.39
Gender .17 1.42 .11 .86 .09 .74
ANOVA F(8,93)=2.59** F(8,91)=1.19 F(8,90)=1.12
R2 .18 .10 .09
The cognitive bias measures in Model 1 relate to the emotional Stroop, in Model 2 to the dot probe (initial orientation), and in Model 3 to the dot probe (sustained
attention).
β, standardized β coefficient.