Abstract: The fabulous success of machine learning algorithms for medical image analysis lead the computer aided disease detection systems for medical diagnosis. This paper presents a system “Edge AI System for Pneumonia and Lung Cancer Detection (EASPLD)". The EASPLD is a unique and one stop solution to detect Pneumonia and Lung cancer. The system is used as a clinician decision supporting system or user system to detect the pneumonia and lung cancer. EASPLD uses deep learning techniques such as convolution neural network (CNN). The proposed solution uses medical image analysis techniques and or methods to develop the system. EASPLD proposed a CNN (EASPLD-CNN) EASPLD-CNN uses seven convolution layers and one max pool layer with 3x3 and 5x5 convolutions, whereas other proposed solutions uses either 3X3 or 5X5 convolutions. In our paper, we used the lung X-Ray and CT scan images from LIDC-IDRI[1] and Mendeley[2]. EASPLD consists of Input image capturing system (IICS), Image enhancement system (IES), EASPLD engine and Results reporting engine (RRE. The EASPLD system output is notified to the end user, i.e. clinician and or a patient in the form of visual, text and email notification.
Index Terms: Edge AI System, Artificial Intelligence, CNN, deep learning, neural networks, Pneumonia Detection, Lung Cancer Detection, medical image analysis
I. INTRODUCTION
Medical image analysis is an active area of research for deep learning. The deep learning solutions allow the system end users i.e. clinicians and patients to interact with real artificial intelligence systems. Any system or a method, which contributes the early disease detection of pneumonia and lung cancer, is likely to reduce the associated deaths. The statistics says that pneumonia stands in position one of the most common reasons for US children and adult hospitalization. Every year one million US adults need pneumonia diagnosis and 50,000 die from this disease [5]. The estimated new lung cancer cases in USA for 2019 are 228150 which are 12.9% of overall cancer cases [4]. The estimated lung cancer death in USA for 2019 is 142670 which are 23.5% of overall cancer deaths [4].
Pneumonia and lung cancer detection using CT scan images can be challenging for radiologists. The lung CT scan images are often nebulous and overlap with other irregularities. Automated detection of diseases from lung CT scan images is comparable at the level of professional radiologists. The ML solutions are taking health care to the next level.
Revised Manuscript Received on July 05, 2019.
Venkata Tulasiramu Ponnada, Research Scholar, Acharya Nagarjuna University, Nagarjuna Nagar, Guntur, Andhra Pradesh 522510, India.
Dr.S.V.Naga Srinivasu, Professor, Computer science and engineering, Narasaraopeta Engineering College, Narasaraopet, Andhra Pradesh 522601, India.
To achieve the ML solution for pneumonia and lung cancer type of problems, there are many algorithms [15] usually used, such as K- Nearest Neighbor algorithm, Random Forests algorithm, Support vector Machines, Decision Tree, Convolution neural network (CNN). The efficiency of each algorithm depends upon the data sets used. The effectiveness of algorithms is measured using Receiver Operating Characteristic curve (ROC curve) and Matthews Correlation Coefficient (MCC).
In this paper, we proposed EASPLD-CNN as a new CNN architecture to address the EASPLD. The EASPLD-CNN comprised of 7 sets of two convolution layers and one Max-pooling layer in total twenty one layers. So, total of fourteen convolution layers and seven Max-pooling layers are used to enhance the detection accuracy. To derive the EASPLD-CNN, we have exercised many combinations of CNN layers. All these combinations results are analyzed and finalized the combination. We have used the LIDC-IDRI [1] and Mendeley[2] data sets for EASPLD-CNN training and validation.
This paper is structured as follows. We summarize the medical image analysis and deep learning techniques in Section 2. In Section 3, we discuss CNN. In section 4, we propose deep learning architecture EASPLD-CNN. In Section 5, we discuss research results, and In Section 6, we discuss conclusion and future work.
II. MEDICAL IMAGE ANALYSIS USING DEEP LEARNING TECHNIQUES
Healthcare systems are safety critical systems [7]. The system development process is highly stringent to achieve the highest degree of accuracy and performance. In general, the key parameters to measure the system development is cost, quality and time. For safety critical systems the key parameter is quality. The safety critical systems are needed to get certified by regulatory authorities like FDA and FAA.
Deep Learning (DL) played vital role in medical image analysis, such as medical image processing, computer-aided diagnosis, image interpretation, image fusion, image registration, image segmentation, image-guided therapy, image retrieval and analysis. DL extracts information from the images and represents information effectively and efficiently to develop the clinician decision support systems. The clinician decision support systems support the doctors in detect, predict and diagnose the highly risk diseases at the early stages. The well-known deep learning algorithms [16] are Convolutional Neural Network (CNN), Recur-rent neural Network (RNN), Long Short term Memory (LSTM), Extreme
Learning Model (ELM) and
Edge AI System for Pneumonia and Lung Cancer
Detection
Generative Adversarial Networks (GANs) etc. and machine learning algorithms are Support Vector Machine (SVM), Neural Network (NN), KNN etc.
The traditional algorithms are limited in processing the medical images and time consuming. As traditional algorithms are depends on expert knowledge and requires a lot time for tuning the features. Whereas the deep learning algorithms automatically learn multiple levels of abstraction, representation and information from huge set of images that exhibit the desired behavior of data. The clinician decision support systems built upon machine algorithms has promising results i.e. accuracy, performance and detection time /prediction time. The deep learning algorithms also showed high results in various areas such as speech recognition, text recognition, lips reading, computer-aided diagnosis, face recognition, drug discovery[8][9][10].
The deep learning model performance depends upon the training dataset size and quality. The limitations of deep learning implementation in medical image analysis are unavailability of dataset; Medical image annotation takes extensive time from medical experts to reduce the human error and unavailability of data sets for rare diseases.
Health care domain adhere HIPAA, HL7 and HITECH standards to share the health care data across the stakeholders. These standards drive the interoperability and security. The interoperability and security levels[11][12][13] are evaluated using CCHIT and ARRA certification process.
Artificial neural networks are logically and architecturally motivated by neural systems. The key concepts of neural networks are open source deep learning, feed-forward neural networks, gradient descent-based parameter optimization, deep models and robust deep model training.
Another name for Automatic image analysis is computer vision. Computer vision deals with training and learning models using digital images and or videos. The general image analysis tasks are classification, detection and segmentation. Classification task is to classify images into classes. Best example for classification would be lung nodules into benign images or malignant images. Detection task is to localize the defect area in 2D or 3D space[14]. Segmentation task is to provide a pixel wise outlining of an organ or pathology.
Computer vision problems are addressed by traditional architectures, But those are depend upon hand-crafted features. The deep learning algorithms have presented a promising alternative to computer vision problems. The key feature of deep learning algorithms are automatic training and learning using context/problem based specific features. With this new standard, most of the computer vision problems are re-visited using deep learning standpoint. Choosing a right deep network is very critical in solving the problems. The most relevant deep network for computer vision problems is convolutional neural networks (CNNs). “AlexNet” is a base form of CNN. Of late, many variations to CNNs are proposed based on the application domain.
III. AI VS DL VS ML
Artificial Intelligence (AI) tries to build a robot that can mimic the human being. The robots can learn by making mistakes, and gaining an experience. AI addressed the problem statements related to natural language processing, image processing, signal processing and databases. At high level, we can say that AI is super set for Machine learning
(ML) and Deep Learning (DL). Fig. 1 describes the CNN relation with AI,ML and DL.
Fig.1 ML vs AI vs DL vs CNN
ML is a subset of AI that includes rarefied statistical methods which can improve the performance using experience. Algorithms that can be learned using problem features. A set of these learning algorithms are Machine Learning. Feature extraction and classification are sequential activates in ML. ML focuses on receive a set of data and learn for themselves, changing algorithms as they learn more about the information they are processing[17][18][19].
DL is subset of ML. DL comprises of self-learning algorithms which uses the multi layered neural networks. Feature extraction and classification are carried out by multi layered network in DL. Table-1 describes the Machine Learning Versus Deep Learning comparison matrix.
Parameter Machine
Learning(ML)
Deep
Learning(DL) Execution
Time
Few Hours Up to Weeks
Data Set Small or medium Large
Feature Engineering
Yes No
Interpretability Possible Impossible
Training Time Short Long
Table-1 Machine Learning Versus Deep Learning
IV. EASPLDSYSTEM
Our proposed system EASPLD consists of 4 sub-systems. The sub systems are Input image capturing system (IICS), Image enhancement system (IES), EASPLD and Results reporting engine (RRE). EASPLD system Black box is described in Fig. 2. The IICS system accepts the patient CT scan image and provides it as input for the IES. The IES enhances the quality of given input image and feeds it as input for EASPLD engine. EASPLD engine generates ML Model for Pneumonia and Lung cancer.
the respective models for the listed diseases. EASPLD provides abstract layer to the end user (Clinician/Patient) to select the disease for detection. Based on the end user input EASPLD routes the input image to the respective model. The model performs disease detection process and shares the detection results with RRE. RRE publish the results inform of Visual /Text and email to the end user. The EASPLD subsystem level interactions are described in Fig. 3.
Fig.2 EASPLD System Black Box
Fig.3 EASPLD Sequence Diagram
[image:3.595.60.282.221.500.2]LIDC-IDRI [1] and Mendeley [2] data sets are used in this research for demonstration. The proposed EASPLD-CNN is used to train the models for pneumonia and lung cancer. The outcome models are EASPLD-CNN-Pneumonia ML Model and EASPLD-CNN-Lung Cancer ML Model respectively. The output model generation process is described in Fig. 4 and Fig. 5.
Fig.4 EASPLD-CNN-Pneumonia ML Model
Fig.5 EASPLD-CNN-Lung Cancer ML Model Fig. 6 describes the EASPLD system theory of operation. The inputs for EASPLD system is Disease Selection
(Pneumonia/Lung Cancer) and an input image (Lung CT scan image / Chest X-Ray). The system routes the input image to
respective model
(EASPLD-CNN-Pneumonia/EASPLD-CNN-Lung Cancer) based on disease selection input. The output of model is shared with RRE.
Fig.6 EASPLD System Diagram
[image:3.595.309.541.353.527.2]RRE publish the results to the end user (Patient/Clinician). The end user notification is in three forms. I.e. Visual Notification on User Interface, mobile text notification and email notification. Fig. 7 describes the RRE system.
Fig.7 Results Reporting Engine(RRE)
V. EASPLDARCHITECTURE
Fig. 8 describes the EASPLD-CNN architecture. NN-SVG architecture [3] tools are used to develop the EASPLD-CNN. Fig. 9, Fig. 10 and Fig. 11 describes the EASPLD-CNN design and NN-SVG architecture [3] tools are used to develop the design. Due to space constraints for representation, the design is divided into three. One unique quality is that our EASPLD-CNN uses both 3x3 and 5x5 convolutions, whereas other proposed solutions uses either 3X3 or 5X5 convolutions. Below given list of convolution layer architecture combination is used.
[image:3.595.55.284.616.744.2]7. Convolution6, 5X5 8. Convolution6, 3X3
EASPLD-CNN step by step input and output is described below.
1. The input image is 224x224x3 2. Convolution 3X3 is applied
3. The output of Convolution 3X3 is 112X112X32 4. The output of Convolution 3X3 is input for
Convolution1 3X3
5. Convolution1 3X3 is applied(Refer Fig. 11) 6. The output of Convolution1 3X3 is 112X112X16 7. The output of Convolution1 3X3 is input for
Convolution6 3X3
8. Convolution6 3X3 is applied(Refer Fig. 12) 9. The output of Convolution6 3X3 is 56X56X24 10. The output of Convolution6 3X3 is input for
Convolution6 5X5
11. Convolution6 5X5 is applied(Refer Fig. 13) 12. The output of Convolution6 5X5 is 28X28X40 13. The output of Convolution6 5X5 is input for
Convolution6 3X3
14. Convolution6 3X3 is applied(Refer Fig. 12) 15. The output of Convolution6 3X3 is 28X28X80 16. The output of Convolution6 3X3 is input for
Convolution6 5X5
17. Convolution6 5X5 is applied(Refer Fig. 13) 18. The output of Convolution6 5X5 is 14X14X112 19. The output of Convolution6 5X5 is input for
Convolution6 5X5
20. Convolution6 5X5 is applied(Refer Fig. 13) 21. The output of Convolution6 5X5 is 7X7X192 22. The output of Convolution6 5X5 is input for
Convolution6 3X3
23. Convolution6 3X3 is applied(Refer Fig. 12) 24. The output of Convolution6 3X3 is 7X7X320 25. Max Pool layer is applied and its output is
Fig.9 EASPLD-CNN Part-I
Fig.10 EASPLD-CNN Part-II
Convolution1, 3X3, Convolution6, 3X3 and Convolution6, 5X5 are described in Fig. 12, Fig. 13 and Fig. 14. In Fig. 12, Conv1, 3X3 denotes that kernel size is 3X3(Height X Width) and depth is 1. 3X3X1 denotes that Height X Width X Depth.BN denotes that Batch norm facto and Pooling and Relu activation functions are used to enhance the detection result.
Fig.12 Conv1,3X3
In Fig. 13, Conv6,3X3 denotes that kernel size is 3X3(Height X Width) and depth is 6. 3X3X6 denotes that Height X Width X Depth. BN denotes that Batch norm facto and Pooling and Relu activation functions are used to enhance the detection result.
Fig.13 Conv6,3X3
In Fig. 14, Conv6,5X5 denotes that kernel size is 5X5(Height X Width) and depth is 6. 5X5X6 denotes that Height X Width X Depth. BN denotes that Batch norm facto and Pooling and Relu activation functions are used to enhance the detection result.
Fig.14 Conv6,5X5
Fig.15 Pneumonia Data set Snpashot
Fig.16 Lung Cancer Data set Snpashot
Fig.17 Pneumonia Normal and Effected Image Comparision
Conv1x1,BN +
Pooling, Relu
Conv1x1,BN,Relu
3x3x1 3x3x1 3x3x1
Conv1x1,BN +
Pooling, Relu
Conv1x1,BN,Relu
3x3x6 3x3x6 3x3x6
Conv1x1,BN +
Pooling, Relu
Conv1x1,BN,Relu
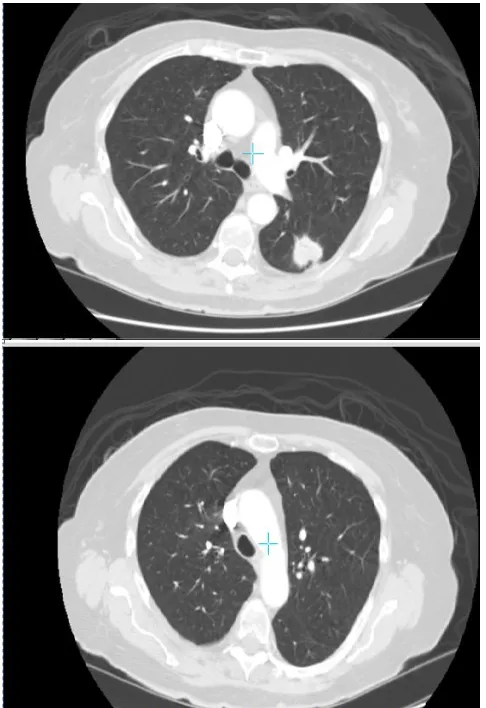
Fig.18 Lung Normal and Cancerous Image Comparision Fig. 15 and Fig. 16 represent the pneumonia and lung cancer data set snapshots respectively. Fig. 17 represents the pneumonia affected and normal lung image comparison versus. Fig. 18 represents the lung cancerous image and normal image comparison.
VI. RESULTS
EASPLD-CNN is implemented using TesnorFlow. Pneumonia detection results with EASPLD system are presented in Table-2 and lung cancer detection results with EASPLD system are presented in Table-3. The key parameters extracted from Tesnorflow board is Sample Data set Size, Processing time , Loss, Accuracy, Recall rate and precision.
Sample Data set Size 880/880
Processing time for each step 378s 150ms
Loss on test set 0.9356972557536821
Accuracy on test set 0.8569230769230769
Recall rate of the model 0.98
Precision of the model 0.81
Table-2 EASPLD-Pneumonia Detection Results
Sample Data set Size 1080/1080
Processing time for each step 420s 408ms
Loss on test set 0.81956972557536821
Accuracy on test set 0.86130769230769
Recall rate of the model 0.98
Precision of the model 0.79
Table-3 EASPLD-Lung Cancer Detection Results
VII. CONCLUSION AND FUTURE WORK
The proposed system “Edge AI System for Pneumonia and Lung Cancer Detection (EASPLD)” is a one stop solution Pneumonia and lung cancer detection. In recent days early detection of lung diseases considered as equivalent to prevention methods. This paper proposed EASPLD-CNN resulted in more effective and accurate results. The unique characteristic of EASPLD-CNN is it uses seven convolution layers and one max pool layer with 3x3 and 5x5 convolutions. We would like to extend our EASPLD-CNN to the larger set of lung diseases.
REFERENCES
1. https://wiki.cancerimagingarchive.net/display/Public/LIDC-IDRI 2. https://data.mendeley.com/datasets
3. http://alexlenail.me/NN-SVG/LeNet.html
4. Cancer Stat Facts: Lung and Bronchus Cancer https://seer.cancer.gov/statfacts/html/lungb.html
5. https://www.thoracic.org/patients/patient-resources/resources/top-pneu monia-facts.pdf
6. Venkata Tulasiramu Ponnada, S.V.Naga Srinivasu, Integrated Clinician Decision Supporting System for Pneumonia and Lung Cancer Detection, International Journal of Innovative Technology and Exploring Engineering (IJITEE),2019, ISSN: 2278-3075, Volume-8, Issue-8
7. Muhammad Imran Razzak, Saeeda Naz and Ahmad Zaib Deep Learning for Medical Image Processing: Overview, Challenges and Future 8. FastStats Pneumonia
CDC(https://www.cdc.gov/nchs/fastats/pneumonia.htm)
9. Maxim D Podolsky, Anton A Barchuk, Vladimir I Kuznetcov, Natalia F Gusarova, Vadim S Gaidukov, Segrey A Tarakanov. Evaluation of machine Learning Utilization for Lung Cancer Classification Based on Gene Expression Level
10. Laurens van der Maaten, Geoffrey Hinton Visualizing Data using t-SNE 2008 http://www.cs.toronto.edu/hinton/absps/tsne.pdf
11. McField D, Bauer T. A review of noninvasive staging of the
mediastinum for non-small cell lung carcinoma. Surg Oncol Clin N Am. 2011;20:681–90.
12. https://www.kaggle.com/nih-chest-xrays/datasets
13. Silvestri GA, Gould MK, Margolis ML, Tanoue LT, McCrory D, Toloza E, et al. Noninvasive staging of non-small cell lung cancer: ACCP evidenced-based clinical practice guidelines (2nd edition). Chest. 2007;132:178S–201S.
14. Broderick SR, Meyers BF. PET staging of mediastinal lymph nodes in thoracic oncology. Thorac Surg Clin. 2012;22:161–6.
15. Kim SK, Allen-Auerbach M, Goldin J, Fueger BJ, Dahlbom M, Brown M, et al. Accuracy of PET/CT in characterization of solitary pulmonary lesions. J Nucl Med. 2007;48:214–20.
16. Li X, Zhang H, Xing L, Ma H, Xie P, Zhang L, et al. Mediastinal lymph nodes staging by 18F-FDG PET/CT for early stage non-small cell lung cancer: a multicenter study. Radiother Oncol. 2012;102:246–50. 17. Schmidt-Hansen M, Baldwin DR, Hasler E, Zamora J, Abraira V, Roque
IFM. PET-CT for assessing mediastinal lymph node involvement in patients with suspected resectable non-small cell lung cancer. Cochrane Database Syst Rev. 2014;11:CD009519.
18. LeCun Y, Bengio Y, Hinton G. Deep learning. Nature. 2015;521:436–44.
19. JUSTIN KER1, LIPO WANG, JAI RAO AND TCHOYOSON LIM. Deep Learning Applications in Medical Image Analysis,Digital Object Identifier 10.1109/ACCESS.2017.2788044
20. Maxim D Podolsky, Anton A Barchuk, Vladimir I Kuznetcov, Natalia F Gusarova, Vadim S Gaidukov, Segrey A Tarakanov. Evaluation of machine Learning Utilization for Lung Cancer Classification Based on
Gene Expression Levels.
DOI:http://dx.doi.org/10.7314/APJCP.2016.17.2.835
21. Pranav Rajpurkar, Jeremy Irvin, et al. CheXNet: Radiologist-Level Pneumonia Detection on Chest XRays with Deep Learning,
1 Photo
22. Gao Huang, Zhuang Liu, Laurens van der Maaten. Densely Connected Convolutional Neural Networks https://arxiv.org/abs/1608.06993 23. Wang, et al. ChestX-ray8: Hospital-scale Chest X-ray Database and
Benchmarks on Weakly-Supervised Classification and Localization of Common Thorax Diseases
AUTHORSPROFILE
Venkata Tulasiramu Ponnada, pursuing PhD in Computer science and engineering from Acharya Nagarjuna University, Nagarjuna Nagar, Guntur, Andhra Pradesh 522510, India. His area of interest includes safety critical systems, software engineering, software testing, software project management and System engineering, machine learning, deep learning and artificial intelligence.