InTrans Project Reports Institute for Transportation
8-2008
Implementation of HERS-ST in Iowa and
Development / Refinement of a National Training
Program
Thomas H. Maze Iowa State University Omar G. Smadi
Iowa State University, [email protected] Neil A. Burke
Follow this and additional works at:http://lib.dr.iastate.edu/intrans_reports
Part of theCivil Engineering Commons
This Report is brought to you for free and open access by the Institute for Transportation at Iowa State University Digital Repository. It has been accepted for inclusion in InTrans Project Reports by an authorized administrator of Iowa State University Digital Repository. For more information, please [email protected].
Recommended Citation
Maze, Thomas H.; Smadi, Omar G.; and Burke, Neil A., "Implementation of HERS-ST in Iowa and Development / Refinement of a National Training Program" (2008).InTrans Project Reports. 161.
Implementation of HERS-ST in Iowa and Development / Refinement of
a National Training Program
Abstract
The Highway Economic Requirements System (HERS) is an economic model that uses highway performance monitoring system (HPMS) data to project future highway conditions and requirements. HERS is a highly complex model that, at the national level, uses samples of the highway network taken from the HPMS data. As a result, at the national level it is only used for aggregate network-level analysis (planning-level analysis). When the Federal Highway Administration’s Office of Asset Management was established in 1999, the office began developing the state version of HERS, or HERS-ST. HERS-ST has since evolved into a model that is specifically crafted for states. A DOS version of HERS-ST was demonstrated at a workshop attended by representatives of several state transportation agencies in 2001. Since then, several improvements have been made to the software, including updates for a Windows environment and the addition of GIS capabilities. The current project will yield a HERS-ST specifically for Iowa, but one that can be used as a model for other states.
Keywords
Asset management; Geographic information systems; Highways; Monitoring; Network analysis (Planning); Transportation planning; GIS; HERS-ST; Highway Economic Requirements System; Highway Performance Monitoring System; HPMS
Disciplines Civil Engineering
Comments
For more on this project and other project reports from InTrans, please visithttp://www.intrans.iastate.edu
Implementation of HERS-ST in Iowa
and Development/Refi nement of a
National Training Program
Final Report
August 2008
Sponsored by
University Transportation Centers Program, U.S. Department of Transportation
(MTC Project 2004-01)
About the MTC
The mission of the University Transportation Centers (UTC) program is to advance U.S. technology and expertise in the many disciplines comprising transportation through the mechanisms of education, research, and technology transfer at university-based centers of excellence. The Midwest Transportation Consortium (MTC) is the UTC program regional center for Iowa, Kansas, Missouri, and Nebraska. Iowa State University, through its Center for Transportation Research and Education (CTRE), is the MTC’s lead institution.
Disclaimer Notice
The contents of this report refl ect the views of the authors, who are responsible for the facts and the accuracy of the information presented herein. The opinions, fi ndings and conclusions expressed in this publication are those of the authors and not necessarily those of the sponsors.
The sponsors assume no liability for the contents or use of the information contained in this document. This report does not constitute a standard, specifi cation, or regulation.
The sponsors do not endorse products or manufacturers. Trademarks or manufacturers’ names appear in this report only because they are considered essential to the objective of the document.
Non-discrimination Statement
Technical Report Documentation Page
1. Report No. 2. Government Accession No. 3. Recipient’s Catalog No.
MTC Project 2004-01
4. Title and Subtitle 5. Report Date
August 2008
6. Performing Organization Code
Implementation of HERS-ST in Iowa and Development/Refinement of a National Training Program
7. Author(s) 8. Performing Organization Report No.
Thomas H. Maze, Omar G. Smadi, Neil A. Burke
9. Performing Organization Name and Address 10. Work Unit No. (TRAIS)
11. Contract or Grant No.
Midwest Transportation Consortium 2711 South Loop Drive, Suite 4700 Ames, IA 50010-8664
12. Sponsoring Organization Name and Address 13. Type of Report and Period Covered
Final Report
14. Sponsoring Agency Code
U.S. Department of Transportation
Research and Special Programs Administration 400 7th Street SW
Washington, DC 20590-0001
15. Supplementary Notes
Visit http://www.ctre.iastate.edu/mtc for color PDF files of this and other research reports.
16. Abstract
The Highway Economic Requirements System (HERS) is an economic model that uses highway performance monitoring system (HPMS) data to project future highway conditions and requirements. HERS is a highly complex model that, at the national level, uses samples of the highway network taken from the HPMS data. As a result, at the national level it is only used for aggregate network-level analysis (planning-level analysis). When the Federal Highway Administration’s Office of Asset Management was established in 1999, the office began developing the state version of HERS, or HERS-ST. HERS-ST has since evolved into a model that is specifically crafted for states. A DOS version of HERS-ST was demonstrated at a workshop attended by representatives of several state
transportation agencies in 2001. Since then, several improvements have been made to the software, including updates for a Windows environment and the addition of GIS capabilities. The current project will yield a HERS-ST specifically for Iowa, but one that can be used as a model for other states.
17. Key Words 18. Distribution Statement
asset management—GIS—HERS-ST—Highway Economic Requirements
System—Highway Performance Monitoring System(HPMS)—network analysis No restrictions.
19. Security Classification (of this
report) 20. Security Classification (of this page) 21. No. of Pages 22. Price
Unclassified. Unclassified. 29 NA
I
MPLEMENTATION OF
HERS-ST
IN
I
OWA AND
D
EVELOPMENT
/R
EFINEMENT OF A
N
ATIONAL
T
RAINING
P
ROGRAM
Final Report August 2008
Principal Investigator
Tom Maze
Professor of Transportation Engineering
Center for Transportation Research and Education, Iowa State University
Co-Principal Investigator
Omar Smadi
Research Scientist, Professor of Transportation Engineering Center for Transportation Research and Education, Iowa State University
Research Assistant
Neil Burke
Authors
Thomas H. Maze, Omar G. Smadi, Neil A. Burke
Preparation of this report was financed in part
through funds provided by the U.S. Department of Transportation through the Midwest Transportation Consortium,
Project 2004-01.
Project administered by
Midwest Transportation Consortium
2711 South Loop Drive, Suite 4700 Ames, IA 50010-8664
v
TABLE OF CONTENTS
ACKNOWLEDGMENTS ... IX
EXECUTIVE SUMMARY ... XI
DEFINITION OF HERS-ST...1
DATA CUSTOMIZATION...3
Highway Dataset...3
Parameter Data Modification...3
Control Data Modification...4
SAMPLE RUN ANALYSIS AND OUTPUT ...5
HERS-ST TRAINING SEMINAR ...9
CONCLUSION...10
REFERENCES ...11
APPENDIX A. CHANGES MADE TO HERS-ST SAFETY PARAMETERS ... A-1
vii
LIST OF FIGURES
Figure 1. Total improvement cost for Iowa interstate system by funding period for several annual constrained budget scenarios...6 Figure 2. Average IRI values for the Iowa interstate system for several annual constrained
budgets ...6 Figure 3. Total delay for Iowa interstate system for various funding scenarios...7 Figure 4. Improvement types in $130 million annual constrained budget for Iowa interstate
system ...8
LIST OF TABLES
ix
ACKNOWLEDGMENTS
xi
EXECUTIVE SUMMARY
This report summarizes each task involved in the Midwest Transportation Consortium’s
Highway Economic Requirements System state version (HERS-ST) project. The initial goals of this project include customizing the HERS-ST software for the Iowa primary network, training Iowa Department of Transportation (Iowa DOT) employees to use the HERS-ST software, and holding a regional HERS-ST training seminar. The final task involves integrating the Iowa DOT training experience into Federal Highway Administration (FHWA) training materials and
working with the FHWA Office of Asset Management to deliver HERS-ST training seminars to other states.
DEFINITION OF HERS-ST
In 1987, the Federal Highway Administration (FHWA) began the work on an economic model that later became the Highway Economic Requirements System (HERS) (FHWA 2001). HERS was first used in 1995 to support the U.S. Department of Transportation’s (USDOT’s) condition and performance report. HERS is an economic model that uses Highway Performance
Monitoring System (HPMS) data to project future highway conditions and requirements based on a comparison of the different potential projects. The model then selects improvement options that have benefits greater than their costs. Benefits include reducing user, agency maintenance, and societal costs over the life of the improvement (FHWA 2002a).
HERS-ST, the state-level version of HERS, is a highway investment and performance computer model that has been developed by the FHWA. This software is a Microsoft Access–driven database with a graphical user interface (GUI) that considers engineering and economic impacts and principles to determine the magnitude of alternative highway investment levels and program structures on highway condition, performance, and user impacts. Performance data is loaded from the HPMS data into the GUI. Parameter data provides cost data, deficiency levels, and other data to the HERS-ST analysis. The control data provides the settings for the modification of the HERS-ST analysis engine. The software is currently being utilized by the FHWA and state departments of transportation (DOTs) to estimate future investment requirements for pavement preservation and system expansion. The HERS-ST software has a twenty-year planning horizon, where the default settings analyze performance data for four funding periods of five years in length.
HERS-ST has several run analyses to examine a variety of funding situations. The full engineering analysis disregards a benefit-cost ratio to select projects and instead identifies all deficiencies on a highway system and calculates the funds necessary to fix them. The minimum benefit-cost ratio analysis implements all improvements with a benefit-cost ratio that is greater than the defined threshold value, which has a default value of 1.0. The Constraint by Funds run scenario maximizes the value of the improvements’ benefits by selecting projects that are
prioritized by deficiency but that are within the limits of the budget for each funding period. The Constraint by Performance run scenario optimizes the goals for the performance of the highway system for each funding period.
Every run scenario executed in HERS-ST produces a tabular output with roadway-related deficiencies, funding by improvement type, and changes between each funding period.
Additionally, a “section conditions” spreadsheet file is created that contains performance metrics and improvement types for each segment that had been included in the HERS-ST analysis. The HERS-ST software includes a suite of report tools with chart, table, and report generation programs, as well as a rudimentary geographical information systems (GIS) function. The GIS function in HERS-ST is able to map deficiencies or improvements by section, but it is unable to perform sophisticated data analysis.
While HERS-ST can be a useful planning tool in forecasting performance and maintenance needs, the software has several limitations. HERS-ST is not a network model; thus, it does not
consider the improvements of a parallel corridor in the project selection process of another corridor. HERS-ST is also not a spatial model. Therefore, traffic volumes cannot be assigned to specific links. Additionally, the structural costs involved in reconstructing or replacing bridges is not considered (FHWA 2004).
This report will summarize the completed tasks for the Midwest Transportation Consortium’s (MTC) HERS-ST project. Customization of the default data was necessary to properly represent the highway infrastructure that the Iowa DOT is responsible for maintaining. Manipulation of the data to prepare a presentable output was an issue. These tasks were completed, and the
researchers held a one-day HERS-ST training seminar for Iowa DOT and FHWA employees on Monday, June 27, 2005.
DATA CUSTOMIZATION
Customization of the data used in the HERS-ST analysis was imperative to meet several specific needs. The Iowa DOT was aiming to use HERS-ST to prioritize projects and designate funds appropriately in the fields of asset management, highway safety, and highway maintenance. Because every state transportation agency manages and collects data about its highway network differently, changes need to be made to the default control and parameter HERS data to reflect these differences. Additionally, reconstruction and improvement costs vary by state, so
modifications to the default cost information need to be made. Ultimately, the default parameter and control data values reflect nationwide averages, and the HERS-ST analysis could be
optimized when values are used that directly reflect conditions on the Iowa primary system.
Highway Dataset
The highway dataset provides the dimensions and operating characteristics of the network to HERS-ST. Similar to the HPMS reporting standards, HERS-ST has 98 attribute fields for every record within a dataset. Several data modification tasks were needed to conduct accurate run analyses in HERS-ST with Iowa HPMS data. Loading errors with the Iowa HPMS dataset were an initial issue. The first dataset obtained from the Iowa DOT Office of Systems Planning was a series of 37,000 sample sections of less than one mile in length throughout the state. This dataset was not well refined, contained numerous data errors, and produced spurious results when a HERS-ST run analysis was executed.
As an alternative, the HPMS sample dataset was replaced by a 100% sample that contained only 5,031 records. The complete sample dataset contained 8,800 miles of highway segments, which represents the entire primary system throughout the state. From the complete dataset, meaningful run analyses in HERS-ST could be performed. Using the query tool in HERS-ST, analyses were run on the entire interstate system throughout the state, the urban interstate system, and the primary system excluding the interstate system.
To obtain a higher level of accuracy in the analysis of pavement deterioration on the Iowa primary system, modifications to the international roughness index (IRI) values were made. The Iowa DOT collects IRI data for each test segment, then aggregates these averages to finite Geographic Information Management System (GIMS) segments of significant length. This method loses the local impact of IRI data. As an alternative, 10 m distress IRI data collected by Roadware Group, Inc., was substituted for the IRI data provided by the Iowa DOT. The IRI data was averaged for each wheel path and assigned to test sections throughout the primary system.
Parameter Data Modification
The parameter data provides significant information to the HERS-ST analysis regarding pavement specifications, improvement costs, and deficiency thresholds. A workset may have multiple sets of parameter data, although only one is active at a given time. The customization of the parameter values in HERS-ST involved modifications to the safety parameters, deficiency thresholds, and cost parameters.
The safety parameters estimate the future safety of the highway system given the crash rates for different highway functional classes and the length of the analysis period. Specifically, the value of life was adjusted from the HERS-ST default of $3,000,000 to the Iowa DOT fatality cost of $1,200,000. The Iowa DOT Office of Traffic Safety provided values for the injury-crash ratio and fatality-crash ratio by functional class. The actual changes that were made to the safety parameters are listed in Appendix A.
The deficiency thresholds are used to determine whether a highway segment requires an improvement. These settings in HERS-ST also determine the best improvement type based on the deficiency threshold. The pavement deterioration rate has a default value of 0.3. A sensitivity analysis was conducted with several different rates before 0.15 was selected because this value provided a reasonable time period for resurfacing projects on interstate segments. In addition, eight modifications were made to the present serviceability rating (PSR) and the maximum PSR after resurfacing based on the pavement type for urban and rural sections.
The cost parameters measure the expense of an improvement on a highway segment. One of the modifications made to the cost parameters involved changing the state cost factor from 0.745 to 1.0 to provide more weight for each improvement. The state cost factor affects how the
improvement costs are viewed in the interface and used in the HERS-ST analysis. A state cost factor is derived for each state by the state’s Office of Infrastructure and is calculated from price trends as a three-year rolling average that is applied to all capital costs associated with the improvement (FHWA 2002b). The following cost parameter data was changed relative to the default cost data that the Iowa DOT uses to price transportation projects:
• Improvement cost (by functional class)
• Right of way cost (by functional class and terrain)
• Pavement cost (by pavement thickness)
• Pavement cost for unreinforced rigid slabs
Appendix B lists the cost data used in the HERS-ST analyses prepared for the Iowa DOT.
Control Data Modification
Modifying the control data allows the user to specify the analysis objective, method, cost units, output information, and other settings to control the analysis. Like the parameter data, a workset can have several sets of control data, although only one set can be active at a time. The discount rate used in reducing benefits was modified from 7% to 4% to reflect the discount rate used by the Iowa DOT. The maximum speed limit for the interstate scenario was changed from 75 mph to 65 mph to reflect the state of Iowa’s maximum speed limit on rural interstate segments at the time.
SAMPLE RUN ANALYSIS AND OUTPUT
A sample run analysis was created in HERS-ST to test the validity of the analysis engine as well as the output functions. The 20-year analysis consisted of four funding periods with 5-year durations. The analysis identified the deficiencies and improvements on Iowa’s interstate highway network. All of the interstate sections were selected in HERS-ST by using the query tool. All sections of the I-235 corridor through Des Moines were excluded because the entire reconstruction of this highway is ongoing and expected to be completed in 2008. A “constrained by funds” scenario was chosen to determine the amount of funding necessary to achieve the desired average performance metrics on the interstate system. A sensitivity analysis was
conducted in which the HERS-ST analysis was constrained by the following funding scenarios:
• $550 million per funding period
• $600 million per funding period
• $650 million per funding period
• $700 million per funding period
• $750 million per funding period
HERS-ST offers chart, table, GIS, and report functions as ways to display outputs. For this project, the GIS and chart functions were used extensively, but HERS-ST was used to calculate the values while the final maps and charts were created outside of the software. HERS-ST is a powerful economic and engineering model, but its graphical output options are limited.
Therefore Arcview GIS 9.0 was utilized to create maps, and Microsoft Excel was used to create charts.
The chart report function was used in HERS-ST to display the funding distribution for the five scenarios and to depict the effect of different funding mechanisms on the performance of the Iowa interstate system. Figure 1 depicts the total improvement cost for each funding period for the Iowa interstate system.
200 300 400 500 600 700 800
1 2 3 4
Funding Periods (1 FP = 5 yrs)
T o ta l C o s t ( in m illio n s o f $
) $100Million/year
Figure 1. Total improvement cost for Iowa interstate system by funding period for several annual constrained budget scenarios
It is evident from Figure 1 that HERS-ST can overfund a particular funding period in a constrained budget scenario if a specific highway segment meets the deficiency level
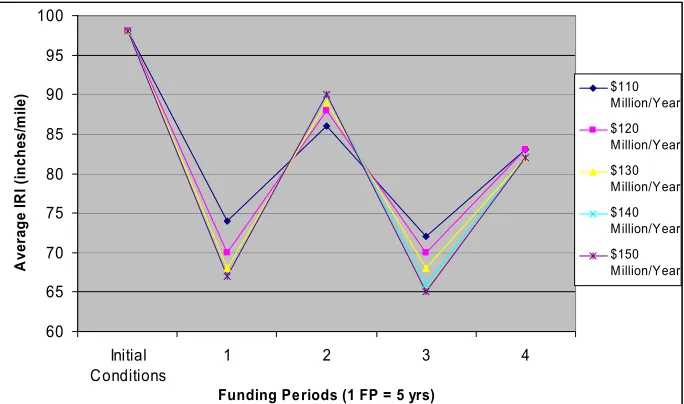
requirements. HERS-ST offers extensive output options for the performance metrics calculated for each funding period in a run scenario. Figure 2 displays the average IRI values for pavements on the Iowa interstate system.
60 65 70 75 80 85 90 95 100 Initial Conditions
1 2 3 4
Funding Periods (1 FP = 5 yrs)
A ver ag e IR I ( in ch es/ m ile
) $110Million/Year
[image:22.612.136.478.204.406.2]$120 Million/Year $130 Million/Year $140 Million/Year $150 Million/Year
Figure 2. Average IRI values for the Iowa interstate system for several annual constrained budgets
Figure 2 indicates that the $150 million annual funding scenario for the Iowa interstate system will provide a lower average IRI value than the lower funding scenarios. Figure 3 depicts the total delay for the Iowa interstate system given the five annual funding scenarios.
0.07 0.08 0.09 0.1 0.11 0.12 0.13 0.14 0.15 0.16 0.17 Initial Conditions
1 2 3 4
Funding Periods (1 FP = 5 yrs)
[image:23.612.123.492.74.294.2]T o ta l D e la y ( h rs /1 0 0 0 V M T ) $110 Million/year $120 Million/year $130 Million/year $140 Million/year $150 million/year
Figure 3. Total delay for Iowa interstate system for various funding scenarios
Figure 3 indicates that delay levels are reduced when additional amounts of funding are
dedicated to the Iowa interstate system. The chart function in HERS-ST is useful for determining the distribution of funds across funding periods, as well as how various funding scenarios affect the performance metrics on the Iowa interstate system.
A series of maps were generated in Arcview GIS 9.0 based on the improvement data generated from HERS-ST analyses. HERS-ST has a GUI driven by a Microsoft Access database.
Therefore, the improvement types were extracted from the database in Microsoft Access, brought into Arcview GIS 9.0 as a shapefile, and symbolized by the improvement types that HERS-ST designated for each segment.
The purpose of these maps was to determine the locations and types of improvements that HERS-ST recommended on the Iowa interstate system over a 20-year analysis period. A sensitivity analysis was conducted for the pavement deterioration rates because HERS-ST recommended resurfacing the same segments of interstate every three years when the normal lifespan of pavements is seven years. The improvement types that HERS-ST can recommend include resurfacing, resurfacing and adding lanes, and reconstruction.
Figure 4 depicts the improvement types identified in HERS-ST for a constrained annual budget of $130 million for the Iowa interstate system. The sections that are colored green indicate resurfacing, blue indicates a capacity improvement, and orange indicates that a reconstruction is necessary for the selected segments.
Funding Period 1
Funding Period 3
Funding Period 2
Funding Period 4 Improvement Types for Iowa Interstates
20 Year Analysis Period Budget Constrained to $130M per Year
Improvement Types
Do Nothing Resurface & Add Normal Cost Lanes
[image:24.612.73.542.72.374.2]Resurfarce Reconstruct
Figure 4. Improvement types in $130 million annual constrained budget for Iowa interstate system
It is evident from Figure 4 that the majority of the Iowa interstate system will be resurfaced in the 20-year planning period. HERS-ST also recommends capacity improvements on the I-80 corridor between Des Moines and the Illinois border, the I-35 corridor between Des Moines and Ames, and the I-380 corridor between Iowa City and Cedar Rapids.
By using HERS-ST, a user is able to derive a scenario, run an analysis, and generate maps and charts that characterize the nature of the improvements and the effect that they may have on the performance metrics of the affected corridors.
HERS-ST TRAINING SEMINAR
A HERS-ST training seminar was held on Monday, June 27, 2005. Ten employees from the Iowa DOT and the FHWA Iowa Division attended this day-long training seminar, which was
organized and administered by the principal investigator, co-principal investigator, and research assistant of the MTC HERS-ST project. The seminar was held at the Center for Transportation Research and Education at the Iowa State University Research Park in Ames, Iowa.
The training seminar began by defining the capabilities and limitations of HERS-ST, as well as the applications that are possible. Along with this introduction to HERS-ST, the presenters gave the audience insight into the ways several state DOTs are currently using the software. The second presentation introduced the technical attributes of the HERS-ST model. Specifically, the presentation explained how economic models, engineering models, and decision support tools comprise the analytical engine of HERS-ST. The third presentation provided an overview of the customization of the parameter and control data in HERS-ST that was performed to accurately depict the pavement specifications, improvement costs, and deficiency thresholds that represent the primary system throughout the state of Iowa. The fourth presentation explained how to run analyses with HERS-ST and view the results. In addition, this presentation included instructions on creating reports using the outputs of run analyses in HERS-ST.
Following lunch, the seminar attendees participated in a three-hour hands-on training seminar. Each seminar participant was given a laptop computer with the HERS-ST software installed, the Iowa primary roads dataset, and the modified control and parameter data. The hands-on session began by instructing the seminar participants to query specific segments from the Iowa primary roads dataset. Afterwards, the participants executed a constrained budget run analysis and opened the tabular output to view the results. From the results of this analysis, the participants generated charts and used GIS to create maps of the segments that were selected. At the end of the training seminar, all participants had a basic understanding of what HERS-ST is and how the software can be utilized in the long-term planning process at a state DOT.
In the upcoming months, the principal investigators will collaborate with the FHWA Office of Asset Management to develop a HERS-ST regional training seminar to be held at a location central to the Midwestern states (e.g., Kansas City). Representatives from neighboring state DOTs will be invited to attend this seminar (i.e., Minnesota, Missouri, Nebraska, Kansas, and Illinois).
CONCLUSION
The objective of this project was to become familiar with HERS-ST, customize the software for the Iowa DOT, and train employees to integrate this software into their planning, safety, and maintenance processes. Through a series of trial runs, the researchers found that more accurate analyses could be executed when the 100% Iowa primary road dataset, as opposed to the HPMS sample dataset for Iowa, was used in the HERS-ST analysis.
The report functions in HERS-ST are useful for identifying the distribution of capital between funding periods or quantifying the changes in the performance metrics when programmed improvements have been implemented. The training seminar proved to be successful in introducing Iowa DOT employees to HERS-ST and explaining to the participants how this software can be integrated into the long-range planning process. A regional HERS-ST training seminar is being planned by the principal investigators and the FHWA Office of Asset
Management.
11
REFERENCES
FHWA. 2001. Highway Infrastructure: FHWA’s Model for Estimating Highway Needs Has Been Modified for State-Level Planning. Prepared for Congress by the General Accounting Office. GAO-01-299. Washington, DC: General Accounting Office.
FHWA. 2002a. HERS-ST: Highway Economic Requirements Systems: State Version, Pilot Program 2002. Washington, DC: Federal Highway Administration.
FHWA. 2002b. Highway Economic Requirements System-State Edition Version 2.0 Technical Report. Washington, DC: Federal Highway Administration.
APPENDIX A. CHANGES MADE TO HERS-ST SAFETY PARAMETERS
[image:29.612.78.522.160.227.2]The tables in this appendix describe the modifications made to the safety parameters data.
Table A.1. Injury reduction parameter modifications
Name Definition
Default HERS-ST Value
Iowa DOT Value
[image:29.612.73.364.270.360.2]APDFPC Annual percentage decline in fatalities per crash 0 0.012 APDIPC Annual percentage decline in injuries per crash 0 -0.017 APDCR Annual percentage decline in crash rates 0 -0.007
Table A.2. Injury/crash ratio by functional class (rural)
Rural
Default
HERS Data Iowa DOT Inj/Cr Rural Freeway 0.45 0.32 Inj/Cr Rural Expressway* n/a
Inj/Cr Rural Principal Arterial 0.63 0.69 Inj/Cr Rural Minor Arterial 0.56
Inj/Cr Rural Major Collector 0.63
In Table A.2., the default HERS-ST values were used when the values were not provided by the Iowa DOT.
Table A.3. Injury/crash ratio by functional class (urban)
Urban HERS Data Iowa DOT Default Inj/Cr Urban Freeway 0.49 0.41 Inj/Cr Urban Expressway 0.36
Inj/Cr Urban Principal Arterial 0.41 0.40 Inj/Cr Urban Minor Arterial 0.34 0.34 Inj/Cr Urban Major Collector 0.35
In Table A.3, the default HERS-ST values were used when the values were not provided by the Iowa DOT.
Table A.4. Fatality/crash ratio by functional class (rural)
Default HERS -ST Data Iowa DOT
Freeway 0.01 0.01
Principal Arterial 0.02 0.02
Minor Arterial 0.01 0.01
Major Collector 0.01
[image:29.612.69.357.450.539.2] [image:29.612.67.398.626.695.2]A-2
[image:30.612.67.389.136.214.2]The fatality/crash ratio values provided by the Iowa DOT were the same as the default values in HERS-ST.
Table A.5. Fatality/crash ratio by functional class (urban)
Default HERS-ST Data Iowa DOT
Freeway 0.0038 0.0044
Expressway 0.004 0.003
Principal Arterial 0.0027 0.0027
Minor Arterial 0.0024 0.0018
Major Collector 0.0026
APPENDIX B. IOWA COST DATA USED IN HERS-ST ANALYSIS
The tables in this appendix depict the default HERS-ST cost data values and the modified values that were obtained from the Iowa DOT.
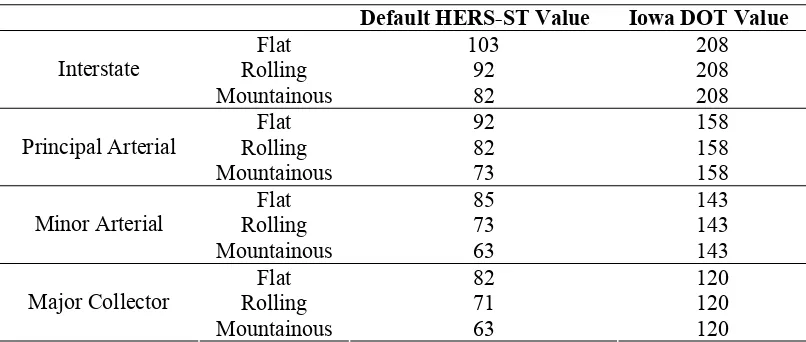
[image:31.612.67.470.217.388.2]Table B.1 depicts the default cost values in HERS-ST for rural right of way and the cost values supplied by the Iowa DOT. The Iowa DOT values were used in the analysis.
Table B.1. Rural right of way costs (in thousands of dollars) per lane mile
Default HERS-ST Value Iowa DOT Value
Flat 103 208
Rolling 92 208
Interstate
Mountainous 82 208
Flat 92 158
Rolling 82 158
Principal Arterial
Mountainous 73 158
Flat 85 143
Rolling 73 143
Minor Arterial
Mountainous 63 143
Flat 82 120
Rolling 71 120
Major Collector
Mountainous 63 120
[image:31.612.68.434.479.531.2]Table B.2 lists the default cost values in HERS-ST for urban right of way and the cost values supplied by the Iowa DOT. The Iowa DOT values were used in the analysis.
Table B.2. Urban right of way costs (in thousands of dollars) per lane mile
Default HERS-ST Value Iowa DOT Value
Freeways/Expressways 304 484
Other Divided 305 484
Other Undivided 242 234
Table B.3 shows the improvement options in HERS-ST and the abbreviations associated with these improvements.
Table B.3. Improvement options in HERS-ST
RCHC Pavement reconstruction and add high-cost lanes RCNC Pavement reconstruction and add normal-cost lanes RCWL Pavement reconstruction with wider lanes
RC Pavement reconstruction MWHC Resurface and add high-cost lanes MWNC Resurface and add normal-cost lanes MinW Resurface and widen lanes
RsSh Resurface and improve shoulders RS Resurface
CCNF Cost of constructing new facilities
[image:32.612.70.547.294.692.2]Tables B.4 and B.5 show the default cost values for urban and rural improvement options. The abbreviations shown in Table B.3 are used to describe the improvements in Tables B.4 and B.5.
Table B.4. Rural improvement costs (in thousands of dollars) per lane mile Default HERS-ST Values
RCHC RCNC RCWL RC MWHC MWNC MinW RsSh RS CCNF
Flat 1565 633 714 595 1143 398 323 221 125 2801
Rolling 1590 741 788 612 1232 424 346 233 120 3068
Interstate
Mountainous 2507 854 1044 870 1677 599 475 286 155 3732
Flat 1199 799 609 520 1143 408 315 153 78 2521
Rolling 1380 826 684 588 1232 456 348 167 78 2761
Principal Arterial
Mountainous 1786 1175 897 735 1489 851 495 228 115 3358
Flat 1041 694 469 370 1028 403 262 155 66 1145
Rolling 1261 755 590 503 1030 557 275 157 71 1243
Minor Arterial
Mountainous 1551 1021 920 661 1309 708 364 195 110 1644
Flat 1143 611 534 379 805 383 212 108 37 1040
Rolling 1117 669 648 468 975 381 223 118 43 1128
Major Collector
Mountainous 1361 896 829 646 1017 651 296 151 54 1488
Iowa DOT Values
RCHC RCNC RCWL RC MWHC MWNC MinW RsSh RS CCNF
Flat 2250 1250 100 950 1500 750 550 275 250 3000
Rolling 2250 1250 100 950 1500 750 550 275 250 3000
Interstate
Mountainous 2250 1250 100 950 1500 750 550 275 250 3000
Flat 1750 1100 900 850 1250 650 400 200 175 2750
Rolling 1750 1100 900 850 1250 650 400 200 175 2750
Principal Arterial
Mountainous 1750 1100 900 850 1250 650 400 200 175 2750
Flat 1750 950 800 600 1250 500 375 190 125 1750
Rolling 1750 950 800 600 1250 500 375 190 125 1750
Minor Arterial
Mountainous 1750 950 800 600 1250 500 375 190 125 1750
Flat 1500 850 750 600 1100 425 275 150 100 1750
Rolling 1500 850 750 600 1100 425 275 150 100 1750
Major Collector
Mountainous 1500 850 750 600 1100 425 275 150 100 1750
B-3
Table B.5. Urban improvement costs (in thousands of dollars) per lane mile
Default HERS-ST Values
RCHC RCNC RCWL RC MWHC MWNC MinW RsSh RS CCNF
Freeways 9160 3939 2889 1769 9298 4076 1716 513 238 6340
Other Divided 5447 2176 1779 1008 5825 2554 946 351 160 5707
Other Undivided 3848 1407 1546 922 4347 1905 1001 306 181 1533
Iowa DOT Values
RCHC RCNC RCWL RC MWHC MWNC MinW RsSh RS CCNF
Freeways 10000 4000 2000 1500 5500 3500 1300 400 300 5000
Other Divided 7000 3000 1500 1250 4000 2000 1000 300 250 4000