The legacy of the exclusion
of
Aboriginal people in
Australia
Leone Malamoo
A thesis submitted for the degree of Master of Philosophy
Applied Epidemiology
Australian National University
January 2017
Field Supervisor and Academic Supervisor: Dr Raymond Lovett
Academic Supervisors:
Originality statement
I hereby declare that this submission is my own work and to the best of my knowledge it
contains no materials previously published or written by another person, or substantial
proportions of material which have been accepted for the award of any other degree or
diploma at ANU or any other educational institution, except where due acknowledgement is
made in the thesis. Any contribution made to the research by others, with whom I have
worked at NSW Health or elsewhere, is explicitly acknowledged in the thesis. I also declare
that the intellectual content of this thesis is the product of my own work, except to the extent
that assistance from others in the project’s design and conception or in style, presentation or
linguistic expression is acknowledged.
Signed………
Acknowledgements
I dedicate this Bound Volume to my much-loved brother Floyd Charles Malamoo
(1962-2015) a giving, joyous, honourable and humble man who experienced,
learnt and shared much in his short life.
Respect and recognition must also be given to my mother’s baby sister, Shirvanne
Devow (nee Henaway) a beautiful, strong, no nonsense straight shooter who was
determined to be interviewed to tell her story about living with cancer.
I would like to acknowledge and thank the Australian Institute of Aboriginal and
Torres Strait Islander Studies (AIATSIS); and the National Centre for
Epidemiology and Population Health (NCEPH) at the Australian National
University (ANU).
Special recognition and many thanks to my supervisor’s Dr Ray Lovett, Dr Steph Davis, Dr Kerri Viney and Dr Phyll Dance. Dr Lovett’s teaching, insight,
generosity of spirit and intellectual honesty was welcomed - his drive and vision
for making positive changes in the health and wellbeing of Aboriginal peoples
made learning a beautiful thing.
There are many people and family to thank for their support and
encouragement - my daughter Litza Malamoo-Jib; my family Shireen & Malcolm
Malamoo, Toni & Quent, Vicki, Floyd and Annemarie; Dr Chris Lawrence;
Janice Nixon; Peter McCaffery; Sonya Parter; Stacy & Wes Dinsmore; the
Burdekin family & community; and the ancestors who sit at my shoulders. I am
grateful to them all - for without their strength, sustenance and inspiration this
Thesis Abstract
My placement as a Master of Philosophy in Applied Epidemiology (MAE)
scholar was with the Australian Institute of Aboriginal and Torres Strait Islander
Studies (AIATSIS); later based at the National Centre for Epidemiology and
Population Health (NCEPH).
In meeting my Masters requirements I conducted an epidemiology project using
mixed methods entitled ‘A community perspective of Burdekin rot’ - based on
the anecdotal reports of ‘Burdekin rot’ and the perceived higher incidence of
cancer (and death) in the Burdekin community. Analysis of cancer incidence
and geographic level analysis of Queensland Cancer Registry data was
conducted for the period 2003-2012 to ascertain whether cancer rates and
mortality rates vary between the Aboriginal and Torres Strait peoples and the
general population within each Statistical Division (SD) of Queensland.
Qualitative interviews were conducted to understand the experiences of
Aboriginal and Torres Strait Islander peoples living in the Burdekin region in
terms of cancer diagnosis, treatment and treatment outcomes.
I conducted a cross sectional study and analysis of the 2010 Australian Capital
Territory (ACT) Inmate Health Survey to determine if contact (phone and visits)
was associated with lower levels of psychological distress. Comparisons of
proportions between a range of exposure variables and the outcome variable of
psychological distress were conducted to further examine any association
Further, as a team member within NCEPH in collaboration with Qld Health I
assisted in an outbreak investigation primarily with undertaking hypothesis
generating questionnaires for an outbreak of Salmonella Saintpaul cases in Qld.
Case information was provided by Qld Health including case pathology reports.
My role in the outbreak included case interviews, data analysis comparing
current data to Qld S. Saintpaul data 2006-2014 and preparing a brief for
OzFoodNet in terms of a possible multi-jurisdictional outbreak of S. Saintpaul.
My final project to meet study requirements was the evaluation of the
Queensland Cancer Registry specifically concerning the completeness of
Aboriginal and Torres Strait Islander status data.
Other MAE program core competency components were fulfilled via a group
teaching session on measurement bias to the 2015 MAE cohort; a presentation
of the preliminary findings of the Burdekin study at the National Indigenous
Research and Knowledge Network (NIRAKN) conference 29-30 September
2015 in Adelaide South Australia (p.166-176); and developing and conducting a
Lesson from the Field (LFF) on cultural awareness and appropriate community
engagement and partnership when conducting research with Aboriginal and
Contents
Acknowledgements 3
Chapter 1: Queensland Outbreak of Salmonella Saintpaul, 2015 12
Abbreviations 13
1.1.1 Prologue 14
My Role 14
1.1.2 Lessons Learnt 15
1..1.3 Public Health Implications 15
1.1.4 Master of Applied Epidemiology requirement 16
1.2. Abstract 17
Background 17
Methods 17
Results 17
Conclusion 18
1.3 Introduction 18
1.3.1 Mode of transmission 18
1.3.2 Outbreaks 20
1.3.3. Salmonella Saintpaul 20
1.3.4. Increased S. Saintpaul cases in Queensland in early 2015 21 1.3.5. Multiple-Locus Variable number tandem repeat Analysis (MLVA) 21
1.4 Aim 22
1.5 Objectives 22
1.6. Methods 22
1.6.1 Case definition 22
1.6.2 Analysis of notifications 22
1.6.3 Hypothesis generating interviews 24
1.6.4. Ethics 25
1.6.5. Laboratory 25
1.7 Results 25
1.7.1 Descriptive analysis 25
1.7.2. Comparison with previous years 27
1.7.3 Rate 30
1.7.4 Hypothesis generating interviews 31
1.7.5. MLVA 32
1.8. Discussion 34
1.9. Limitations 37
1.10. Public health implications and recommendations 38
1.11. Conclusion 39
1.12. Recommendations 40
1.13. Acknowledgements 40
1.14. References 41
Chapter 1 Appendices 43
Appendix 1. Queensland Health Salmonella Saintpaul Case Questionnaire 43 Chapter 2: ACT Inmate Health Survey: Prisoner contact and psychological distress 52
2.1. Prologue 53
2.1.1 My Role 53
2.1.2 Lessons Learnt 54
2.1.3 Public Health Impact 54
2.2 Abstract 56
Background 56
Aim 56
Methods 56
Results 56
2.3 Introduction 57
2.4 Literature review 57
2.4.1. The global prison population and mental wellbeing 57
2.4.2. Prison health surveys in Australia 58
2.4.3. National prisoner health data 60
2.4.5. Mental Health of Australian prisoners 63 2.4.6. Impact of external contact on prisoners’ wellbeing 64
2.5. Rationale for this study 66
2.7. Objectives 67
2.8. Hypothesis 67
2.9. Methods 67
2.9.1. Study design 67
2.9.2. Participants 67
2.9.3. Analysis 67
2.9.4. Outcome variable: psychological distress 67
2.9.5. Exposure variables 68
2.9.6. Ethics 69
2.10. Results 70
IHS participants 70
Associations between external contact, inmate characteristics and mild/severe psychological
distress 72
2.11. Discussion 73
2.12. Limitations 75
2.13 Conclusions and public health implications 76
2.14. References 77
Chapter 2 Appendices 81
Appendix 1: Australian prison characteristics by jurisdiction. 81 Chapter 3: An evaluation of the completeness of Indigenous status in the Queensland
Cancer Registry (QCR) 85
3.1 Prologue 86
3.1.1 My Role 86
3.1.2 Key Lessons Learnt 87
3.13 Importance of Public Health surveillance 87
3. Abstract 88
Background 88
Objectives 88
Methods 88
Results 89
3.3 Introduction 89
3.3.1 Australian Cancer Registries 91
3.3.2 The Australian Cancer Database 91
3.3.3 National Aboriginal and Torres Strait Islander Cancer data 94 3.3.4 Description of the Queensland Cancer Registry 95 3.4 Objectives of the Queensland Cancer Registry 98
3.5 Aims of the Evaluation 98
3.6 Methods 98
3.6.1 Ethics 99
3.6.2 Analysis of QCR data 99
3.6.3 QCR Staff Questionnaire 100
3.7 Stakeholders 100
3.8 Description of the QCR system 100
3.8.1 Information collected 102
3.8.2 Data storage 103
3.8.3 Data Analysis/Data quality 103
3.8.4 Dissemination of results 104
3.8.5 QCR Classification and Coding 104
3.9 Performance of QCR in relation to Indigenous notifications 104
3.9.1 Simplicity 104
3.9.2 Flexibility 105
3.9.3. Data quality and Acceptability 105
3.9.4. Acceptability 107
3.9.5 Sensitivity 107
3.9.6 Representativeness 108
4.1.2. Lessons Learnt 120
4.1.3. Public Health Implications 121
4.1.4. Ethics 121
4.1.5. Acknowledgements 122
Master of Philosophy (Applied Epidemiology) requirement 122
4.2. Abstract 123
4.3 Introduction 125
4.3.1. Brief overview of Australian Indigenous health status 125
4.3.2. National 126
4.3.3. Queensland 126
4.3.4. Burdekin Region of north Queensland 126
4.3.5. Pesticide use in the Burdekin region 128
4.3.6. Burdekin ‘rot' 129
4.4. Aims 130
4.5. Methods 130
4.5.1. Quantitative Analysis 130
4.5.2. Qualitative Analysis 130
4.6. Results 131
Part 1: Queensland Indigenous cancer notifications, deaths rates and survival 131 Cancer notifications QLD by Indigenous status 131 4.6.1. Cancer notifications by broad cancer ICD code 134
4.6.2. Cancer mortality 141
4.6.3 Cancer survival 146
Part 2: Experiences of the Indigenous people with cancer or their experience with a family’s members cancer diagnosis and treatment in the Burdekin region of QLD 148
4.7.1 Experience of cancer diagnosis 148
4.7.2. Experiences of cancer treatment 149
4.7.3. Diagnosis journey 151
4.7.4. Contributing factors to cancer diagnosis 152
4.7 Discussion 154
Notifications 156
Mortality 157
Survival 157
Experiences of cancer diagnosis and treatment 158
Strength and limitations 159
4.8 Implications for public health 160
4.9 Conclusion 160
4.10 Recommendations 160
4.11 References 162
Chapter 4 Appendices 166
Appendix 1. NIRAKN Conference presentation, Adelaide SA 2015 166
Appendix 2: AIATSIS ethics application 177
Appendix 3: QLD Health Public Health Act – Application and Information for Researchers
for access to QCR data 185
Appendix 4: AIATSIS ethics approval 195
Appendix 5: Participant information sheet and informed consent form 197 Appendix 6: Letter of support for Ayr community 202
Appendix 7: Participant recruitment flyer 203
Appendix 8: Participant interview guide 204
Appendix 9 – Draft peer review paper: Cancer Mortality in Queensland 207 Teaching Report: Bias in interpreting Aboriginal and Torres Strait Islander Health Data
218 Lessons From the Field (LFF): community consultation for research with Indigenous
List of Figures
Figure 1: Queensland health zones ... 23
Figure 2: Queensland hospital and health services districts (Queensland Health, 2016a) ... 24
Figure 3: Queensland lab notifications of Salmonella Saintpaul from 1 January – 26 February 2015 ... 26
Figure 4: Age and sex of notified cases of S. Saintpaul in Queensland, January – February 2015 ... 27
Figure 5: Geographical distribution of S. Saintpaul notifications January - February 2015 by Zone ... 27
Figure 6: Geographical distribution of Salmonella Saintpaul cases by Zone, Jan-Feb 2010 – 2014, all of 2010-2014 compared to Jan-Feb 2015 ... 29
Figure 7: Geographical distribution of Salmonella Saintpaul cases by HHS, Jan-Feb 2010 – 2014 compared to Jan-Feb 2015 ... 30
Figure 8: Overall cases and rates of S. Saintpaul by HHS - Qld 2006-2014 ... 31
Figure 9: Overall rate of all salmonella in Queensland compared to the rate of S. Saintpaul in Queensland 2006-2014 by Hospital and Health Service (HHS) region ... 31
Figure 10: MLVA type by date of onset of case symptoms, 14 January 2015 – 11 February 2015 ... 33
Figure 11: South West HHS Queensland ... 37
Figure 12. Logistic regression mild/severe psychological distress and IHS participant characteristics (Odds ratio) ... 72
Figure 13: Relationship flowchart of cancer data between State and Territory jurisdictions, cancer programs and the Australian Cancer Database (ACD), National Statistics Clearing House (NCSCH), Australasian Association of Cancer Registries (AACR) and the cancer data custodians the Australian Institute of Health and Welfare (AIHW) ... 94
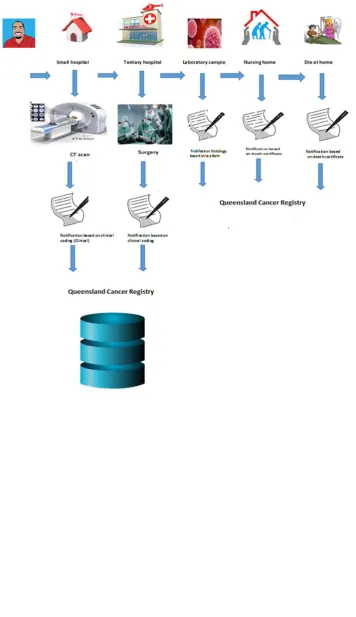
Figure 14: QCR information flow chart ... 101
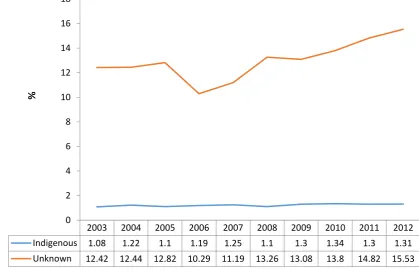
Figure 15: Proportion of Indigenous and unknown Indigenous status in QCR notifications 2003-2012 ... 106
Figure 16: Proportion of cancers (by cancer type) notified to QCR with unknown Indigenous status 2003-2012, Queensland ... 109
Figure 17: Map of mainland Australia outlining the Burdekin region ... 127
Figure 18: Burdekin Dam ... 128
Figure 19: Red Stripe Pseudomonas rubrilineans ... 129
2003-Figure 26: Cancer deaths by Indigenous status and Statistical Division (SD) Queensland 2003
... 143
Figure 27: Mean age at death Indigenous compared to non-Indigenous by Queensland Statistical Division (SD) ... 145
Figure 28: Cancer mortality by Indigenous status and age group ... 146
Figure 29: Kaplan-Meier cancer survival estimates QLD 2003-2012, by Indigenous status .... 147
Figure 30: Mean age at death Indigenous compared to non-Indigenous by Queensland Statistical Division (SD) ... 214
List of Tables Table 1. Number of notifications for Salmonella Saintpaul in Queensland: Comparison January - February 2015 to same time period 2010-2014... 28
Table 2. Notifications Salmonella Saintpaul in Queensland - Comparison between 2015 and 2010 – 2014 ... 28
Table 3. Reported food exposures for interviewed cases of S.Saintpaul Qld January - February 2015 ... 32
Table 4. Self-assessed health of prisoners 2014/2015 ... 62
Table 5. Kessler 10 score levels and the level of psychological distress (Australian Bureau of Statistics, 2012a) ... 68
Table 6. Demographic and social characteristics of participants of the Australian Capital Territory Inmate Health Survey, 2010 ... 71
Table 7: Availability of cancer data by Indigenous status and jurisdiction ... 95
Table 8: Cancer notifications (%) by broad ICD 10 code and Indigenous status 2003-2012, Queensland ... 134
Table 9: Cancer notifications by broad ICD 10 code and Non-Indigenous status 2003-2012, Queensland ... 135
Table 10: Cancer notifications (n & %) by broad ICD code by unknown Indigenous status 2003-2012, Queensland ... 136
Table 11: Cancer notifications (%) by Indigenous status, sex, marital status and statistical division (SD) 2003-2012 Queensland. ... 138
Table 12: Rate of all cancer deaths by Indigenous status and Statistical Division (SD) Queensland, 2003-2012 ... 141
Table 13: Qld cancer 2003-2012 mortality rates by Indigenous status and age group ... 144
Table 14: Availability of cancer data by Indigenous status and jurisdiction ... 154
Chapter 1: Queensland Outbreak of
Abbreviations
ACT Australian Capital Territory
CI Confidence Interval
DNA Deoxyribonucleic Acid
EpiInfo Epidemiology Software
ERP Estimated Residential Population
GP General Practitioners
HHS Hospital and health services
Qld Queensland
MAE Master of Applied Epidemiology
MLVA Multi-locus variable-number tandem repeat analysis
n Number
NCEPH National Centre for Epidemiology and Population Health
NNDSS National Notifiable Diseases Surveillance System
NSSS National Salmonella Surveillance Scheme
p Probability Value (p-value)
Qld Queensland
1.1.1 Prologue
My Role
In response to an increase in notifications of Salmonella Saintpaul in
Queensland from the beginning of January 2015 to the end of February 2015, a
team discussion via teleconference took place at National Centre for
Epidemiology and Population Health (NCEPH) between the Convenor of the
Master of Applied Epidemiology (MAE) Program, the Coordinating
Epidemiologist at OzFoodNet Australian Capital Territory (ACT), two
Queensland Health Communicable Diseases Branch epidemiologists, an
NCEPH supervisor, and two MAE scholars. The aim of this teleconference was
to discuss how MAE scholars may be able to assist in investigating factors
associated with the Salmonella Saintpaul increase.
I was a member of the team assembled by Associate Professor Martyn Kirk at
NCEPH in collaboration with Queensland Health to assist with hypothesis
generating questionnaires for Salmonella Saintpaul cases in Queensland.
I contributed to this investigation by:
• signing off on documents which would allow me to conduct interviews on behalf of Queensland Health
• acknowledging roles and responsibilities of supervisory team members
• compiling an outbreak investigation plan
• conducting hypothesis generating interviews with cases
• providing a brief to OzFoodNet in relation to a possible multi-jurisdictional outbreak of Salmonella Saintpaul
• providing a descriptive analyses of S. Saintpaul cases in Queensland comparing current data to previous years (2010-2014) reporting outputs
to Queensland Health
Prior to commencing the interviews my MAE colleague and I drew up an outbreak
investigation hypothesis generating plan (Appendix 1).
We reviewed the OzFoodNet national hypothesis generating case questionnaire,
▪ Takeaway outlets and grocery store access;
▪ A brief introductory script was developed used as epidemiology registrars
based at the Australian National University acting on behalf of
Queensland Health; and
▪ A brief introductory script was developed and used for case treating
doctors and parents of child cases.
1.1.2 Lessons Learnt
I learned the importance of epidemiological investigations to:
• rapidly quantify outbreaks;
• update questionnaires to include relevant data for example, extra foods and regional food outlets;
• collect data on Aboriginal and Torres Strait Island case status on health department and pathology forms (recognising the impact of identification
of Aboriginal and Torres Strait Islander status on Aboriginal and Torres
Strait Islander health, communities and health promotion initiatives)
• rapid response by GPs and labs in outbreak investigations greatly assists case recall when conducting hypothesis generating interviews -
increasing the possibility of identifying an outbreak and an outbreak
source
• Limitations due to lack of knowledge into various strains of S. Saintpaul and geographic spread
1..1.3 Public Health Implications
• Through following up individual cases we reassured members of the
public that Queensland health were actively seeking a source for their
infection.
• Through making sure that Aboriginal and Torres Strait Islander identification was included on the health department outbreak
questionnaires this provides improved data on Aboriginal and Torres
Strait Islander health. This is important because Aboriginal and Torres
Strait Islander peoples have higher rates of Salmonella than the general population. It is important to have good data on this to target public
health awareness and implications for Aboriginal and Torres Strait
routes of salmonella such as foodborne transmission (especially
awareness in terms of refrigerating foodstuffs for example, chicken and
cold meats on hot days). This issue generally highlights the need for
better Aboriginal and Torres Strait Islander identification via other means
such as pathology forms, GP, and hospital records and documentation
(as per the national guidelines) (Australian Institute of Health and
Welfare, 2010).
1.1.4 Master of Applied Epidemiology requirement
This chapter is included in my thesis to fulfil the requirements of the Master of
1.2. Abstract
Background
In early February 2015 Queensland Health reported fifty-nine (59) Salmonella Saintpaul (S.Saintpaul) notifications for January 2015, compared to the median of between 20-30 cases per month in previous years. This information provided
the impetus for further investigation of a possible outbreak of S.Saintpaul and Master of Applied Epidemiology scholars were asked to assist with this
investigation,
Methods
The study was a case series. Hypothesis generating interviews were conducted
in early February with case records received from Queensland Health. The case
information was provided via email in Microsoft ®Excel format and PDF copies
of case pathology forms.
Initial contact via phone was made with case General Practitioners (GPs) as a
common courtesy to inform them of our intention to contact their patients.
Cases were interviewed using a modified outbreak investigation questionnaire.
Multiple-Locus Variable number tandem repeat Analysis (MLVA) tests were
conducted during the hypothesis generating interviews. A data analysis was
also conducted to compare cases of S. Saintpaul in Queensland from early January 2015 to end of February 2015 by person, place and time with cases
from the previous five years.
Results
Twenty-three cases were interviewed over a ten day period in early February
2015. The hypothesis generating interviews highlighted that two thirds (65%) of
cases reported exposure to fresh chicken and carrots. MLVA tests of cases
revealed eight (8) separate strains of MLVA. During the months of January and
February 2015 compared to January and February 2010-2014 - there was a
54% increase in S. Saintpaul cases (n=111) compared to (n=60); the
percentage of male cases increased to 60% in 2015 from 50% in 2010-2014.
The median age increased from 13 years in 2010-2014 to 20 years in 2015; and
the Central zone of Queensland had the highest percentage of cases (44%) for
Conclusion
It was not possible to identify a specific source for this outbreak of Salmonella. Saintpaul. MLVA tests revealed there was no common source in this outbreak
however there is further need for research on the variability of MLVA among
S.Saintpaul in outbreaks.
1.3 Introduction
Salmonellosis is a bacterial disease usually manifested by acute inflammation
of the small intestine and colon with sudden onset of headache, abdominal
pain, diarrhoea, nausea and sometimes vomiting. Dehydration among elderly
and infants may ensue and can lead to acute illness. There are approximately
2500 known serotypes of Salmonella, a small number of which account for the majority of human infection (Heymann, 2008).
Salmonella bacteria are found in humans, wild animals, farm and pet animals and birds, particularly chicken (State Government of Victoria, 2015).
Salmonella infection of chickens is common, the bacteria can often be found in raw chicken meat and on eggs.The incubation period of salmonellosis is
usually between six to 72 hours, meaning that exposure to the pathogen usually
occurs during this time. Illness usually lasts for a few days but Salmonella bacteria may be present in the faeces for a number of weeks or longer
(Heymann, 2008).
1.3.1 Mode of transmission
Person-to-person transmission or animal-to-person spread of salmonellosis is
via the faecal-oral route. Ingestion of Salmonella via contaminated or improperly cooked foods can also occur. The main foods that have been implicated as
vehicles of Salmonella transmission are:
• Raw or inadequately cooked eggs and egg products
• Raw milk or raw milk products
• raw fruits and vegetables contaminated during growing, harvesting or preparation process and;
• Some shellfish and filter feeders i.e. oysters (Queensland Health, 2016b; State Government of Victoria, 2015)
When raw meat or eggs are not cooked properly the bacteria may survive and
infect those who eat it. The process of thoroughly cooking meats and poultry
including eggs will kill Salmonella bacteria (State Government of Victoria, 2015).
The bacteria may also be spread by cross contamination i.e. from something
that is contaminated with bacteria to something that is not. For example,
cooked food may be contaminated by raw or undercooked foods or meat that
are colonised with Salmonella. Therefore standard public health advice is that raw foods should be handled and stored separately from cooked or ready-to-eat
foods, and kitchen tools such as chopping boards, blenders, and mixers used to
prepare raw foods must be meticulously washed before being reused. (State
Government of Victoria, 2015).
Salmonella bacteria is also widely distributed in domestic and wild animals, prevalent in food animals such as poultry, pigs, cattle; and in pets, including
cats and dogs, birds and reptiles such as turtles (World Health Organization,
2016)
Salmonellosis can also spread via the person to person. For example, If people
do not wash their hands properly after going to the toilet or changing nappies of
infected infants, they can spread the bacteria to surfaces which may be touched
by other people or infect food which may be eaten by other people (State
Government of Victoria, 2015).
The period of communicability through the course of infection is unpredictable,
usually several days to several weeks. A temporary carrier state sometimes
continues for months, especially in infants and 1% of infected adults and 5% of
children under 5 excrete the organism for >1year. Antibiotics can extend the
1.3.2 Outbreaks
Salmonella outbreaks are typically due to foodborne sources, however
waterborne outbreaks have been reported due to a wide range of contamination
by animal sources such as bird droppings, lizards - including geckos and other
reptiles, amphibians - frogs and toads, reptiles, bovine, ovine, porcine, equine,
canine, avian and marsupial species (Taylor, Sloan, Cooper, Morton, & Hunter,
2000). According to Australian Department of Health, foodborne salmonellosis
was estimated to have increased from 28,000 annual infections in 2000 to
39,600 annual infections in 2010; a rate increase of 24% from 1,500 cases per
million to 1,850 cases per million annually (Glass, Ford, Brown, & Hall, 2014).
The most commonly reported Salmonella serotype, that accounted for 48% of all Salmonella notifications, was Salmonella Typhimurium (OzFoodNet Working Group, 2011b).
OzFoodNet sites reported 1,719 outbreaks of gastrointestinal illness affecting
29,839 people causing 872 people to be hospitalised, with 103 associated
deaths. The majority 1,352 (79%) of outbreaks were attributed to
person-to-person transmission, while 151 (9%) were suspected or confirmed foodborne.
Salmonella was the most common aetiological agent identified in foodborne outbreaks, with restaurants the most commonly reported food preparation
setting (OzFoodNet Working Group, 2011b). In Australia, Salmonella outbreaks
are most frequent in summer and spring (September to February) (Kirk et al.,
2011).
1.3.3. Salmonella Saintpaul
S. Saintpaul is a serovar of Salmonella. S. Saintpaul infections are more
widespread in the northern parts of Australia, such as Queensland (Qld) and the
Northern Territory (NT) and comparatively rare in other states (Taylor et al.,
2000).
Northern Territory and Queensland were the only two states to report S. Saintpaul in 2008 and 2009. In 2008 Northern Territory had 38 cases;
According to National Salmonella Surveillance Scheme (NSSS) reports, S. Saintpaul falls consistently among the top 10 serovars in Australia; with Queensland accounting for around two thirds of Australia’s overall reported
cases (Taylor et al., 2000).
1.3.4. Increased S. Saintpaul cases in Queensland in early 2015
In January 2015 Queensland Health reported an increase in S. Saintpaul notifications. This information led to the identification of a potential outbreak of
S. Saintpaul and provided the momentum for further investigation.
At the time there were also increased cases notified in Western Australia
(Western Australia, New South Wales, Victoria and South Australia) and no
point source had been determined. In order to identify a source all jurisdictions
agreed to undertake hypothesis generating interviews.
1.3.5. Multiple-Locus Variable number tandem repeat Analysis (MLVA)
In addition to the hypothesis generating interviews, all jurisdictions agreed to
further laboratory testing of isolates using Multiple Locus variable-number
tandem repeat analysis (MLVA).
MLVA is extensively used to assess the molecular fingerprint of
micro-organisms such as bacteria. It is a method used to perform molecular typing of
certain microorganisms, and it uses the naturally occurring difference in the
number of tandem repeated DNA sequences found in a number of different loci
in the genome of a range of organisms (National Institute for Public Health and
the Environment, 2016).
The method comes from forensic science where it is used for DNA fingerprinting
in samples from human origin. The molecular typing profiles are used to:
• study transmission routes;
• assess sources of infection; and
• assess the impact of human intervention, such as vaccination and use of antibiotics on the composition of bacterial populations (National Institute
for Public Health and the Environment, 2016).
Performing MLVA early in an outbreak has the advantage of determining
1.4 Aim
• To investigate the increase in S. Saintpaul notifications in Queensland in January and February 2015 and recommend appropriate public health
actions
1.5 Objectives
• To analyse notifications of S. Saintpaul from early January 2015 to end of February 2015 by person, place and time and compare these
characteristics with the previous five years
• To compare rates of S. Saintpaul in Qld by location, to rates of overall Salmonella in Qld
• To conduct descriptive analysis of data from cases notified to
Queensland Health from beginning of January to end of February 2015
• To identify potential sources of infection through hypothesis generating interviews
1.6. Methods
1.6.1 Case definition
A case was considered anyone with laboratory confirmed Salmonella Saintpaul infection in Queensland with onset after January 1st 2015.
1.6.2 Analysis of notifications
The age and sex distribution of cases from beginning of January to end of
February 2015 were compiled. These were compared to notifications of S. Saintpaul for the same time distribution (i.e. January to February) for the
previous 5 years, and then to notifications for the whole of the previous 5 years.
Geographical distribution of cases was also examined, and then compared to
previous years by examining the zones and Hospital Health Service (HHS)
• North, comprising of: Cairns and Hinterland HHS; Mackay HHS; Townsville HHS; Torres and Cape HHS; North West HHS
• Central, comprising of: Central Qld HHS; Central West HHS; Metro North HHs; Sunshine Coast HHS; Wide Bay HHS
• South, comprising of: Darling Downs HHS: Gold Coast HHS; Metro South HHS; South West HHS; West Moreton HHS
To further investigate the geographical distribution I calculated rates for S. Saintpaul and for all Salmonella by HHS from 2006 - 2014, using Estimated Residential Population (ERP) data obtained from Queensland Health. Data
were analysed and figures created using Microsoft®Excel. It was practical and
appropriate to use Microsoft®Excel as data was received from Qld Health in this
[image:23.595.109.449.326.660.2]format.
Figure 2: Queensland hospital and health services districts (Queensland Health, 2016a)
1.6.3 Hypothesis generating interviews
Introductory telephone scripts were developed for GPs and cases. A draft
questionnaire for this outbreak (supplied by Queensland health) was compared
with the existing OzFoodNet hypothesis generation questionnaire for
• Medical and diagnostic information
• Clinical details i.e. symptoms, date of onset, etc.
• Exposure information
o Travel history
o Attendance at social events/functions
o Food outlets
o Meat, poultry and egg consumption
o Animal and environmental exposure
o Water consumption and contact
The questionnaire asked about exposures on day of illness and 3 days prior.
Case notification data were provided by Queensland Health in Microsoft®Excel
format, and laboratory results with case contact details were supplied.
Interviews commenced on 29 January 2015. My initial contact with GPs was via
a courtesy phone call using the introductory script to inform them that as a
representative of Queensland Health I would be contacting the patient for
interview.
Cases were interviewed using the questionnaire (Appendix 1). Cases were
interviewed via telephone beginning with those cases with the most recent
notifications date.
1.6.4. Ethics
Information collected for the hypothesis generating interviews was done so
under the provisions of Health Services Act 1991 (Qld) Deed Poll of Confidentiality and Privacy, and therefore this study did not require ethics approval (Queensland Health, 2013).
1.6.5. Laboratory
MLVA typing was undertaken by Qld Health reference laboratory for all isolates
from cases with dates of onset from 14 January 2015 -11 February 2015.
1.7 Results
1.7.1 Descriptive analysis
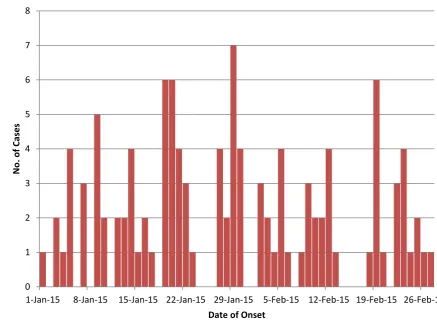
Queensland health did not require further assistance. The epi curve is shown in
Figure 3.
Figure 3: Queensland lab notifications of Salmonella Saintpaul from 1 January – 26 February 2015
Age and sex distribution of all notified cases (n=111) for January and February
2015 is shown in Figure 4.This indicates that the bulk of cases (n=26) were
males aged 0-4 years. Geographical distribution of cases is shown in Figure 5;
this shows the majority of cases (n=48, 44%) were from the central zone (which
covers Central Qld HHS; Central West HHS; Metro North HHs; Sunshine Coast
HHS; and Wide Bay HHS).
0 1 2 3 4 5 6 7 8
1-Jan-15 8-Jan-15 15-Jan-15 22-Jan-15 29-Jan-15 5-Feb-15 12-Feb-15 19-Feb-15 26-Feb-15
N
o
. o
f Cases
Figure 4: Age and sex of notified cases of S. Saintpaul in Queensland, January – February 2015
Figure 5: Geographical distribution of S. Saintpaul notifications January - February 2015 by Zone
1.7.2. Comparison with previous years
The total notifications (n=111) for January and February 2015 was higher than
the median number of 60 for this time period during the previous five years
(2010-2014); an increase in notifications of 54% (Table 1).
0 5 10 15 20 25
Under 12 months
1-4 5-9 10-14 15-24 25-44 45-64 65 +
Co
u
n
t
Age group
Male
Female
CENTRAL
NORTH
[image:27.595.119.491.359.565.2]Table 1. Number of notifications for Salmonella Saintpaul in Queensland: Comparison January - February 2015 to same time period 2010-2014
Variable 2015 (n=111) 2010-2014 (n=1046)
(median)
Notifications: January 67 23
Notifications: February 44 34
TOTAL Jan/Feb 111 60
The median age in 2015 compared to previous years notifications age
increased from 13 years to 20 years, with a considerable increase in male
cases from 50% to 60%. Age distributions were similar between 2015 and the
comparison periods (Table 2).
Table 2. Notifications Salmonella Saintpaul in Queensland - Comparison between 2015 and 2010 – 2014
Variable Jan Feb 2015
(n=111)
Jan-Feb 2010-2014
2010-2014 (n=1046)
Median Age
(years)
20 14 13
Under 12 months (%) 7 13 13
1-4 years 23 24 24
5-9 years 11 7 9
10-14 years 5 5 6
15-24 years 12 10 9
25-44 years 19 20 18
45-64 years 14 12 13
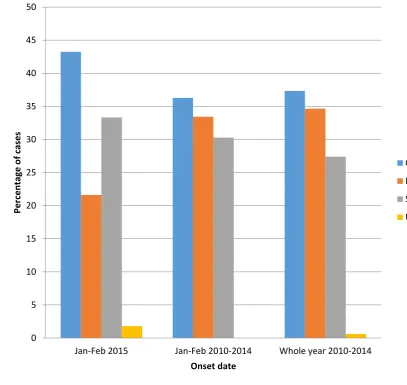
2015 (44%) than in previous years of cases from 2010-2014 (36%) in total and
for the first two months of each year. The proportion of cases from the Northern
zone was lower (Figure 6).
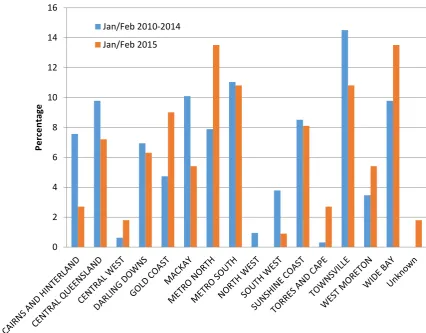
In terms of HHS district, the majority of cases January – February 2015 were
from the Metro North and Wide Bay HHS districts (n=15, 14% from each)
followed by Metro South and Townsville (n=12, 11% from each). This was a
comparison to the previous 5 years where the majority of cases were from
[image:29.595.115.523.253.638.2]Townsville (15%) followed by Metro South (11 %) (Figure 7).
Figure 6: Geographical distribution of Salmonella Saintpaul cases by Zone, Jan-Feb 2010 – 2014, all of 2010-2014 compared to Jan-Feb 2015
0 5 10 15 20 25 30 35 40 45 50
Jan-Feb 2015 Jan-Feb 2010-2014 Whole year 2010-2014
Per
ce
n
tage
o
f c
ases
Onset date
Central
North
South
Figure 7: Geographical distribution of Salmonella Saintpaul cases by HHS, Jan-Feb 2010 –
2014 compared to Jan-Feb 2015
1.7.3 Rate
Although Townsville HHS had the highest number of cases (318) for years
2006-2014, the highest overall rate is in the South West HHS region of
Queensland with an overall rate of 300 per 100,000 per year (Figure 8).
By HHS, the rate of S. Saintpaul closely tracks the pattern of the rate for all types of Salmonella notifications in Queensland. The overall rate of all types of Salmonella in Queensland are highest in the North West HHS and Central West HHS while the highest overall rate of S. Saintpaul is in the South West HHS followed by Townsville HHS (Figure 9).
0 2 4 6 8 10 12 14 16
Per
ce
n
tage
Hospital & Health Services (HHS) Districts
Jan/Feb 2010-2014
Figure 8: Overall cases and rates of S. Saintpaul by HHS - Qld 2006-2014
Figure 9: Overall rate of all salmonella in Queensland compared to the rate of S. Saintpaul in Queensland 2006-2014 by Hospital and Health Service (HHS) region
1.7.4 Hypothesis generating interviews
There were 23 hypothesis generating interviews conducted, with nine (9)
undertaken by me. I initially contacted GPs and then cases; all GPs responded
within 48 hours. Cases were all interviewed within 24 hours of their GP being
contacted. All nine cases were contacted and consented to be interviewed.
5 10 15 20 25 50 100 150 200 250 300 350 N o tif ic ation s R ate p e r 100, 000 HHS
Notifications S.Saintpaul Rate S.Saintpaul
5 10 15 20 25 0 50 100 150 200 250 R ate S .S ai n tp au l p e r 100, 000 R ate all Salmo n ell a p e r 100, 000 HHS
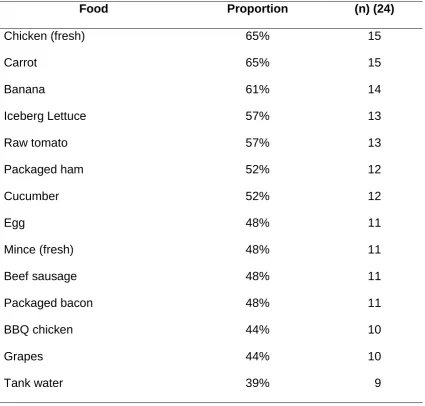
[image:31.595.117.551.376.609.2]Food exposures from the hypothesis generating interviews indicated the most
[image:32.595.115.541.138.544.2]commonly consumed foods were chicken and carrots (65%) (Table 3).
Table 3. Reported food exposures for interviewed cases of S.Saintpaul Qld January - February 2015
Food Proportion (n) (24)
Chicken (fresh) 65% 15
Carrot 65% 15
Banana 61% 14
Iceberg Lettuce 57% 13
Raw tomato 57% 13
Packaged ham 52% 12
Cucumber 52% 12
Egg 48% 11
Mince (fresh) 48% 11
Beef sausage 48% 11
Packaged bacon 48% 11
BBQ chicken 44% 10
Grapes 44% 10
Tank water 39% 9
1.7.5. MLVA
There were 8 different strains of MLVA identified among cases interviewed
during the hypothesis generating interviews. The results of the MLVA tests are displayed in Figure 10 (note that the ‘other category’ contains 6 separate
Figure 10: MLVA type by date of onset of case symptoms, 14 January 2015 – 11 February 2015 0 1 2 3 4 1/1 4/20 15 1/1 6/20 15 1/1 8/20 15 1/ 2 0/ 20 15 1/2 2/20 15 1/2 4/20 15 1/2 6/20 15 1/2 8/20 15 1/ 3 0/ 20 15 2/1 /201 5 2/3 /201 5 2/5 /201 5 2/7 /201 5 2/ 9 /2 01 5 2/1 1/20 15 N o . o f n o tif ic ation s
Date of onset
1.8. Discussion
This report describes the initial investigations into an increase in S. Saintpaul in January and February in Queensland, as part of a larger increase in S.
Saintpaul notifications in other jurisdictions, in 2015 for which no common
source was found.
As with any increase in notifications, it is necessary to ask from the outset
whether this was likely to be a real increase of disease or an artefactual
increase in notifications. In this case the increase was more likely to be real
disease as there was no known change in the laboratory technique used to test
for Salmonella, nor was there any reason to think that more tests were being conducted as the cases had a wide demographic and geographic distribution.
Our hypothesis generating interviews however, did not identify an associated
exposure of S. Saintpaul infection. While the highest frequency exposures reported by cases (chicken and carrots) could be considered as plausible
vehicles of S. Saintpaul, it is impossible to tell if these are associated with illness without knowing the exposure in the general population (Taylor et al.,
2000).
While Salmonella outbreaks overall are most frequently associated with eggs,
outbreaks of S. Saintpaul in Australia have been associated with a variety of food sources including the consumption of boiled eggs, rockmelon, untreated
drinking water and bean sprouts. (Munnoch, Ward, Sheridan, Fitzsimmons,
Shadbolt, Piispanen, Wang, Ward, Worgan, Oxenford, et al., 2009). On an
international level, S. Saintpaul outbreaks have been attributed to the consumption of paprika and paprika-flavoured potato chips, bean sprouts,
hospital prepared formula and mangoes (Beatty, LaPorte, Phan, Van Duyne, &
Braden, 2004).
The differing MLVA strains appear to provide further evidence that there was no
common source for this outbreak. However, this cannot be conclusively stated
variation between MLVA strains in this outbreak and the fact that the MLVA
variability of S. Saintpaul is not well studied, the MLVA types in this outbreak could not be determined to be related. More research is required on MLVA
types of S. Saintpaul to determine whether point source outbreaks can contain different but related MLVA types.
A hypothesis I initially considered was that the increased notifications of S. Saintpaul were due to environmental contamination; specifically due to climate
variability and its effects on recreational and potable water sources. The
reasons I considered this were: 1) The lack of an obvious identified point source
or other vehicle of infection through the hypothesis generating interviews 2)
ecological characteristics of S. Saintpaul and 3) the climate in Queensland during 2014 and early 2015.
In terms of ecological characteristics of S. Saintpaul; while waterborne disease outbreaks are seldom reported in association with drinking water (Dale et al.,
2010) previous outbreaks of S. Saintpaul have shown that water can act as a vehicle of transmission for this serotype. For example Taylor et al. (2000)
reported an outbreak of S. Saintpaul in workers at a remote construction site in Central Queensland which involved 28 cases overall. The researchers found
through microbiological sampling, reinforced by epidemiological results,
compelling evidence that the outbreak of S. Saintpaul was most likely caused by a contaminated water supply (tanks) in which live green tree frogs lived
(Taylor et al., 2000).The Qld town of Roma, situated in the South West HHS,
has also had a previous waterborne S. Saintpaul outbreak attributed to the access of abattoir effluent to an unchlorinated drinking water bore casing.
(Water Quality Research Australia, 2012) . In addition, a study conducted in
north-east Spain investigated the incidence of serotypes of Salmonella in three types of environmental water (sea, river and fresh reservoirs). The study
performed at specific sampling locations during the summer for a period of five years (1992–1996), it was observed that S. Saintpaul existed in all types of environmental water (Polo et al., 1998).
It is also interesting that the highest rates of S. Saintpaul occur in the South-West HHS (compared with Salmonella overall, for which rates are highest in
North West Queensland). The South West HHS, which sits in the central zone,
district services an area of 319,870 square km with an estimated population of
27,000 people (see Figure 11). (Queensland Government, 2016).
In 2009, 2010, 2013 and 2014, South West HHS had the highest rates for S. Saintpaul, and in 2011 and 2012 South West HHS had the second highest rates
for S. Saintpaul – highlighting the fact that the South West HHS is consistently and constantly affected by S. Saintpaul in the five year 2009-2014 timeframe. In this area a higher proportion of the population either use tank water alone, or a
combination of town water and tank water as potable water (pers obs). This is particularly the case for people living in Aboriginal and Torres Strait Islander
communities in this HHS, as well as other areas of the central zone (pers obs). Interestingly two cases, a man and his son-in-law who lived in close proximity to
each other in the Kingaroy/Wondai area, who had identical MLVAs stated that
they both drank untreated tank water from the same source during their
incubation periods, although they also shared a meal of shepherd’s pie during
this period. Although this is not direct evidence of waterborne S. Saintpaul, it does provide one plausible source.
In terms of climatic variability, Queensland experienced a dry year in 2014 with
rainfall 10% below average overall. This was followed by several high rainfall
events during the period of the outbreak (January and February) (Bureau of
Meteorology, 2016).
Given this I hypothesised that there may have been an increase in waterborne
transmission of S. Saintpaul via tank water, due to roof-harvested water and other collection points contaminated by faeces from birds or other animals.
Other outbreaks of Salmonella have resulted via these means (Ashbolt & Kirk,
2006; Franklin et al., 2009; Heyworth, Glonek, Maynard, Baghurst, &
Finlay-Jones, 2006; Koplan, Deen, Swanston, & Tota, 1978; Taylor et al., 2000), and it
has been previously reported that the quality of tank water decreases after
severe and extended drought conditions followed by a major rain event (Yaziz,
1989). Whilst this climatic variability hypothesis is appealing there is no direct
seems that there is a need for health promotion in terms of the potential health
risks of personal water storage tanks used for potable water purposes.
Figure 11: South West HHS Queensland
1.9. Limitations
A major limitation of the hypothesis generating interviews was the time interval
between laboratory tests, case notification and interview. This was due to the
lack of human resources at Qld Health to conduct the hypothesis generating
interviews early. Many of the early cases were contacted on average 2-3 weeks
after diagnosis increasing recall bias for items on the hypothesis generating
interview questionnaire.
Another limitation was that we did not systematically collect data on other
potential exposures such as tank water, bore water, private and public
swimming pools. Intriguingly, the majority of cases I interviewed (7/9) reported
swimming daily and/or had exposure to tank water. However, as mentioned
above a major limitation of this investigation was the lack of a comparison group
inherent to hypothesis generating interviews. Therefore we were unable to
compare exposures between cases and non-cases, including to water activities
would have been a case control study due to the wide geographical spread of
cases and lack of a defined cohort.
In this situation, as there were no implicated foods a traceback investigation
was not necessary. If it had been, a traceback investigation would include
examining the distribution pathway for implicated food items associated with the
cases, or investigations to determine whether food handlers were ill before
cases onset of illness to identify practices in food preparation, handling and
storage also, food samples along the distribution chain for example packing
facilities and farms to determine a possible source of contamination (Behravesh
et al., 2011).
No environmental sampling was conducted as part of this investigation. While
there was no implicated water source in this outbreak, if there were unlimited
resources it would be of interest to conduct bacteriological analysis of water
sources such as water tanks, bores and private and public swimming pools
used by cases in the Central zones of Qld.
A final limitation of this investigation was the use of a very specific, laboratory
confirmed case definition for S. Saintpaul. This is likely to have led to selection bias whereby the majority of cases in the community would not have been
included in the investigation as they would have either not presented for health
care, or would not have been tested. This type of bias is common in outbreak
investigations, and can be overcome by active case finding.
1.10. Public health implications and recommendations
This investigation did not find a source for the outbreak and so no direct control
methods occurred as a result.
In spite of this an extremely important public health implication from our input
was including Aboriginal and Torres Strait Islander status on the questionnaire
used for investigating this outbreak. From the data I have seen it is unclear to
me whether Aboriginal and Torres Strait Islander status is routinely collected for
Australians and for monitoring progress in closing the gap (Australian Institute
of Health and Welfare, 2010). Our inclusion of this field on the questionnaire in
this investigation ensured better data for this investigation, and this field should
routinely be collected in all health datasets.
As discussed above the delay between notifications being received and
interviews being done with cases was a major limitation of this investigation.
This lack of timeliness was due to a lack of timeliness with notifications in
general, but also due to limited human resources at Queensland health. A
solution to this may be an emergency roster of trained interviewers (not
necessarily with a public health background) who can be on-call for surge
capacity when this need arises.
My data analysis showed that rural areas in Qld, in particular the Central zone,
have consistently higher rates of Salmonella than the rest of the state. Although
I did not analyse these data by Aboriginal status, generally Aboriginal and
Torres Strait Islander peoples have higher rates of Salmonella than the rest of the Australian population (Phillips, 2009). This highlights the need for health
promotion initiatives around communicable disease awareness in rural and
remote areas.
1.11. Conclusion
There was no common source identified for the increase in notifications.
Multiple MLVA strains found in this outbreak also supported there not being a
common source, however there is a need for further research on the variability
of S.Saintpaul MLVA in outbreaks. A hypothesis I considered plausible was climate variability however there is no direct evidence for this. The effects of
climate variability on water sources is also plausible however this transmission
path was not explored. An important public health implication of this
investigation was the inclusion of Aboriginal and Torres Strait Islander status on
the hypothesis generation questionnaire. As a general health measure it seems
that there is a need for health promotion in terms of the potential health risks of
personal water storage tanks used for potable water purposes, and alternative
exposure water sources in terms of swimming pools (private and public), lakes,
1.12. Recommendations
1. That Indigenous status notification be routinely collected for all outbreaks
of Salmonella, and more broadly. Ideally this should be completed at all stages of data collection (GPs, laboratory, hospital and public health unit
documentation); including data linkage with Medicare as per
recommendations made in the National best practice guidelines for
collecting Indigenous status in health data sets (Australian Institute of
Health and Welfare, 2010).
2. Consideration should be given to developing teams within health
departments that can be deployed at short notice to conduct hypothesis
generating interviews within 2 days of Salmonellosis notifications 3. More investigation is needed into the MLVA strains for S. Saintpaul so
that we can determine the relatedness of different MLVA strains in
outbreaks of S.Saintpaul
4. There should be ongoing health promotion (e.g. annual campaigns)
about Salmonella and transmission pathways to high risk groups.
1.13. Acknowledgements
I would like to thank Queensland Health, OzFoodNet and NCEPH for the
opportunity of participating in the outbreak investigation including:
• Associate Professor Martyn Kirk
• MAE Supervisors: Dr Stephanie Davis, Dr Ray Lovett and Dr Kerri Viney
• Dr Ben Polkinghorne
• Dr Russell Stafford and
1.14. References
Ashbolt, R., & Kirk, M. (2006). Salmonella Mississippi infections in Tasmania: the role of native Australian animals and untreated drinking water,. Epidemiology Infections, 134(6), 1257-1265.
Australian Institute of Health and Welfare. (2010). National best practice guidelines for collecting Indigenous status in health data sets,. In Australian Institute of Health and Welfare (Ed.). Canberra.
Beatty, M. E., LaPorte, T. N., Phan, Q., Van Duyne, S. V., & Braden, C. (2004). A Multistate Outbreak of Salmonella enterica Serotype Saintpaul Infections Linked to Mango Consumption: A Recurrent Theme. Clinical Infectious Diseases, 38(9), 1337-1338. doi:10.1086/383156
Behravesh, C. B., Mody, R. K., Jungk, J., Gaul, L., Redd, J. T., Chen, S., . . . Williams, I. T. (2011). 2008 Outbreak of Salmonella Saintpaul Infections Associated with Raw Produce,. The
New England Journal of Medicine, 364(10), 918-927.
Bureau of Meteorology. (2016). Climate summaries archive,. Retrieved from
(http://www.bom.gov.au/climate/current/annual/qld/archive/2014.summary.shtml) Franklin, L. J., Fielding, J. E., Gregory, J., Gullan, L., Lightfoot, D., Posnanski, S. Y., & Vally, H.
(2009). An outbreak of Salmonella Typhimurium 9 at a school camp linked to contamination of rainwater tanks,. Epidemiology and Infection, 137, 434-440. doi:10.1017/S095026880800109X
Glass, K., Ford, L., Brown, K., & Hall, G. (2014). Foodborne illness in Australia: Annual incidence
circa 2010,. Canberra ACT: National Centre for Epidemiology and Population Health,
Australian National University,.
Heymann, D. L. (2008). Control of Communicable Diseases Manual (19th ed.). Washington, DC: American Public Health Association.
Heyworth, J., Glonek, G., Maynard, E., Baghurst, P., & Finlay-Jones, J. (2006). Consumption of untreated tank rainwater and gastroenteritis among young children in South Australia.
International Journal of Epidemiology, 35(4), 1051-1058. doi:10.1093/ije/dyl105
Kirk, M. D., 1,2 , Lalor, K., Raupach, J., Combs, B., Stafford, R., Hall, G. V., & Becker, N. (2011). Food and Waterborne Disease Outbreaks in Australian Long-Term Care Facilities, 2001–2008,. Foodborne Pathogens and Disease,, 8(1). doi:10.1089=fpd.2010.0648 Koplan, J., Deen, R. D., Swanston, W. H., & Tota, B. (1978). Contaminated roof-collected
rainwater as a possible cause of an outbreak of salmonellosis,. Journal of Hygiene, 81, pp 303-309. doi:10.1017/S0022172400025146
May, F. (2015). [MLVA].
Munnoch, S., Ward, K., Sheridan, S., Fitzsimmons, G., Shadbolt, C. T., Piispanen, J., . . . Oxenford, C. (2009). A multi-state outbreak of Salmonella Saintpaul in Australia associated with cantaloupe consumption. Epidemiology and Infection, 137(03), 367-374.
Munnoch, S., Ward, K., Sheridan, S., Fitzsimmons, G. J., Shadbolt, C., Piispanen, J., . . . Durrheim, D. (2009). A multi-state outbreak of Salmonella Saintpaul in Australia associated with cantaloupe consumption,. Epidemiology and Infection,, 137, 367-374. doi:10.1017/S0950268808000861
National Institute for Public Health and the Environment. (2016). Welcome to the Multiple-Locus Variable number tandem repeat Analysis home page,. Retrieved from http://www.mlva.net/default.asp
OzFoodNet Working Group. (2011a). Monitoring the incidence and cause of diseases
potentially transmitted by food in Australian Annual report of the OzFoodnet Network,
2011, . Retrieved from Canberra ACT:
OzFoodNet Working Group. (2011b). Monitoring the incidence and causes of diseases
potentially transmitted by food in Australia: Annual Report of the OzFoodNet Network,
Phillips, A. (2009). Health status differentials across rural and remote Australia,. Australian
Journal of Rural Health,, 17(1), 1440-1584. doi:10.1111/j.1440-1584.2008.01029.x
Polo, F., Figueras, M. J., Inza, I., Sala, J., Fleisher, J. M., & Guarro, J. (1998). Relationship between presence of Salmonella and indicators of faecal pollution in aquatic habitats.
FEMS Microbiology Letters, 160(2), 253-256. doi:10.1111/j.1574-6968.1998.tb12919.x
Queensland Government. (2016). Queensland Health, South West Hospital and Health Service,. Retrieved from https://www.health.qld.gov.au/southwest/
Queensland Health. (2013). Student Deed Poll. from Queensland Government publications, https://www.health.qld.gov.au/publications/portal/student-deeds/student-deed-poll.pdf
Queensland Health. (2016a). Queensland Hospital and Health Services maps,. Retrieved from https://www.health.qld.gov.au/maps/
Queensland Health. (2016b). Salmonella Infection, Queensland Health Guidelines for Public Health Units,. Retrieved from
https://www.health.qld.gov.au/cdcg/index/salmonella.asp#res
State Government of Victoria. (2015). Infectious diseases epidemiology and surveillance,. Melbourne: Victorian Government Retrieved from
http://ideas.health.vic.gov.au/diseases/salmonellosis.asp.
Taylor, R., Sloan, D., Cooper, T., Morton, B., & Hunter, I. (2000). A waterborne outbreak of
Salmonella Saintpaul,. Communicable Disease Intelligence,, 24(11), 336-340.
Water Quality Research Australia. (2012). Health Stream, Information and analysis for water and health professionals, . from WQRA
World Health Organization. (2016). Salmonella (non-typhoidal),. Retrieved from http://www.who.int/mediacentre/factsheets/fs139/en/
Yaziz, M. I. (1989). Variations in rainwater quality from roof catchments. Water research
Chapter 1 Appendices
Chapter 2: ACT Inmate Health Survey:
2.1. Prologue
The Alexander Maconochie Centre (AMC) is a correctional facility in the
Australian Capital Territory (ACT). It received its first residents on 30 March 2009
and all ACT prisoners were repatriated from New South Wales (NSW) by end of
May 2009.
The first study on inmate health conducted in the AMC was the 2010 ACT Inmate
Health Survey (IHS), which was adapted from the NSW Inmate Health Survey.
The ACT Corrections Health Program conducted the IHS with assistance from
ACT Corrective Services, Justice Health (NSW), the ACT Dental Health Program
and Mental Health ACT.
As a Master of Philosophy in Applied Epidemiology (MAE) candidate, I was
granted ethics approval by ACT Health to conduct a secondary cross-sectional
analysis of data from the 2010 ACT Inmate Health Survey. These data were used
to examine the relationship between external contact (visits and phone calls) and
psychological distress. Upon receipt of the IHS dataset I discovered that a crucial
component was missing for respondents. Sixty-four of 135 responses for
Question 9 of the Kessler 10 scale data were missing. My first approach aimed
to assess whether multiple imputation could be used to impute the missing data.
However, due to the extent of missing data (47%), and based on
recommendations from a number of statisticians consulted, the decision was
made to abandon this approach (Soley-Bori, 2013).
Data analysis is a core component of the MAE program. Therefore, to meet this
requirement, I continued with the secondary analysis on the smaller sample. I
conducted a descriptive analysis and logistic regression to examine the
association between the outcome variable (mild to severe psychological distress)
and a range of exposures; controlling for age and sex.
2.1.1 My Role
Contact was made with the data custodian at ACT Health and two meetings were
held with them to discuss the project and the data. I applied for ethics approval
from the Australian Capital Territory (ACT) Human Research Ethics Committee,
the Australian Institute of Aboriginal and Torres Strait Islander Studies (AIATSIS)
Research Ethics Committee. The ethics documentation I submitted to each of these institution’s Human Research Ethics Committees (HRECs) also included a
data analysis plan. Ethics approval was granted by all three HRECs and the data
were transferred electronically from ACT Health.
2.1.2 Lessons Learnt
This study provided the opportunity to review and develop Stata14 skills, and improve my analytical skills. The project provided the opportunity of a ‘hands on’
experience in a statistical analysis of a real health department survey dataset. I
learned to carefully inspect and format the variables into a dataset that could
provide rapid results and informative information. I discovered very quickly that
not all datasets are complete, which was very disappointing and frustrating under
the circumstances, as almost half of the study outcome variable (psychological
distress) of interest was missing (47%). After much deliberation, I along with my
supervisor considered whether imputing values for the missing data and
consulted with a few statisticians. This undertaking took quite some time and in the end proved futile. I learnt that the ‘missingness’ of data dictates the type of
analysis you conduct and with 47% of your study outcome variablemissing your
initial study aim will change and/or may be abandoned. However, another
important lesson learnt was that there is still value in the process in terms of how
to deal with so many missing data. The discovery that there were missing data
was upsetting, as I was confident that not having regular family contact, and/or
being removed or institutionalised at an early age, severely impacts
psychological distress.
2.1.3 Public Health Impact
Prisoner health is public health, as prisons are part of our communities and
prisoners are part of our society. Prisoners receive visitors, are in contact with
health care workers and other prison staff, attend outside work placements or
health care facilities, and prison personnel constantly rotate between prisons and
their communities. The majority of prisoners will ultimately leave prison and
should be a priority. For this to occur, appropriate prison health care services
need to be provided (WHO Regional Office for Europe, 2014).
The study results may have proved useful to influence policy around prisoner
contact and provide input into the ongoing discussion in relation to regular contact