Performance Model for Parallel Matrix Multiplication with Dryad:
Dataflow Graph Runtime
Hui Li, Geoffrey Fox, Judy Qiu
School of Informatics and Computing, Pervasive Technology Institute Indiana University Bloomington
Abstract
In order to meet the big data challenge of today’s society, several parallel execution models on distributed memory architectures have been proposed: MapReduce, Iterative MapReduce, graph processing, and dataflow graph processing. Dryad is a distributed data-parallel execution engine that model program as dataflow graphs. In this paper, we evaluated the runtime and communication overhead of Dryad in a realistic setting. We proposed a performance model for Dryad implementation of parallel matrix multiplication (PMM) and extend the model to MPI implementations. We conducted experimental analyses in order to verify the correctness of our analytic model on a Windows cluster with up to 400 cores, Azure with up to 100 instances, and Linux cluster with up to 100 nodes. The final results show that our analytic model produces accurate predictions within 5% of the measured results.
Keywords: Dryad, Dataflow Graph, Performance Modelling, MPI, Matrix Multiplication
1.Motivation and Background
A data deluge exists in today’s society. The rapid growth of information requires domain technologies and runtime tools to process huge amounts of data. In order to meet this big data challenge, several parallel execution models on distributed memory architectures have been proposed: MapReduce[7], Iterative MapReduce[13, 16], graph processing[10], and dataflow graph processing. The MapReduce programming model has been applied to a wide range of applications and attracted enthusiasm from distributed computing communities due to its ease of use and efficiency in processing large scale distributed data. However, MapReduce has the limitations. For example, it is not efficient to process multiple, related heterogeneous datasets, and iterative applications. Paper [13] implemented a parallel runtime for iterative MapReduce applications that outperform Hadoop in performance by several orders of magnitude. Paper [20] found that Hadoop is not efficient when processing an RDF graph pattern match that requires the joining of multiple input data streams. Dryad is a data flow runtime that models application as data flow among processes or DAGs. Dryad support relational algebra and can process relational un-structure and semi-structure data more efficiently than Hadoop.
Several sources of runtime performance degradations exist, including[22]: latency, overhead, and communication. Latency is the time delay used to access remote data or services such as memory buffers or remote file pipes. Overhead is the critical path work required to manage parallel physical resources and concurrent abstract tasks. It can determine the scalability of a system and the minimum granularity of program tasks that can be effectively exploited. Communication is the process of exchanging data and information between processes. Previous studies [19] of application usage have shown that the performance of collective communications is critical to high performance computing (HPC). The difficulty of building analytical models of parallel programs of data flow runtimes is to identify the communication behavior and model communication overhead.
In this paper, we proposed an analytical timing model for Dryad implementation of PMM in realistic settings which is more general than the settings used in the empirical and semi-empirical model. We extended the proposed analytical model to MS.MPI, and made comprehensive comparisons between Dryad and MPI implementations of the PMM applications. We conducted experimental analyses in order to verify the correctness of our analytic model on a Windows cluster with up to 400 cores, Azure with up to 100 instances, and Linux cluster with up to 100 nodes. The final results show that our analytic model produces accurate predictions within 5% of the measured results.
The remainder of this paper is organized as follows. An introduction to Dryad is briefly discussed in section 2, followed by an evaluation of the overhead of the Dryad runtime in section 3. In section 4, we present the analytical model for the Dryad and MPI implementations of the PMM application. Section 5 contains the experiments results of the proposed analytical model. Finally, we provided remarks and conclusions in section 6.
2.Dryad Overview
Architecture of Dryad
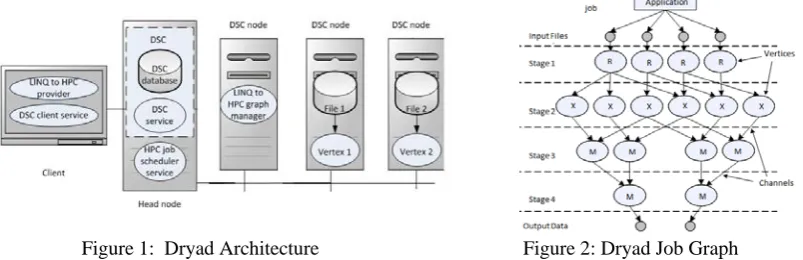
Dryad, DryadLINQ and DSC [5] are a set of technologies that support the processing of data intensive applications in the Windows platform. Dryad is a general purpose runtime and a Dryad job is represented as a directed acyclic graph (DAG), which is called the Dryad graph. One Dryad graph consists of vertices and channels. A graph vertex is an independent instance of the data processing program in a certain step. The graph edges are the channels transferring data between the vertices. DryadLINQ is the high-level programming language and compiler for Dryad. The DryadLINQ compiler can automatically translate the Language-Integrated Query (LINQ) programs written by .NET language into distributed, optimized computation steps that run on top of the Dryad cluster. The Distributed Storage Catalog (DSC) is the component that works with the NTFS in order to provide data management functionalities, such as data sets storage, replication and load balancing within the HPC cluster.
[image:2.544.68.470.447.577.2]
Figure 1: Dryad Architecture Figure 2: Dryad Job Graph
Parallel Execution Model
comprise a job. Dryad extends the standard pipe model to handle distributed applications that run on a cluster. Figure 2 illustrates the Dryad job graph for a typical Dryad job.
3.Evaluating and Measuring the Dryad Overhead
Experiment Settings
Infrastructure Tempest (32 nodes) Azure (100 instance) Quarry (230 nodes) Odin (128 nodes)
CPU (Intel E7450) 2.4 GHz 2.1 GHz 2.0 GHz 2.7 GHz
Cores per node 24 1 8 8
Memory 24 GB 1.75GB 8GB 8GB
Network InfiniBand 20 Gbps, Ethernet 1Gbps
100Mbps (reserved) 10Gbps 10Gbps Ping-Pong latency 116.3 ms with 1Gbps,
42.5 ms with 20 Gbps
285.8 ms 75.3 ms 94.1 ms
[image:3.544.47.492.136.271.2]OS Version Windows HPC R2 SP3 Windows Server R2 SP1 Red Hat 3.4 Red Hat 4.1 Runtime LINQ to HPC, MS.MPI LINQ to HPC, MS.MPI IntelMPI OpenMPI
Table 1: System Parameters of Azure Small Instances and a 32 Nodes Windows HPC Cluster Named Tempest
3.1 Overhead of the Dryad Primitives
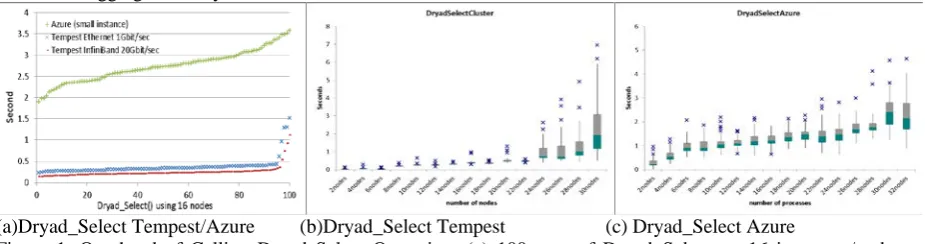
Dryad utilizes the centralized job manager to schedule Dryad tasks to Dryad vertices in order to run LINQ queries. The centralized job scheduler can create an optimized execution plan based on global information, such as resource availability, tasks status, and workload distribution. However, the downside of centralized scheduling is that the scheduling overhead will be the performance bottleneck of many fine grain tasks [11]. In order to investigate the runtime overhead of Dryad, we measured the overhead of the Select and Aggregate operations of Dryad with zero workload within the user defined function of each Dryad task. We put a timer within the user defined function, and calculated the maximum time span of all of the Dryad tasks to get an overhead of calling Select and Aggregate in Dryad.
(a)Dryad_Select Tempest/Azure (b)Dryad_Select Tempest (c) Dryad_Select Azure
Figure 1. Overhead of Calling Dryad Select Operation: (a) 100 runs of Dryad_Select on 16 instances/nodes on Azure and Tempest using 1Gbps and 20Gbps network, respectively; (b) Dryad_Select using up to 30 nodes on Tempest; (c) Dryad_Select using up to 30 nodes on Azure.
[image:3.544.39.502.397.519.2]of Dryad Select on Tempest and Azure. Figures 1(b) and (c) depict the overhead of Dryad Select with a zero workload using up to 30nodes on Tempest and up to 30 instances on Azure. Figure 1 (b) showed few high random detours when using more than 26 nodes due to a more aggregated random system interruption, runtime fluctuation, and network jitter. Figure 1(c) show more random detour than figure 1(b) due to the fluctuations in the cloud environment. In sum, the average overhead of Dryad Select on Tempest and Azure were both linear with the number of nodes and varied between 0.1 to 7 seconds depending upon the number of nodes involved. Given that Dryad is designed for coarse grain data parallel applications, the overhead of calling Dryad primitives will not be the bottleneck of application performance.
3.2 Overhead of Dryad Communication
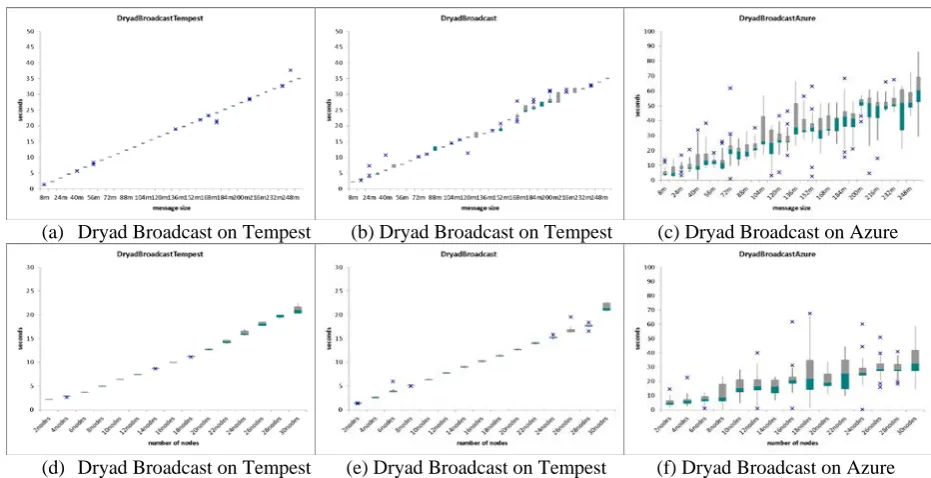
(a) Dryad Broadcast on Tempest (b) Dryad Broadcast on Tempest (c) Dryad Broadcast on Azure
[image:4.544.34.500.193.432.2](d) Dryad Broadcast on Tempest (e) Dryad Broadcast on Tempest (f) Dryad Broadcast on Azure
Figure 2: Dryad broadcast overhead using different message sizes, number of nodes, and network environments. (a) message size between 8MB and 256MB on 16 nodes on Tempest with 20Gbps network; (b) (8MB~256MB) on 16 nodes on Tempest with 1Gbps network; (c) (8MB~256MB) on 16 small instances on Azure. (d) 72 MB message broadcast to 2 to 30 nodes on Tempest with 20Gbps network; (e) 72 MB on 2-30 nodes on Tempest with 1Gbps network; (f) 72 MB on 2-30 small instances on Azure.
overhead for the Dryad broadcasting was linear with the number of computer nodes, which is not scalable behavior for message intensive applications.
4 Performance Model for Dryad and MPI Implementations of Parallel Matrix Multiplication
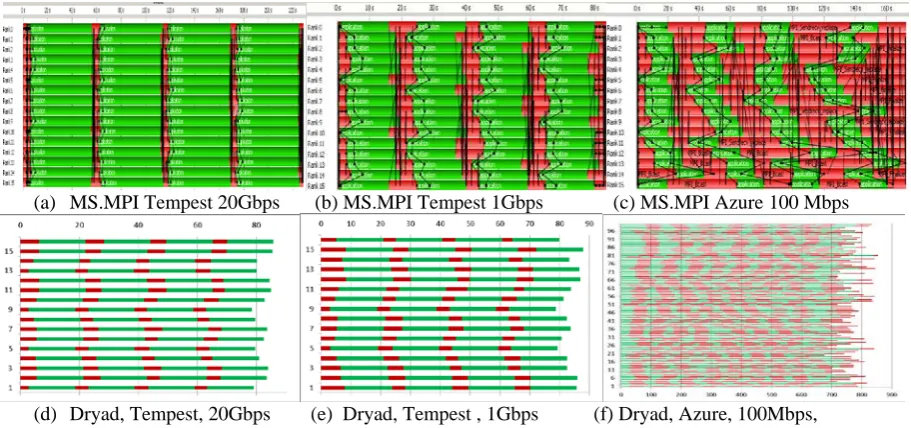
We chose the parallel matrix multiplication (PMM) application [1] to evaluate performance as PMM has well established communication and computation patterns. Figures 3(a)(b) and (c) show the communication/computation patterns of PMM using MS.MPI on Tempest and Azure. The horizontal lines are application run times and the red bar represents the collective communication operations while the green bar represents the computation operations. The MS.MPI PMM implementation has regular communication and computation patterns on Tempest, while the Dryad implementation of PMM has a less regular pattern. The results showed that the broadcast overhead of Dryad is less sensitive than that of MPI in different network environments. As shown in Figures 3(c) and (f), both the Dryad and MPI implementations of PMM have irregular communication and computation patterns on Azure due to the network jitter in the cloud. As compared to the communication overhead, the computation overhead is relatively consistent in Tempest and Azure. Thus, we need to carefully consider the communication behavior in Dryad and MPI in order to model application performance accurately.
(a) MS.MPI Tempest 20Gbps (b) MS.MPI Tempest 1Gbps (c) MS.MPI Azure 100 Mbps
[image:5.544.38.494.269.483.2](d) Dryad, Tempest, 20Gbps (e) Dryad, Tempest , 1Gbps (f) Dryad, Azure, 100Mbps,
Figure 3: communication and computation pattern of 16000x 16000 PMM jobs using different runtime environments. (a) MS.MPI on 16nodes on Tempest with 20Gbps network. (b) MS.MPI on 16nodes on Tempest with 1Gbps network. (c) MS.MPI on 16 small instances on Azure with 100Mbps network. (d) Dryad on 16nodes on Tempest with 20Gbps network. (e) Dryad on 16nodes on Tempest with 1Gbps network. (f) Dryad on 100 small instances on Azure with reserved 100Mbps network.
The matrix-matrix multiplication is a fundamental kernel whose problem model has been well studied for decades. The computation overhead increases in terms of N cubic, while the memory overhead increases in terms of N square. The workload of the DGEMM job can be partitioned into homogeneous subtasks with an even workload, and run in parallel. The regular computation and communication pattern of the homogeneous PMM tasks makes it an ideal application for our performance study of Dryad. We have already illustrated the PMM algorithm and implementation in detail in an earlier publication and technical report [4]. In this paper, we proposed a more accurate analytical timing model of PMM using Dryad and MPI, which is different from the analytical model proposed by Geoffrey Fox in 1987 [1].
sub-matrices A, B and C. We assumed that the M*M matrix multiplication jobs are partitioned and run on a mesh of √N*√N compute nodes. The size of the sub-matrices in each node is m*m, where m=M/√N. In Dryad for the implementation of PMM, we used the Select operator to spawn √N*√N Dryad tasks, each of which runs the “broadcast-multiply-rollup” cycle on every iteration of the PMM algorithm. The overhead of Dryad Select, which equals the time taken to schedule √N*√N Dryad tasks on each iteration is:
N*Tscheduling
Tscheduling is the average overhead of scheduling one Dryad task at a time. It includes the overhead that the Dryad job manager interacts with the Windows HPC cluster scheduler via COM, and with the Dryad vertices via the file pipe. After the √N*√N Dryad tasks start running, they will run the “broadcast-multiply-roll” cycles of the algorithm. In the broadcast stage, the √N*√N tasks are split into √N row broadcast subgroups each of which consist of √N tasks. As Dryad uses a flat tree algorithm for broadcasting, it takes (√N-1) sequential steps to broadcast m*m data from one task to the other √N-1 tasks within the same row broadcast subgroup. Based on the latency and bandwidth (Hockney) model, the time taken to broadcast one sub-matrix A for √N Dryad tasks within one cycle is:
Tstartup is the start-up time for the communication. (Tio+Tcomm) is the time cost to transfer one matrix element
between two Dryad vertices via the file pipe. We take Tio into account because Dryad usually uses the file pipe (NTFS temporary file) to transfer the intermediate data over the HPC cluster. Our experiment results show that the IO overhead makes up 40% of the overall overhead of point to point communication operation within Dryad. In order to build accurate analytical model, we need further determine the overlap between communication and computation of the PMM application. In the multiplication stage, the MKL BLAS program within the user-defined function can be invoked immediately after getting the input data, and there is no need to wait for the whole broadcasting process to be finished. As shown in Figure 3, some communication of one process is overlapped with the computation of other processes. In the idea execution flow, due to the symmetry of the PMM algorithm, the communication overhead of one process over √N iterations are successively: 0, m2
*(Tio+Tcomm), 2*m2*(Tio+Tcomm),
... (√N-1)*m2
*(Tio+Tcomm). Given these factors, we defined the average long term overhead of broadcasting one
sub-matrix A of one process as:
(1) The process to “roll” sub-matrix B can be done in parallel with Dryad tasks as long as the aggregated requirement of the network bandwidth is satisfied by the switch. The overhead of this step is:
(2)
The time taken to compute the sub-matrix product (including multiplication and addition) is:
(3) Before summing up the overhead list above to calculate the overall job turnaround time, we noticed that the average scheduling overhead, (N+1)/2*Tscheduling, was much larger than the communication start-up overhead, , which can be eliminated in the model. Finally, we defined the analytical timing model of the Dryad implementation of the PMM as the following formula.
(4) (5) In addition, we defined parallel efficiency and parallel overhead as in Equations 6) and 7). The deduction of Equation 6) is based on the hypothesis for the large matrices. Equation 7) shows that the parallel overhead is linear in , as can be considered consistent for different N and M.
(6)
messages that the root sends is log2N, where N is the number of processes. According to the Hockney model, the
communication overhead of the MS.MPI broadcasting is Tstart-up +log2N *m2*Tcomm. The average long-term overhead
of broadcasting one sub-matrix A of the MS.MPI implementation of the PMM is defined as the Equation (8). The job turnaround time of the MS.MPI implementation of the PMM and corresponding parallel overhead is defined as Equation (9) and (10).The deduction process is similar with that of the Dryad implementation of PMM. Table 2 summarizes the performance equations of the broadcast algorithms of the three different implementations. In order to make a comprehensive comparison, we also included an analysis for Geoffrey Fox’s implementation in 1987.
(8)
(9)
(10)
Implementation Broadcast algorithm Broadcast overhead of N processes
Converge rate of parallel overhead
Fox Pipeline Tree M2*Tcomm
MS.MPI Binomial Tree log2N*M2*Tcomm
[image:7.544.38.486.90.325.2]Dryad Flat Tree N*M2*(Tcomm + Tio)
Table 2: Analysis of Broadcast algorithms of different implementations
5 Experimental Analysis of Performance Model
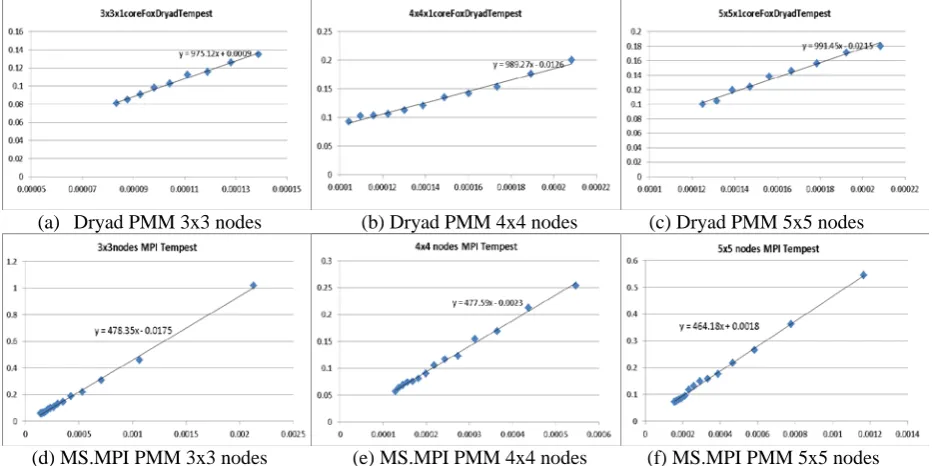
In order to verify the soundness of the proposed analytical model (Equations 7 and 9), we investigated the consistency of Tcomm/Tflops using different numbers of nodes and problem sizes. The Tcomm/Tflops was linear rising term of fitting function of parallel overhead. We measured the turnaround time of the parallel matrix multiplication jobs to calculate parallel efficiency and parallel overhead as defined in Equations 5) and 6). The sequential time of the matrix multiplication jobs is the turnaround time of sequential Intel MKL BLAS jobs.
(a) Dryad PMM 3x3 nodes (b) Dryad PMM 4x4 nodes (c) Dryad PMM 5x5 nodes
[image:7.544.36.504.422.655.2]Figures 4(a)(b) and (c) depicts the parallel overhead vs. (√N*(√N+1))/(4*M) of the Dryad PMM using different numbers of nodes and problem sizes on Tempest. The results show that parallel overhead is linear in small (√N*(√N+1))/(4*M) (large matrices) which proves the correctness of Equation 7). The error between the linear rising term plotted in Figure 4(a)(b) and (c) and the direct measurement of (Tio+Tcomm)/Tflops is 1.4%, 2.8%, and 3.08%, respectively. One should note that the linear rising term plotted in Figure 4(a)(b) and (c) include other overhead, such as synchronization, runtime fluctuation, and software latency. Overall, the communication costs will dominate those overhead as the matrices sizes increasing. Figures 4(d)(e) and (f) depicts the parallel overhead vs. (√N*((1+log2√N))/(4*M) of the MS.MPI implementation of PMM using different number of nodes and problem sizes. The error between linear rising term of fitting function plotted in (d)(e)(f) and their corresponding measurement of Tcomm/Tflops are also small than 5%. The fitting functions in Figures (d)(e)(f) indicated parallel overhead is linear in (√N*((1+log2√N))/(4*M) which proves that the function form of Equation 7) is correct. We further verify the proposed analytical timing model by comparing the measured and modelled job running times. Frist, we measured the overhead parameters, which included Tstartup, Tcommunication, Tio, Tscheduling, and Tflops as discussed in the proposed analytical model. Then we calculated the modelled job running using Equation (5) and (9) with the measured parameters. Figures 6 (a)(b)(c)(d)(e) and (f) depict the comparison between the measured and modelled results of the PMM jobs of various problem sizes using different runtime environments.
(a) Dryad 25x1 (20Gbps) (b) Dryad 25x16 (20Gbps) (c) Dryad Azure (100Mbps)
(d) MS.MPI Tempest (20Gbps) (e) IntelMPI Quarry (10Gbps) (f) OpenMPI Odin (10Gbps) Figure 6: comparisons of measured and modelled job running time using different runtime environments. (a) Dryad PMM on 25 nodes on Tempest with 20Gbps network. (b) Dryad PMM with 25nodes with 16 cores per node on Tempest with 20Gbps network. (c) Dryad PMM on 100 small instances on Azure with 100Mbps network. (d) MS.MPI PMM on 25 nodes on Tempest with 20Gbps network. (e) IntelMPI PMM on 100 nodes on Quarry with 10Gbps network. (f) OpenMPI PMM on 100 nodes with 10Gbps network.
for the multicore case. The larger relative error in Figure 6 (b) than that in Figure 6 (a) is because the faster the Tflops is the more accuracy requirement for modelling Tcomm+Tio will have. Figure 6(c) showed the same experiments using 100 small instances on Azure. The relative error showed in Figure 6(c) is much larger Figure 6(a)(b) because our model did not consider the network, runtime, OS jitter in cloud platform. For example, we found the serious network or CPU contention in several runs of our PMM jobs when there are other jobs scheduled on the same physical resources.
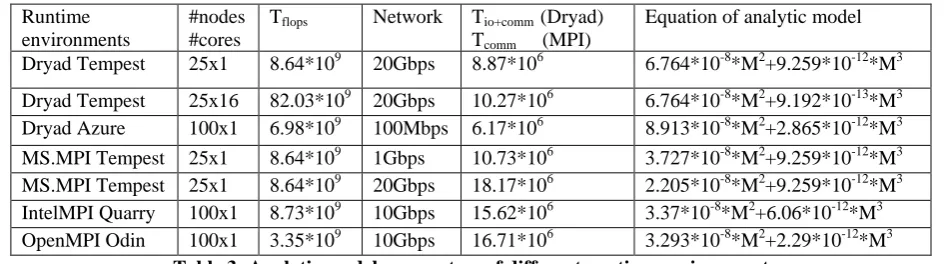
Figures 6 (d)(e) and (f) plot measured and modelled job running time of MS.MPI, IntelMPI, and OpenMPI implementations of PMM jobs using 25, 100, and 100 nodes on Tempest, Quarry, and Odin clusters, respectively. Figure 6 (d)(e) showed that the relative errors between the modelled and measured values are less than that of Dryad implementation for most larger problem sizes which further verifies the correctness of Equation (9). The higher accuracy of modelled job running time of MS.MPI and IntelMPI implementations is because the runtime latency and overhead of MPI is smaller than that of Dryad. Figure 6(f) showed the same experiments using 100 nodes on the Odin cluster. The relative error for problem size between 12000 and 48000 indicated that the proposed analytical model of OpenMPI implementation of PMM still hold when using 100 nodes as long as the aggregated network bandwidth requirement are satisfied. However, the relative error increase dramatically when problem size larger than 48000 because of the serious network contention of the OpenMPI implementation of PMM application. In fact, when using 100 nodes to run PMM jobs, there are 10 subgroups to conduct MPI_Bcast operations in parallel. Our current proposed analytical model cannot model this network contention and just consider the scenarios that network contention does not exist when running PMM jobs. Table 3 summarizes the parameters of analytical model of different runtime environments and equations of analytical model of PMM jobs using those runtime environments.
Runtime environments
#nodes #cores
Tflops Network Tio+comm (Dryad)
Tcomm (MPI)
Equation of analytic model
[image:9.544.35.508.307.439.2]Dryad Tempest 25x1 8.64*109 20Gbps 8.87*106 6.764*10-8*M2+9.259*10-12*M3 Dryad Tempest 25x16 82.03*109 20Gbps 10.27*106 6.764*10-8*M2+9.192*10-13*M3 Dryad Azure 100x1 6.98*109 100Mbps 6.17*106 8.913*10-8*M2+2.865*10-12*M3 MS.MPI Tempest 25x1 8.64*109 1Gbps 10.73*106 3.727*10-8*M2+9.259*10-12*M3 MS.MPI Tempest 25x1 8.64*109 20Gbps 18.17*106 2.205*10-8*M2+9.259*10-12*M3 IntelMPI Quarry 100x1 8.73*109 10Gbps 15.62*106 3.37*10-8*M2+6.06*10-12*M3 OpenMPI Odin 100x1 3.35*109 10Gbps 16.71*106 3.293*10-8*M2+2.29*10-12*M3
Table 3: Analytic model parameters of different runtime environment
6 Summary and Conclusion
In this paper, we discussed how to analyse the influence of the runtime and communication overhead on making the analytical model for parallel program in different runtime environments. We showed the algorithm of collective communication operations and overlap between communication and computation are two important factors when modelling communication overhead of parallel programs run on data flow graph runtime.
References:
[1]G. Fox, A. Hey, and Otto, S (1987). Matrix Algorithms on the Hypercube I: Matrix Multiplication, Parallel Computing, 4:17-31
[2]Isard, M., M. Budiu, et al. (2007). Dryad: distributed data-parallel programs from sequential building blocks. Proceedings of the 2nd ACM SIGOPS/EuroSys European Conference on Computer Systems 2007. Lisbon, Portugal, ACM: 59-72.
[3]Yu, Y., M. Isard, et al. (2008). DryadLINQ: A System for General-Purpose Distributed Data-Parallel Computing Using a High-Level Language. Symposium on Operating System Design and Implementation (OSDI). San Diego, CA.
[4]Hui Li, Yang Ruan, Yuduo Zhou, Judy Qiu and Geoffrey Fox, Design Patterns for Scientific Applications in DryadLINQ CTP, to appear in Proceedings of The Second International Workshop on Data Intensive Computing in the Clouds ( DataCloud-2) 2011, The International Conference for High Performance Computing, Networking, Storage and Analysis (SC11), Seattle, WA, November 12-18, 2011
[5]Introduction to Dryad, DSC and DryadLINQ. (2010). http://connect.micorosft.com/HPC
[6]Ekanayake, J., A. S. Balkir, et al. (2009). DryadLINQ for Scientific Analyses. Fifth IEEE International Conference on eScience: 2009. Oxford, IEEE.
[7] Characterizing the Influence of System Noise on Large-Scale Applications by Simulation
[8] Dean, J. and S. Ghemawat (2004). "MapReduce: Simplified Data Processing on Large Clusters." Sixth Symposium on Operating Systems Design and Implementation: 137-150.
[9]Apache (2010). "Hadoop MapReduce." Retrieved November 6, 2010, from http://hadoop.apache.org/mapreduce/docs/current/index.html.
[10]J. Gray, S. Chaudhuri, A. Bosworth, A. Layman, D. Reichart, M. Venkatrao, F. Pellow, and H. Pirahesh (1997). Data cube: A relational aggregation operator generalizing group-by, cross-tab, and sub-totals. Data Mining and Knowledge Discovery (1997).
[11]Malewicz, G., M. H. Austern, et al. (2010). Pregel: A System for Large-Scale Graph Processing. Proceedings of the 2010 international conference on Management of data, Indianapolis, Indiana.
[12]Li, H., Y. Huashan, et al. (2008). A lightweight execution framework for massive independent tasks. Many-Task Computing on Grids and Supercomputers, 2008. MTAGS 2008. Austin, Texas.
[13]Jaliya Ekanayake (2009). Architecture and Performance of Runtime Environments for Data Intensive Scalable Computing. Supercomputing 2009 (SC09). D. Showcase. Portland, Oregon.
[14]J.Ekanayake, H.Li, et al. (2010). Twister: A Runtime for iterative MapReduce. Proceedings of the First International Workshop on MapReduce and its Applications of ACM HPDC 2010 conference June 20-25, 2010. Chicago, Illinois, ACM.
[15]OpenMPI http://www.open-mpi.org/
[16]Judy Qiu, Scott Beason, et al. (2010). Performance of Windows Multicore Systems on Threading and MPI. Proceedings of the 2010 10th IEEE/ACM International Conference on Cluster, Cloud and Grid Computing, IEEE Computer Society: 814-819.
[17] Yingyi Bu, Bill Howe, Magdalena Balazinska, Michael D. Ernst,. (2010). HaLoop: Efficient Iterative Data Processing on Large Clusters. The 36th International Conference on Very Large Data Bases. Singapore, VLDB Endowment. 3.
[18] K.C. Li. Performance analysis and prediction of parallel programs on network of workstations. Ph.D. thesis, Department of Computer Engineering and Digital Systems, University of São Paulo, 2001.
[19] Performance Prediction Methodology for Parallel Programs with MPI in NOW Environments
[20] Performance Analysis of MPI Collective Operations, Jelena Thara Angskun, George Bosilca, Grapham E. Fagg [21] Efficient Processing of RDF Graph Pattern Matching on MapReduce Platforms
[22] Jaliya Ekanayake, Thilina Gunarathne, et al. (2010). Applicability of DryadLINQ to Scientific Applications, Community Grids Laboratory, Indiana University.