International Journal of Innovative Technology and Exploring Engineering (IJITEE) ISSN: 2278-3075, Volume-8 Issue-7, May, 2019
Abstract: This study is aimed to identify and generalize the understanding of the influence of various factors on human capital as a driver of society’s socioeconomic development. Structural and quantitative characteristics of this part of the system of human activities are provided in detail. Based on the systematic approach, the authors propose a conceptual model of human capital and the main factors, which influence it. Factors and growth potential of human capital in various periods of history have been identified and studied. The authors propose a dialectic model of evolution for the influence of various factors on human capital growth. The influence of humanity’s expanding knowledge on the growth of gross domestic product and the evolution of human capital has been presented. It has been shown that education has a key impact on human capital growth in accordance with the exponential law of years spent on education. Quantitative data on the evolution of the influence of literacy, education and science on human capital growth and prospects of further growth have been provided. In the course of the study, the authors formed a dynamic conceptual model of human capital growth, with the influence of key factors and potential substantiated on a quantitative basis. The novelty of this study is associated with the integral system-based quantitative consideration of labor with human capital as its structural core. The study results can be used for strategic planning and the formation of long-term human capital development programs.
Index Terms: human capital, economic pace, labor, science, education, knowledge, GDP, R&D, innovation.
I.INTRODUCTION
In different periods, scientists put forward a number of diverse factors (God’s intentions, class struggle, great people (elite), environmental changes and disasters, knowledge, progress of human mind, progress of the society’s forces of production, growing needs and interest of people, innovative activities, rising population, growing flows of information, etc.) as the main forces that determine the regularities of the society’s development.
Numerous attempts to form an adequate model of humanity’s socioeconomic development, including world-system analysis and modeling of global growth on the basis of systematic analysis using computers, did not yield any tangible results. However, this solved a number of
Revised Manuscript Received on May 06, 2019
Olga S. Prichina, Russian State Social University, Moscow, Russia. Viktor D. Orekhov, International Institute of Management LINK, Zhukovsky, Russia.
Yulia V.Evdokimova, Russian State Social University, Moscow, Russia. Olesya G. Kukharenko, Russian State Social University, Moscow, Russia. Marina V.Kovshova, Russian State Social University, Moscow, Russia.
subproblems, in particular in the area of building models of demographic growth: studies in this area can be considered fruitful.Modern Russia has one of the biggest human capitals (HC) in the world, but the country’s commodity priorities impede HC development and its adequate use. Pursuant to the Forecast for Socioeconomic Development, made by the Ministry of Economic Development, “in the short and medium term economic growth will be mainly driven by higher fixed asset investment and labor productivity… In the longer term, human capital will begin to make a considerable contribution” [1-10].This article aimed to identify factors, which influence HC most of all, including details of systematic and quantitative characteristics, with close attention paid to such components as science, education and knowledge and their role in the evolution of HC development.
II. METHODS
Systematic analysis and modeling [11, 12], specific functions of which help form a strategy and the structure of applied methods of study, were used to study the HC concept and the system of labor activities, in which it works. The method of building systematic schemes was used as well. Elements of the method of conceptual modeling, which was proposed by A.T. Welford [13], were also used.The analysis of articles devoted to the topic of HC was used as an information base [14-17]. The articles under review were critically analyzed, particularly from the position of the systematic approach and the possibility of applying models under formation in practice.Mathematical methods of research and modeling were also used in the article. To get a more complete picture of the area under research, particular quantitative models [18], which were developed earlier, were used, with a short description of the essence of the regularities used and their integration into a more generalized model. Due to the conceptual nature of models to be formed, highlighting the parameters of order and abstraction from less significant factors was used.
III. RESULTS
The results of the study are given below.
A. HC Components
The HC concept has changed substantially since the time it emerged. According to S.
Evolution of Key Factors and Growth Potential
of Human Capital
includes inborn capabilities and talent, and education and qualification acquired” [17]. A broader view of HC [19]
Fig. 1. Sources of HC accumulation Such an expansion of the HC concept by various authors
has made it almost universal. However, the addition of a number of relatively small components, which are difficult to calculate, makes it difficult to apply HC as a forecasting and
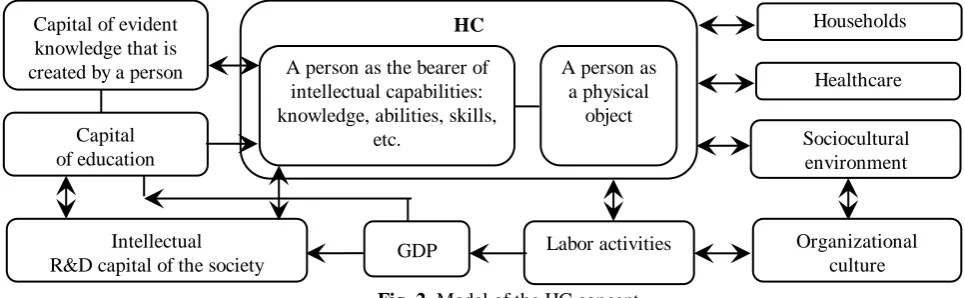
management tool. In fact, the concept is now diluted. For further work, we will use the HC concept that is based on the scheme given in Figure 2.
Fig. 2. Model of the HC concept Here, we highlight two closely related HC subsystems, one
of which includes a person’s accumulated intellectual capabilities, and the second one characterizes their physical characteristics (health, age, and fortitude, ability to perform work that requires physical and mental capabilities). The necessity of such a division is driven by the fact that the ability of HC to execute functions of capital in the modern world is mainly associated with the intellectual component of HC. Excessive investment in the physical component will most likely not result in a higher return on capital if the case in point is not athletes.
In addition, we do not include such components as social capital, the organizational culture, entrepreneurial capabilities, business climate, institutional services, etc. in HC. These components do not directly relate to employees and largely characterize the organizational structure, in which this HC is used. When we apply the systematic approach, it is important to correctly highlight subsystems and suprasystem structures. As a rule, the reason for their distinction is a difference in their functional designation.
An important peculiarity of this system is the fact that the component “knowledge” has evident (codified) and non-evident parts, which are in a person’s conscience. For
that is created by a person” and “intellectual capital of science – the society’s R&D”, which are not directly part of HC of separate R&D professionals. Organizational, entrepreneurial, institutional, social and other similar types of capital, which support the operation of HC, should be separated, to a certain extent, into this subsystem. In addition, “capital of education”, which consists of both evident knowledge (textbooks, methodical materials, educational technologies, etc.) and non-evident knowledge of education professionals was also highlighted separately.
B. Dialectics of HC Development
Slow growth and the inefficient use of HC offer opportunities for better results from HC application. A driver for better results of HC activities is the aspiration to improve labor productivity. However, once it improves, growth potential shrinks because nearly any potential is exhaustible. Once reserves are depleted, the society uses new reserves as shown in Figure 3. This does not mean that the factor loses its effect – it stops generating growth from HC activities. The main potential of HC growth and the efficiency of its use are given in Table 1.
HC Households
Healthcare
Labor activities
Sociocultural environment
GDP
A person as a physical
object A person as the bearer of
intellectual capabilities: knowledge, abilities, skills,
etc. Capital of evident
knowledge that is created by a person
Intellectual R&D capital of the society
Capital of education
[image:2.595.61.544.310.459.2]International Journal of Innovative Technology and Exploring Engineering (IJITEE) ISSN: 2278-3075, Volume-8 Issue-7, May, 2019
[image:3.595.49.554.278.396.2]Fig. 3. Growth factors of labor results
Table 1. Main potential of better results from HC use
Traditional reserves Modern reserves
1.Population 8. Higher education
2.Evident knowledge 9. New technologies
3.Use of tools 10. Innovation, entrepreneurship
4.Literacy 11. Cybernetic technologies
5.Research 12. Lifelong learning
6.Division of labor and specialization 13. Inclusive economy
7.Professional training 14. Artificial intellect
The general picture of changes in the factors influencing labor productivity growth is fairly complicated. Some factors last much longer than others do. For instance, the most important HC growth factor was an increase in population, notably until approximately 1960 population grew in accordance with the hyperbolic dependence [20] (1).
N = C/(T1 – T) (1)
where Т means time (years); С 181010 people, years; T1 2022. The demographic transition has shown its effect
worldwide approximately since 1960 [21]. The paper [18] showed that the demographic transition was caused by higher public labor productivity so it became more profitable for women to be employed and have fewer children. As a result, the pace of population growth slowed down and this led to slower HC growth. The differential equation for the population can be shown in the form (2) and its solution (3).
dN/ dT =(1/С)N2(1 –N/Nmax) (2)
T = Т1 – С/N – (C/Nmax)Ln(N/(Nmax – N)). (3)
C. Knowledge of Humanity as an HC Growth Factor
One of the most important HC growth factors is the growth of human knowledge. To find the dependence of the scope of knowledge on time [18] it is possible to use knowledge available in the world’s largest libraries [22-25]. The relevant data are given in Table 1. To measure the scope of knowledge, the concept “conditional book” (CB), which contains knowledge, is introduced. If digitalized, it is equal to 1 MB. The table shows that the scope of knowledge (Z) per 1,000 people changes relatively slow in terms of time. This means that the number of people (N) is the main parameter influencing the scope of people’s knowledge: Z ~ N. For this reason, for the approximation of the scope of knowledge it makes sense to apply the dependence such as a hyperbola (1), and this will result in the following formula (4):
Z 1.5109 / (Т1-Т)1.25 (4)
Table 2. The scope of human knowledge
# Source Year, A.D. World population,
million
Scope of knowledge, thousand CBs
Knowledge, CB per 1,000 people 1.
Library of the Congress 2017 7,500 23,600 3.15
2. 2012 7,000 21,500 3.07
Date
G
r
ow
th
r
e
su
lts
of
lab
or
ac
ti
vi
ty
Factor 2
Factor 3
Factor 5
4. 1960 3,077 8,700 2.83
5 Library of Alexandria –300 86 80 0.93
The formula is correct (4) during hyperbolic changes in population, and after 1960, it can be adjusted by using the formula (1). As a result, there is also an expression (5) for the scope of knowledge during the demographic transition (here Z means million CB, N means billion people, and 25 is the age when a person’s labor activity begins).
Z 30N(Т–25)1.25. (5)
The found formulas (4), (5) are estimates for the scope of knowledge in terms of number. However, they give a view of the structure of changes in knowledge, show that the scope of knowledge mainly changes in proportion to the number of people. It is also necessary to highlight exponent 1.25, which shows that the scope of knowledge expands faster than the number of people.
[image:4.595.50.549.51.95.2]The found relation between changes in the scope of knowledge depending on the number of people makes it possible to attribute knowledge to labor productivity that can be characterized by GDP at Purchasing Power Parity (PPP). The article [18] shows that the expression (6) is good for the approximation of global GDP. In line with the formula (6), GDP is graphically shown in Figure 4 where G is given in trillion dollars of 1990 at PPP. For comparison, the same figure shows GDP numbers in accordance with the data [26] and PwC forecast recalculation [27].
G 1.6N(Т–25)2.25. (6)
Fig. 4. Approximation of global GDP Figure 4 shows that GDP data from three sources correlate
fairly well, thereby confirming the relevance of the expression (6). The comparison of the formulas (5) and (6) makes it possible to conclude that global GDP can be approximately determined under the formula (7), where G means trillion dollars of 1990 at PPP, Z means million CB, N means billion people, and А ≈ 0.53.
G АNZ (7)
Consequently, GDP per capita is in direct proportion to the global scope of evident knowledge. This shows the relationship between the productivity of people as persons who hold HC and the aggregate scope of human knowledge. Meanwhile, it should be borne in mind that evident
knowledge itself cannot produce anything. Evident knowledge is just the most important source for the formation of non-evident knowledge in the consciousness of people that can be used in productive activities.
D. Influence of Education and Science on HC Growth
[image:4.595.140.465.317.475.2]International Journal of Innovative Technology and Exploring Engineering (IJITEE) ISSN: 2278-3075, Volume-8 Issue-7, May, 2019
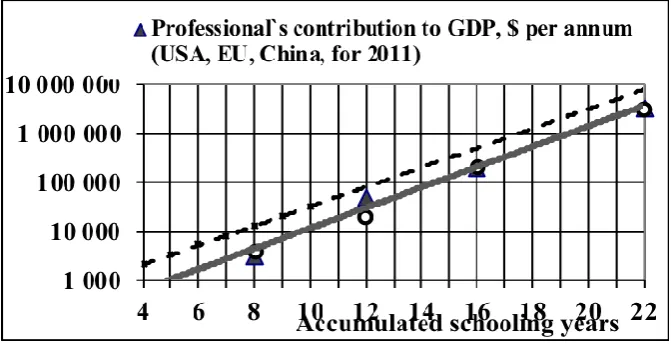
Fig. 5. Dependence of GDP per capita on years of schooling Based on GDP data from major economies and
distribution of professionals by education, the article [18] shows (Figure 6) that the similar exponential dependence (8) is also typical for separate groups of professionals depending on the years of their schooling (Е):
GE = KE 10 E/5 (8)
KE for major economies is equal to 125 international dollars of 2010 at PPP. It follows from the formula (8) that a one-year increase in schooling results in a 58% rise in a professional’s contribution to GDP, or substantially higher than their additional contribution to the budget of a company that they work for [15; 28].
Fig. 6. Influence of a professional’s education on contribution to GDP Such a difference arises as a positive effect from education
through HC growth and the introduction of new technologies is seen not only by a company that promotes new products, but also by its consumers, suppliers, followers, and the R&D community [29] and the entire society (Figure 7). The main task of education is to increase HC. Finding jobs in innovative companies, highly qualified professionals create new technologies or introduce those found in other companies and countries. By doing so, they create possibilities for high competition and the generation of
“economic profit” for their companies and their partners. This is the most important role of education. Certainly, of importance are also professionals who find jobs in traditional companies and execute various labor duties at a higher qualification level.
[image:5.595.130.466.377.549.2]Fig. 7. A conceptual model of the influence of education on economic conditions
E. Quantitative Influence of the Educational Level on HC
To examine the influence of education on HC numbers in more detail, we will analyze changes in the number of people with various levels of education. We will consider (Figure 8) how the percentage of people with higher (tertiary) education changes in the course of time [30, 31].
[image:6.595.96.496.49.241.2]It is clear that in the course of time it changes in accordance with the exponential dependence. At the same time, it is evident that the exponential growth of students should stop in the short term because the percentage of people with higher education has been approaching the natural level in economically developed countries. Due to the deviation in people’s intellectual capabilities, this percentage will hardly exceed 70%.
Figure 8. Number of tertiary students worldwide per 10,000 people
The second important indicator is the number of literate people. As prior to the demographic transition, the number of people grew in accordance with the dependence (1), it is important to see changes in the coordinates that correspond to the nature of this process. It follows from the formula (1) that such a natural system of coordinates by time for the
period of hyperbolic growth of population is a logarithmic system with singularity of T1 2022. If in this system of
coordinates the grid pitch is taken equal to 0.15 and the singularity point is rounded T1 = 2020, then there will be a
system of dates – Tn, which is shown in line 2 of Table 3.
Table 3. Dates of the system of logarithmic coordinates against singularity of 2020
Lg(2020-Tn) 3.3 3.15 3 2.85 2.7 2.55 2.4 2.25 2.1 1.95 1.8 1.65
Tn 25 607 1,020 1,312 1,519 1,665 1,769 1,842 1,894 1,931 1,957 1,975
Kondratiev
waves 1,789 1,845 1,898 1,949
Evident knowledge
Output of innovative products
Product consumers Innovative company’s sales network
R&D community
Intensive growth of a country’s GNP
Innovative company’s suppliers
Tax receivers, society
Education
[image:6.595.99.499.394.563.2]International Journal of Innovative Technology and Exploring Engineering (IJITEE) ISSN: 2278-3075, Volume-8 Issue-7, May, 2019
revolutions [18], by comparison, line 3 shows dates when long waves of N.D. Kondratiev began [32]. The figure shows literacy data worldwide [33] in the double logarithmic system of coordinates where the x-axis shows dates in accordance
with sequence Tn (Table 3). This dependence has the form of
[image:7.595.106.488.114.278.2]a straight line in this system of coordinates. As global literacy is now around 90%, this potential of HC growth will soon be exhausted.
Fig. 9. Literacy of population for two thousand years It is also important to compare data on education with an
increase in the number of R&D professionals. According to the available data [34], in the 17th century the number of scientists – NS – doubled every 10-15 years, which is in line with the dependence (9)
NS = 10(Т–1650)/50 (9)
However, such dependence in the past is not adequate enough because there were only two scientists when the academy of sciences was established in France in 1666. This also does not correlate with the existence of ancient sciences and achievements of the Renaissance. It looks as though this inconsistency stems from the idea of who should be considered a scientist. Now scientists include specialists engaged in R&D.
If one starts from the expressions (4), (5), which characterize the scope of human knowledge, and assumes that those professionals who create knowledge are scientists,
it is easy to devise a formula for the number of R&D professionals by time (10), where А = 16109, Т2 = 2050 [18].
NS = А/(Т2 – Т)2 (10)
According to (11), during the Renaissance, there were 60,000 R&D professionals in the world, around 3,000 in ancient times, 600 in ancient Egypt and around 100 in megalithic times. It looks as though such a number of R&D professionals better corresponds to the complexity of buildings and products created in those times than according to the exponent (9). Figure 10 shows the comparison between dependencies (9) and (10) and the available data on the number of scientists. It is clear that now, according to the exponent (9), the number of R&D professionals should approximately be twice as high as in reality [35]. However, when approaching the year 2050, the formula (10) becomes inapplicable because the number grows too fast [36].
Fig.10. Number of scientists in the world
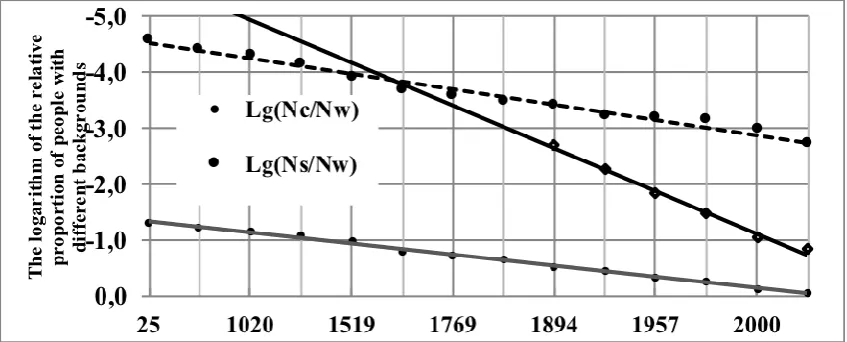
[image:7.595.114.547.558.820.2]literate people – Lg(Nе/NW), people with higher education –
Lg(Nt/NW) and R&D professionals – Lg(NS/NW). To
calculate Nt, data on the number of students were used
[image:8.595.90.514.127.298.2]40 years, it was accepted that the number of professionals with tertiary education is 10 times higher than the number of students for 20 years prior to this date.
Fig. 11. Changes in educational factors of HC growth Given these estimates, in 2015 the percentage of
professionals with tertiary education against the entire population in the world stood at 14.4%. If this number is doubled by the number of people able to work, then the percentage of people with tertiary education will be 28.8%. Based on the data [37], the percentage was 29.8% for G20 member states in 2017.
As Figure 11 shows, since 1600, the number of professionals with tertiary education has increased by around 1,000 times. During this period, the biggest contribution to the growth of the exponent of education was made by the distribution of book printing in the 15th century [38]. During the same period, the number of literate people jumped by roughly 10 times and the number of scientists increased by 20 times.
To date, the potential for literacy growth has virtually been exhausted. Higher education in developed countries has nearly exhausted its potential while developing economies now make active use of this potential of HC growth. In the future, science will be one of the most substantial resources for HC growth, but its potential is fairly limited due to the high cost of research. The potential of lifelong learning will be widely used because original higher education becomes obsolete fast enough and it needs to be restored by powerful educational programs for adults.
IV. DISCUSSION
It is difficult to analyze HC evolution because it is hard to determine what to consider HC and related areas. For instance, entrepreneurial abilities are sometimes associated with HC [19, p. 24] as these functions are executed through human intellect. However, in economics, it is accepted to divide production factors into labor, land, capital and entrepreneurial abilities [39, p. 27]. HC is referred to as
from an entrepreneur’s economic profit. There is a more disputable proposal to classify “investment in entrepreneurial ability and entrepreneurial climate – public and private investment in small and venture business” as HC. It is disputable to classify investment in the following types of activities as HC investment [19, p. 25]:
security of population and entrepreneurs; institutional services for the public; development of economic freedom; information services, etc.;
culture and art.
Of course, a company’s employees bear the organizational culture and it produces a substantial effect on the results of labor and, consequently, on the rate of return. Given such an approach, it would be necessary to classify all management expenses as the organizational culture and HC. For this reason, in the article, we propose not to add to the HC concept too many essences that have meanings of their own and exist in socioeconomic processes under specific laws [40-43].
International Journal of Innovative Technology and Exploring Engineering (IJITEE) ISSN: 2278-3075, Volume-8 Issue-7, May, 2019 V. CONCLUSION
In the article, we propose a conceptual model of HC and main factors influencing its development and successful activities in the system of labor activities. The article shows the dialectic effect of various HC growth potentials, during which the exhaustion of some factors activates others, producing a supplementary and mutually intersecting impact.
In the article, we identified and studied the potential of HC growth in the history of the new era, showed that an increase in the number of professionals with higher education was one of the key factors that translated into the higher industrial output. In addition, we showed that the potential of further HC growth has primarily been exhausted given this factor.
We put forward a conceptual model of educational impact on economic conditions taking into account the effect of the innovative factor and strong external effects that lead to the development of the intellectual system of the R&D community.
We formed a dynamic conceptual model of HC growth and qualitatively substantiated the impact of separate key growth factors.
REFERENCES
1. I.Yu. Ilina, E.M. Kryukova, A.I. Zotova, M.G. Chardymskiy, N.Z.
Skudareva. Scientific degrees as a status characteristic of Russian university teachers. International Education Studies, 2015, vol. 8 (5), pp. 165-172.
2. E.M. Kryukova, E.A. Vetrova, A.N. Maloletko, O.V. Kaurova, S.V.
Dusenko. Social-economic problems of Russian mono-towns. Asian Social Science, 2015, vol. 11 (1), pp. 258-267.
3. I. Ilina, A. Zotova, E. Kuznetsova, E. Nakhratova, E. Kryukova. Teachers
of Russian higher educational institutions in the professional labor market. Rupkatha Journal on Interdisciplinary Studies in Humanities, 2016, vol. 8 (2), pp. 128-136.
4. T. Fomicheva, Ju. Sulyagina, V. Kataeva, E. Kryukova, S. Dusenko.
Transformation of values in global society: managerial aspect. Espacios, 2017, vol. 38 (33), pp. 31.
5. I. Shadskaja, E. Kryukova, O. Kaurova, A. Maloletko, L. Druchevskaya.
Current state and prospects of development of sheep and goat breeding in the Russian Federation. Biosciences Biotechnology Research Asia, 2015, vol. 12 (1), pp. 507-519.
6. I. Ilina, E. Kryukova, E. Potekhina, I. Shadskaja, E. Abyzova. Russian lectures at the crossroads of reforms: strategies of survival and adaptation. European Research Studies Journal, 2017, vol. 20 (2B), pp. 86-97.
7. S. Dusenko, A. Oleynik, V. Sharikov, V. Polyakov, E. Kryukova, A.
Melnichuk. Current state of innovative activities in education: the use of e-learning in Russian universities. Research Journal of Pharmaceutical, Biological and Chemical Sciences, 2016, vol. 7 (4), pp. 1629-1637.
8. D.R. Makeeva, E.M. Kryukova, I.V. Mukhomorova, O.V. Kaurova.
Professionalnoye obrazovanie v Rossii: kurs na vyzhivanie. [Professional education in Russia: a survival course]. Social policy and sociology, 2016, vol. 15 (4(117)), pp. 26-34.
9. E.M. Kryukova, E.A. Vetrova, O.A. Urzha, Z.K. Alieva, E. Konovalova,
N. Bondaletova. Problems of attracting foreign investment in Russia. Journal of Applied Economic Sciences, 2016, vol. 11 (2), pp. 239-346.
10.V.I. Kataeva, O.V. Kaurova, S.V. Koludarova, J.O. Sulyagina, T.V.
Fomicheva, E.M. Kryukova. Barriers of inequality in social institutions of Russia. Biosciences Biotechnology Research Asia, 2015, vol. 12 (3), pp. 2813-2820.
11.D.H. Meadows. Thinking in Systems: a primer. Vermont: Chelsea Green
Publishing, 2008.
12.V.N. Spitsnadel. Osnovy sistemnogo analiza [Fundamentals of
systematic analysis]. Saint Petersburg: Bizness-pressa, 2000.
13.A.T. Welford. On the human demands of automation: Mental work
conceptual model, satisfaction and training. Industrial and business psychology, 1961, vol. 5, pp. 182–193.
14.T.W. Schultz. The Economic Value of Education. New York: Columbia
University Press. 1963.
15. A.V. Koritsky. Vliyanie chelovecheskogo kapitala na ekonomicheskiy
rost [Influence of human capital on economic growth]: Training aid. Novosibirsk: NGASU (Sibstrin), 2013.
16. Y.A. Korchagin. Efficiency of the national human capital: the method of
measurement. LERC, 2011. Available:
http://www.lerc.ru/?part=articles&art=3&page=29
17. S. Fisher, R. Dornbush, R. Shmalenzi. Ekonomicheskaya teoria [The
economic theory]. Moscow: Unity, 2002.
18. V.D. Orekhov. Prognozirovanie razvitia chelovechestva s uchotom
faktora znania [Forecasting the development of the humanity given the factor of knowledge]. Monograph. Zhukovsky: MIM LINK, 2015. 19. Y.А. Korchagin. Rossiyskiy chelovecheskiy kapital: faktor razvitia ili
degradatsii? [Russian human capital: a factor of development or degradation?]: Monograph. Voronezh, 2005.
20. H. von Foerster, P. Mora and L. Amiot. Doomsday: Friday, 13 November,
A.D. 2026. Science, 1960, vol. 132 (3436), pp. 1291-1295.
21. S.P. Kapitza. Matematicheskaya model rosta naselenia mira [The
mathematical growth model of world population]. Journal of Mathematic Modeling, 1992, vol. 4 (6), pp. 67.
22. K. Ushakov. Khranilishche vechnosti [Depositary of eternity]. CIO, 7, 2007.
23. General Information – About the Library (Library of Congress). 2017. Available: http://www.loc.gov/about/general-information.
24. Library of Congress. – Wikipedia, 2012. Available:
https://en.wikipedia.org/wiki/Library_of_Congress
25. SED (Soviet Encyclopedic Dictionary). – Moscow, 1987.
26. Maddison, A. Historical Statistics of the World Economy: 1–2008 AD. GGDC, 2010.
27. J. Hawksworth, D. Chan, “The World in 2050”, The BRICs and beyond:
prospects, challenges and opportunities, 2013.
28. S.A. Shchennikov. Otkrytoe distantsionnoe obrazovanie [Open
long-distance learning]. Moscow: Nauka, 2002.
29. O.V. Shinkareva, V.D. Orekhov, P.V. Solodukha, O.S. Prichina, A.Sh. Gizyatova. Multifactor Assessment of Indicators on Dynamic Modeling of Programs for Managing the Performance of Scientific Labor. International Journal of Civil Engineering and Technology, 2018, vol. 9 (13), pp. 303-317.
30. E. Schofer, J.W. Meyer. The Worldwide Expansion of Higher Education
in the Twentieth Century, American Sociological Review. 2006.
31. Six ways to ensure higher education leaves no one behind. UNESCO Policy
Paper 30, 2017. Available:
https://unesdoc.unesco.org/ark:/48223/pf0000247862
32. N.D. Kondratiev. Bolshye tsykly konunktury [Big cycles of the
environment]. Issues of the Environment, 1925, vol. I, iss. 1.
33. A.V. Korotaev, A.S. Malkov, D.A. Khalturina. Matematicheskaya model
rosta naselenia Zemli, ekonomiki, tekhnologii i obrazovania [The mathematical growth model of world population, economy, technologies and education]. Moscow, 2005. Available: http://www.keldysh.ru/papers/2005/prep13/prep2005_13.html
34. Features of modern science. Scientific information magazine Biofile, 2018.
35. UNESCO. Press release № 2009–139, 2009.
36. O. Prichina, V.D. Orekhov, E.S. Shchennikova. World Number of
Scientists in Dynamic Simulation for the Past and the Future. Economic
and Social Development. Book of Proceedings. Varazdin Development
and Entrepreneurship Agency; Russian State Social University, 2017, pp. 69-81.
37. OECD. Educational attainment and labour-force status. 2018.
38. S. L. Sotheby. Principia Typographica. London, 1858.
39. С. McConnell and S. Bru. Economics. Moscow, Infra-М, 2006, iss. 16, p.
75.
40. E.M. Kryukova, A.N. Maloletko, O.V. Kaurova, E.A. Vetrova, S.V.
Dusenko. Social-economic problems of Russian mono-towns. Asian Social Science, 2015, vol. 11 (1), pp. 258-267.
41. V.I. Kataeva, S.V. Koludarova, E.M. Kryukov, T.V. Fomicheva.
Neravenstvo v sotsialnykh institutakh sovremennoy Rossii [Inequality in the social institutions of modern Russia]. Social policy and sociology, 2015, vol. 14 (4(111)), pp. 173-182.
42. A.N. Maloletko, O.V. Kaurova, E.M. Kryukova, N.B. Pochinok, E.A.
Gladko. Analysis of key indicators of tourism industry in Russia. Modern Applied Science, 2015, vol. 9 (3), pp. 25-33.
43. E. Kryukova, N. Starostenkov, S. Krapotkina, E. Timoshina, D. Makeeva,

![figure shows GDP numbers in accordance with the data [26] and PwC forecast recalculation [27]](https://thumb-us.123doks.com/thumbv2/123dok_us/8205957.262097/4.595.140.465.317.475/figure-shows-gdp-numbers-accordance-data-forecast-recalculation.webp)