RIT Scholar Works
Theses
Thesis/Dissertation Collections
3-1-1988
An Evaluation of the effect of registration on GCR
and conventional chromatic separation methods in
multicolor halftone printing
Chihwe Jeffrey Wang
Follow this and additional works at:
http://scholarworks.rit.edu/theses
This Thesis is brought to you for free and open access by the Thesis/Dissertation Collections at RIT Scholar Works. It has been accepted for inclusion
in Theses by an authorized administrator of RIT Scholar Works. For more information, please contact
Recommended Citation
ON GCR AND CONVENTIONAL CHROMATIC SEPARATION METHODS
IN MULTI COLOR HALFTONE PRINTING
by
CHIHWE JEFFREY WANG
B.S.
Chinese Culture University
(1982)
A thesis submitted in partial fulfillment
of the requirements for
the ..degree of
Master of Science in the Center for
Imaging Science in the College of
Graphic Arts and Photography of the
Rochester Institute of Technology
March
1988
Signature of the Author
Accepted
by
ROCHESTER INSTITUTE OF
TEC~N(lLOGY
ROCHESTER,
ND~
YORK
CERTIFICATE OF AP?ROVAL
The M.S.
Degree Thesis of John S. Do::>e
has been examined and approved
by the thesis
com~ittee
as satisfactory
for the thesis requirement for the
Master of Sciei;ce
deg~ee
Dr. Edward
M.
Granger, Thesis Advisor
Joseph L. Noga
Dr. Chi Ming Tang
'2
J2-s:J~
ROCHESTER INSTITUTE OF TECHNOLOGY
COLLEGE OF GRAPHIC ARTS AND PHOTOGRAPHY
I,
CHI/lW£ JZFPffir
W/fAlQ-each time a request for reproduction is made".
following address:
, prefer to be contacted
I can be reached at the
Special
thanks
aredue
to
my
advisorDr.
Edward
M.
Granger
for
his
guidanceand
encouragement.Without
his
support
this
thesis
couldnever
reachits
present stage.I
would
also
like
to
thank
Professor
Joseph
L.
Noga
andDr.
Chi
Ming Tang
for
their
insight
during
the
time
ofthesis
writing.
They
have
been
very
helpful
and generous withtheir
time.
Last
but
notleast,
I
amdeeply
indebted
to
my
parentsand sisters.
Their
total
supporthas
given me strengthto
TABLE
OF
CONTENTS
Content
Page
ABSTRACT
4
Chapterl
.INTRODUCTION
6
Chapter 1 1. OBJECTIVES
9
Chapter I II. LITERATURE
REVIEW
10
1
.Registration10
l.A
Theory
ofRegistration
10
l.B
Problems
ofRegistration
11
2. Misregistration
in
Dot-on-Dot
Printing
12
3.
Color
andInk
13
4.
Gray
Component
Replacement
15
4.
A
Functions
ofGCR
16
4.B
Effects
ofGCR
20
5. Evaluation
ofImage
Quality
21
5. A
Subjective
Quality
Factor
21
5.B
The
Relationship
Between
Input
andOutput
Image
Quality
24
5.C
Just
Noticeable
Differences
(JND)
in
SQF
24
2. Preparation
ofSample
Proofs
27
3. Subjective
Visual
Evaluation
30
4. Data
Collection
31
5.
Category
Analysis
32
6.SQF
andBoundary
Scale
34
ChapterV. EXPERIMENTAL RESULTS
36
ChapterVI. DISCUSSION
47
l.The
Median
Frequency
Image
47
2.
The
Low
Frequency
Image
49
3.
The
High
Frequency
Image
50
4. Color
Ink
Performance
51
5. The
Image
Quality
ofGCR
Method
52
ChapterVII. CONCLUSION
53
ChapterVIII. SUGGESTION
OF
FUTURE WORK
55
REFERENCES
57
ON GCR AND CONVENTIONAL
CHROMATIC
SEPARATION
METHODS
IN
MULTICOLOR
HALFTONE
PRINTING
by
CHIHWE
JEFFREY WANG
A
thesis
submittedto
the
Center
for
Imaging
Science
in
partialfulfillment
ofthe
requirementsfor
the
Degree
ofMaster
ofScience
atthe
Rochester
Institute
ofTechnology
ABSTRACT
Misregistration
is
an unavoidable problemin
multicolorhalftone
printing.It
causesthe
loss
ofdetail,
sharpnessand color
hue
shift of a reproduction.However,
there
is
acolor separation
technique
calledGray
Component
Replacement
(GCR)
whichmay
reduce or eliminatethis
misregistrationeffect.
An
investigation
had
been
conductedusing
a seriesof
colorhalftone
proofs which were producedby
conventionalchromatic and
GCR
color separationtechniques.
The
subjective
image
quality
scaling
methodwas
appliedto
this
study
as a criterionto
determine
whetherthere
is
animage
quality
relationship
between
these
two
techniques
on
Accurate
control
of
registration
onpress
andthroughout
the
printing
process
is
oneof
the
necessary
factors
in
achieving
a
successful
color
reproductionfrom
acolor
original
using
any
printing
process.Although
screenruling,
ink,
tone
reproduction
and paper are allimportant
factors
that
contribute
to
the
final
result of areproduction,
registration
is
stillthe
mainfactor
to
be
considered.
Since
the
inception,
of multicolorhalftone
printing,
printers
have
found
that
misregistrationis
one oftheir
major problems.
It
occurs
everywhere,
in
colorscanning,
in
film
stripping,
onthe
vacuumframe,
onthe
copyboard of acamera,
in
platemaking
and onpress.
There
are several causesfor
misregistration
to
occur,
including
manual misregistration ofthe
four
color
halftone
separations,
the
temperature
and
humidity
changeson
paper
and
film
base
materials,
dynamic
unbalance
and
gear
eccentricity
of a press(cyclic
variations),
inconsistant
strain
between
printing
units,
hardness
ofblanket
onthe
press,
cylindervelocity
variationsand
in
feed
tension
variations.
Any
errorsin
the
abovefactors
cancause
detail
loss
and color variationsin
any
colorreproductions
towards
solving
the
misregistration
problem?GCR
is
a
newtrend
in
color
reproduction,
but
nota
newidea.
Thirty
seven
years
ago,
John
Yule
in
aTAGA
reportdefined
the
gray
component
as"the
maximumamount
ofblack
ink
which canbe
substituted
for
the
yellow,
magenta
and cyan of an accuratethree-color-reproduction
in
any
area withoutdegrading
the
color"(Ref
.1) .In
the
conventional
chromatic color reproductionmethod,
all colorhues
of
an
original,
as wellas
black
and neutralgray,
are producedby
the
three
primary
printing
inks,
yellow,
magentaand
cyan.They
arethen
stabilizedby
black
ink
which addsdepth
to
the
shadowsand
darkens
the
grays.
The
black
has
minimumimpact
in
terms
of color.In
the
GCR
method,
the
yellow,
magenta,
and cyancolors
are
formed
in
the
sameway
asin
chromaticreproduction,
but
the
rest ofthe
colorsare
formed
by
two
process
colorinks
and
black
ink.
Black
ink
adds
graynessand
darkness
to
the
image,
andis
alsothe
dominant
colorink
in
gray
and
black
areas.
The
function
ofGCR
is
to
remove
the
third
contaminant color
ink
andan
equal
amount
ofthe
other
two
information,
detail
anddrawing
in
selected areas ofthe
reproduction
than
in
conventional
chromaticmethod,
and
black
as
the
dominant
color
ink,
covers
mostoutlines
of
an
image
and
maintains
astable
gray
balance;
therefore
registration
problems arereduced.
Maintaining
gray
balance
is
extremely
important
in
color reproduction.
As
studieshave
shownthat
withoutthe
propergray
balance,
it
is
impossible
to
expectto
have
true
color reproduction.
Gray
balance
is
a referenceto
have
the
appropriate
dot
size andthe
correctink
density
for
yellow,
magenta,
and cyan.It
enables usto
reproduce agray
scale as a perfectneutrality
gray
scale(no
color cast).The
assumption ofgray
balance
is
that
if
people could achievethe
perfectbalance
ofdot
area andink
density
to
produce
the
gray
scale with perfectneutrality,
people
would
have
the
proper conditionsto
makeit
possible
to
reproduce
color areasto
match
the
color ofthe
originals.One
advantage ofthe
GCR
methodis
that
the
gray
balance
is
perfectly
stable,
evenif
there
are
some
shifting
in
the
amount ofblack
ink.
The
shifting
will
makethe
gray
tones
and color valuesa
little
lighter
or alittle
darker.
But
the
colorswill
not
be
adversely
affected
at
all.
On
inks
will
have
no
influence
on
the
gray
balance
sincethe
neutral
tones
will
only
get
such
values
of
yellow,
magenta,
and
cyan
inks,
which
are
necessary
to
form
the
neededAs
discussed
before,
in
the
GCR
color
separation
method,
the
black
printer
carries
more
of
the
information,
detail
in
certain
areas
ofthe
reproductionthan
in
conventional
chromatic
method,
and covers most outlines ofan
image
andmaintains
stable
gray
balance.
So,
GCR
colorseparation
method
minimizes
misregistration
effectsin
multicolor
halftone
printing.
The
hypothesis
ofthis
study
is
that
the
image
quality
of a misregistered reproduction can
be
improved
using
the
GCR
method.When
the
magnitude ofmisregistration
of areproduction
is
under certain"mm",
this
reproductionis
still acceptable
by
most ofthe
people.The
objectives ofthis
study
are:(1)
to
determine
whether
there
is
any
image
quality
improvement
orloss
due
to
misregistrationusing
the
GCR
color
separations
compared
to
the
conventional chromaticseparations;
(2)
to
decide
the
acceptable misregistration magnitudes
of
a
reproduction
in
conventional chromatic and
GCR
separations;
(3)
to
investigate
which
ofthese
color
inks,
yellow,
magenta,
or
cyan
has
the
least
ormost
impact
ofmisregistration
in
a
Chapter
III.
LITERATURE
REVIEW
1. Registration
l.A.
Theory
ofRegistration
The
basic
theory
of registrationis
to
locate
a planein
a wanted space precisely.One
must assumethat
a planehas
already
been
establishedin
whichthe
registrationshould
take
place.Figure
1.
Directions
ofMovement
in
aFlat
Sheet
Figure
1.
indicates
that
the
flat
sheethas
three
directions
of movement as shownby
the
arrows.There
aretwo
directions
of movementin
the
X
andY
axes,
and onedirection
of movementin
rotation.When
allthe
directions
of movement
have
been
stabilized,
the
flat
sheetwill
be
l.B.
Problems
of
Registration
1).
Film
Stripping
To
understand
the
misregistration
problems,
we
needto
look
at
film
stripping,
plate
making,
andpress
workin
multicolor
halftone
printing
to
know how
the
registrationis
produced.
In
the
film
stripping
process,
registrationis
maintained
by
a pinsystem
and visual overlapping.Overlapping
the
four
color
separations
is
done
manually.Misregistration
may
occur
due
to
human
error.2)
.Plate
Making
In
the
platemaking
process,
it
is
important
to
securethe
positionalaccuracy
ofthe
screenedfilms
to
be
printedon
the
plate.Such
accuracy
canbe
achieved eitherby
using
an
automatic photocomposer, orby
attaching
the
screened
films
manually.The
first
methodinvolves
less
misregistration
than
the
second.In
the
second
method,
athin
template
is
laid
on a plate andmarked
off
with
the
position reference marks
by
amarking-off
pin.
Misregistration
may
happen
in
this
manualoperation.
3)
.Press
Work
In
the
press work stageof
the
process,
misregistration
may
be
causedby
erroneousmounting
of
printing
plate
on
the
cylinder
of
the
press orby
phaseerror
of
the
cylinder,
orMany
techniques
andelectronic
devices
have
been
invented,
such
as
pinregistration
systems(Ref.2),
digital
registration
machine(Registar)
(Ref.3),
automaticpresetting
systems
(Ref.4),
electronicregister
system(Ref.5),
and
soon,
to
solve
the
misregistration
problemsin
multicolor
printing
process.
But
little
can
be
done
whenmisregistration
already
existsin
the
previousstep
ofprinting
processes.
2.
Misregistration
in
Dot-on-Dot
Printing
Dot-on-dot
halftone
printing
is
a processin
which eachseparation
of
yellow,
magenta,
cyan,
andblack
is
producedby
using
only
one screen anglein
the
color separationprocedure.
Therefore,
every
singledot
of each separationwill
form
all
the
colors(excepting
yellow,
magenta,
andcyan
colors)
ofa
reproductionbecause
they
overlap
witheach
dot
centrally
onthe
printed material.When
misregistration
happens
in
dot-on-dot
halftone
printing,
those
dots
can notbe
overlappedexactly
centrally,
different
part ofdots
overlapped with eachother
to
produce
different
color combinations on a reproduction.The
colorhue
ofthis
misregistered reproductionwill
shiftwhen
compared with
the
original.Studies
have
shownthat
color shiftsproduced
by
misregistration
of
halftone
dots
are
not
objectionable,
if
the
magnitude of misregistrationis
under
or
equalto
1/4
printing
(Ref.6).
Since
dot-on-dot
multicolorhalftone
printing
is
extremely
sensitive
to
minute
variationsin
registration
(Ref.7).
A
one
fourth dot
size magnitudeof
misregistration
is
still
acceptable
in
dot-on-dot
printing.The
misregistration
magnitudes
of
onefourth,
one
half,
one,
one
and
half,
andtwo
dots
of a50%
dot
sizein
65
line/
inch
screen
ruling
arereasonable
choicesto
observein
multiplescreen
angle
printing
ofthis
study.
3.
Color
andInk
The
conventional chromaticthree-color-printing
is
based
upon
the
subtractive colortheory
principles.In
the
subtractive colormixing
process,
yellow,
magenta,
and cyan are printedon
top
of eachother
to
produce a neutralblack.
Multicolor
halftone
printing
is
using
the
sameprocess,
because
the
dots
ofthe
yellow,
magenta,
cyan,
andblack
printers are so smallthat
the
eyes can not resolvethem
individually
making
them
appear as a continuoustone
of
color.
Transparent
printing
inks
work asfilters.
They
permit
the
subtractive physicalmixing
ofthe
color
to
take
place
on
the
printed surface.White
light
penetrates
the
transparent
ink
film
whereit
is
diffused
onthe
white
paper
Due
to
the
fact
that
up
to
four
layers
ofink
aredeposited
ontothe
paper'ssurface,
drying
andink
trapping
become
even
more critical.Another
problemis
the
overprintof
these
three
color
inks
(yellow,
magenta,
and cyan) whichcannot produce a
satisfactory
black
because
they
containunwanted absorptions
and
thus
have
noideal
spectral curves.Figure
2
showsthe
spectral response ofthree
inks
(yellow,
magenta,
andcyan)
.It
also showsthe
shortcoming
ofusing
only
three
colorinks.
Therefore
ablack
ink
is
necessary
to
givedarkness
anddepth
of color(Ref.8).
yellow
500 600
magenta
/ *
- z-=
700 400 500
cyan
700 400 500 400 700 nm
Actual
processink
reflectionIdeal
processink
reflection4.
Gray
Component
Replacement
In
1940
Yule
stated
that
"if
suitable correctednegatives
could
be
made
easily,
the
best
results wouldusually
be
obtained
by
using
the
maximum
possiblequantity
of
black,
and
printing
not
morethan
two
ofthe
three
subtractive
colors
at
any
one
point"(Ref.9).
In
1954,
Tobias
saidthat
"any
colorwithin
the
gamut ofthe
four-color
process
printing
inks
canbe
reproducedby
pairsof
the
chromatic
inks
plusblack
ink.
The
chromaticity
of acolor
willvary
with
the
two
chromaticink
mixtures,
whereasluminance
is
affected
by
the
amount ofblack
ink
used"(Ref
.10) .The
GCR
theory
of color reproductionis
based
onthe
concept
that
it
is
unnecessary
to
usethree
basic
inks,
yellow,
magenta,
and cyanto
reproduce a neutral componentor value
which
couldbe
obtainedby
using
appropriateproportions
of
black
(Ref.
11).
In
conventionalthree-color
halftone
printing,
whenever a coloris
producedby
somecombination of
yellow,
magenta,
and cyaninks,
the
two
predominant colors
determine
the
hue
ofthat
area.The
least
dominant
colordarkens
and provides"shape".
For
example,
in
a redthat
is
produced withhalftone
values of
95%
magenta,
80%
yellow,
and20%
cyan,
the
cyan
becomes
the
least
dominant
primary
color.
Since
cyan
absorbs red
light,
it
willdarken
or
"dirty"the
redcolor.
Cyan
dots
in
a
redarea
willlook
black,
magenta
dots
in
effect.
Therefore,
we canseparate
the
printing
ofyellow,
magenta,
and
cyan
into
two
separate
components:the
colorvalues
and
the
gray
values.
Color
values
could
consist ofone
color
or
two
fundamental
colors,
whereas,
gray
valuesconsist
of
equal
amounts
ofyellow,
magenta,
and cyan.4. A.
Functions
ofGCR
The
principle
ofGCR
is
to
removethe
colorinks
whichcontribute
the
least
dominate
colorin
animage
anddarken
the
hue
ofprinted
colors.Those
colorinks
willbe
replaced
by
a computedvalue
ofblack
ink.
The
black,
in
this
theory,
alsoreplaces
the
colorinks
in
the
neutralshadow areas.
In
the
following
section,
three
colors:red,
green,
andblue
were chosenfrom
a color guide willbe
discussed
in
the
GCR
andthe
convention chromaticseparations.
Each
ofthem
has
a numberto
representits
color appearance.
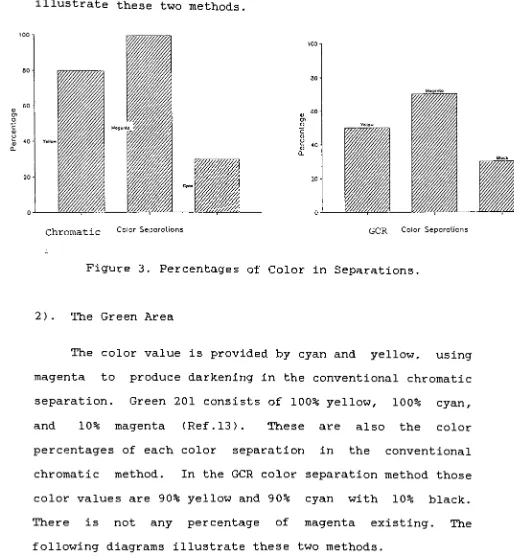
1 )
.The
Red
Area
A
redarea,
in
conventional chromatic color separationmethod,
is
producedby
the
combination of magenta and yellow withthe
cyanproviding
the
darkening
and
shape.For
example,
red38
is
in
a
color combination of100%
magenta,
80%
yellow,
and30%
cyan(Ref.
12).
The
color
separations
to
produce
this
red38
in
three-color
halftone
printing
are
made
according
to
these
colorpercentages
in
the
conventional chromatic color separationmethod.
But
in
the
GCR
color separationmethod,
30% black
will
be
used
in
stead
cyan
to
provide
the
darkening
and
shape.
Color
values
for
magenta
and
yellow
are70%
and50%.
The
following
diagrams
illustrate
these
two
methods.
20
Chromatic
ColorSeparations GCR Color SeparationsFigure
3.
Percentages
ofColor
in
Separations.
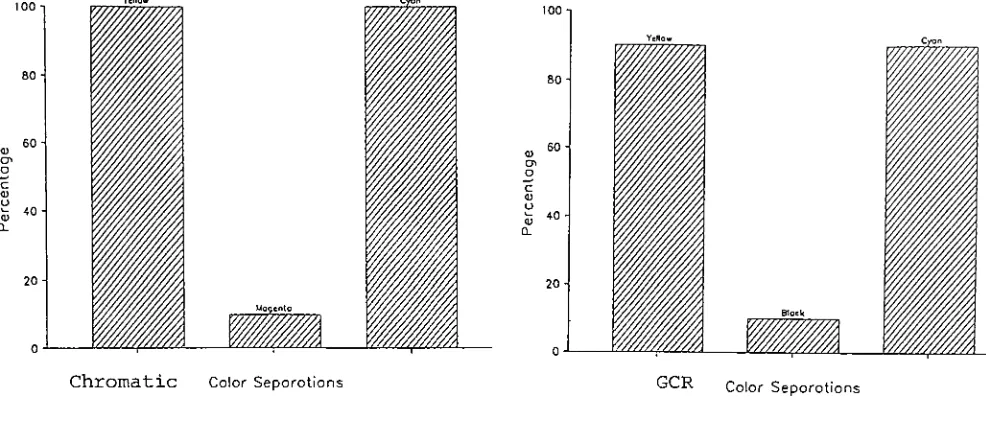
2)
The
Green
Area
The
color valueis
provided
by
cyan andyellow,
using
magenta
to
producedarkening
in
the
conventional
chromatic
separation.
Green
201
consists
of100%
yellow,
100%
cyan,
and
10%
magenta(Ref.
13).
These
are alsothe
color
percentages of each color separation
in
the
conventional
chromatic
method.In
the
GCR
color
separation
method
those
color values are
90%
yellow and90%
cyanwith
10%
black.
There
is
notany
percentage ofmagenta
existing.
The
[image:21.531.0.514.84.643.2]100 i
is
4<H CL20
80
40
20
Chromatic
Color SeparationsGCR
Color SeparationFigure
4.
Percentages
ofColor
in
Separations.
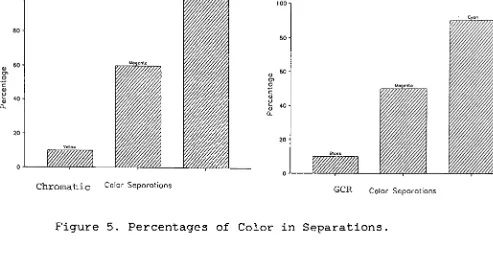
3)
The
Blue
Area
The
color valueis
producedby
cyan and magenta withyellow
providing
the
darkening
and shapein
conventional
chromatic method.
Blue
220
consists of100%
cyan,
60%
magenta,
and10%
yellowin
the
conventional
chromatic
separations
(Ref.
14).
But
using
the
GCR
method
to
produce
this
certaincolor,
there
willbe
only
90%
cyan
and
50%
[image:22.531.24.517.115.331.2]
60-20
m
Chromatic
ColorSeporotions
o
m,
1
Cyon
GCR
Color SeparationsFigure
5.
Percentages
ofColor
in
Separations.
4)
The
Brown
Area
A brown
area,
in
conventionalcolor,
is
producedby
the
combination of yellow and magenta with
the
cyanproviding
the
darkening
and shape.In
GCR
the
cyanis
replacedby
black.
There
is
also a reductionin
the
yellow
and magentabecause
a percentage ofboth
combined withthe
cyan wasactually
producing
agray
componentin
the
color.The
black
ink
now providesthat
gray
component.The
resulting
reduction
in
total
ink
laydown
in
the
dark
browns
alsohelps
reduce
ink
trapping
anddrying
problems.5).
In
A
Dark Green
Area
In
adark
greenarea,
yellowand
cyanare
the
two
predominant colors.
If
the
magentaincreases
in
value
due
to
anincrease
in
density,
ordot
gain onthe
press,
there
[image:23.531.23.516.51.315.2]still
provided
by
the
yellow
and
cyan
but
nowthe
darkening
is
provided
by
the
black.
If
the
density
ofblack
increases
or
dot
gain
occurs,
there
is
still
achange,
but
because
black
is
being
added
to
the
color
value as opposedto
magenta,
it
only
produces
adarker
shade
ofthe
same greenhue.
That
translates
to
more
consistency
andlatitude
whenprinting
color.
6).
In
A
Purple
Area
In
apurple
area
or adark
blue,
yellowink
providesthe
darkening
and
shape
in
conventional color.It
is
clearly
more
efficient
to
use
black
ink
instead
of yellowink.
4.B.
Effects
ofGCR
Gray
Component
Replacement
canbe
appliedin
various
degrees
from
0%
to
100%.
As
much as100%
GCR
wasused
in
this
study.It
meansthat
the
colorinks
which contributeto
darken
the
hue
of
the
printed colors of areproduction
were removed
totally,
instead,
black
ink
was used.The
neutral
grays which were producedprimarily
by
black
ink
become
much more consistent.Using
100%
GCR,
the
neutral shadowshave
noyellow,
magenta,
and
cyan at all.Therefore,
when
the
black
is
out
of
registration withthe
otherthree
colors,
there
is
around
the
image
is
apparently
noticeablein
black
misregistration.
This
has
been
provento
be
true
that
the
misregistration
of
black
with
the
other
three
colors
in
100%
GCR
causes
the
significant
loss
ofimage
quality.This
study
is
only
in
reference
to
the
yellow,
magenta,
and
cyanout of
register
with
the
black
to
seethe
implications
(Ref
.15) .By
using
black,
as opposedto
the
least
dominant
of acolor
image
the
gamut of colorthat
canbe
reproducedactually
increases.
Ink
trapping
anddrying
problems arealso reduced and
more
brilliant
color canbe
printedby
increasing
ink
valuein
saturated colors.B.A.Frost,
in
1986
TAGA,
statedthat
"GCR,
also produces sharperlooking
images.
No
longer
is
exact registration ofthe
three-color
image
requiredto
providethe
sharpness ofthe
picturebecause
now most ofthe
detail
and shapeis
providedby
the
black
printer"(Ref. 16).
5.
Evaluation
ofImage
Quality
5. A.
Subjective
Quality
Factor
Subjective
image
quality
scaling
is
aneasily
calculated and
directly
measurable method whichgives
consistent evaluations of system performance.
It
can
predict
image
quality
within normal reader errorand
is
quantitative
way
to
evaluateand
to
expressthe
image
quality
of a reproduction.Subjective
quality
factor
(SQF)
was
used
in
this
study
to
define
the
quality
of
images.
Essentially,
the
higher
the
SQF
valuethe
better
the
image
quality.
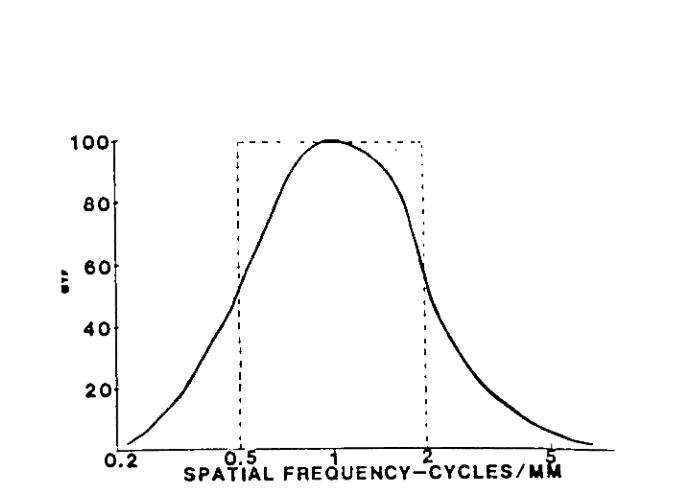
Schade
in
1964
(Ref. 17)
found
that
the
visual system'sresponse
to
the
luminous
sine-wavesresulted
in
a visualsystem modulation
transfer
function,
MTF,
in
figure
6
whichhad
avery
broad
resonancelike peak with maximum response at6
cycles perdegree,
or1
cycle per mm on an object viewedat
34
cm.100T
80
.
60
40
20
0.2
~075
f
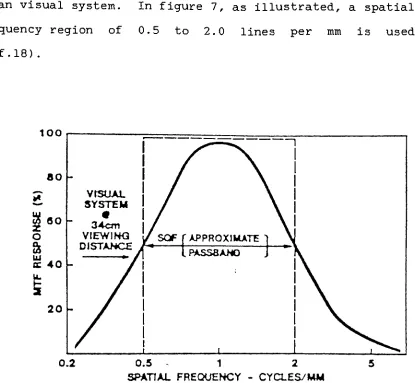
SPATIAL
FREQUENCY-CYCLES/ [image:26.531.117.454.310.559.2]SQF
was
defined
soas
to
duplicate
the
operation
ofthe
human
visual
system.In
figure
7,
asillustrated,
a spatialfrequency
region
of0.5
to
2.0
lines
per
mm
is
used(Ref
.18) .100
80
3
oo
o
&
u
cc
40
20
VtSUAL
,SYSTEM
I
34on
VIEWING
/
SQF
f
APPROXIMATE
DISTANCE
0.2
0.5
-1
SPATIAL
FREQUENCY
CYCLES/ MM
Figure
7
.In
atwo-dimensional
imagery
the
SQF
of colorimage
quality
can
be
calculatedby:
S.Q.F.=
K
In
(2*M)
27T
700
In
(M/2)
0
400
T(ln
frQfX)^x^
dK
d9
d(lnf)
[image:27.531.58.473.61.444.2]form,
S^is
the
spectral
response
of
a neutral whitedisplay,
and
Vj^is
the
spectralluminosity
function
ofthe
visualsystem.
The
wavelength,
X
,is
in
nanometers.f
is
the
spatial
frequency
in
line
per mm.M
is
the
magnificationused
in
viewing
the
image.
5.B.
The
Relationship
Between
Input
andOutput
Image
Quality
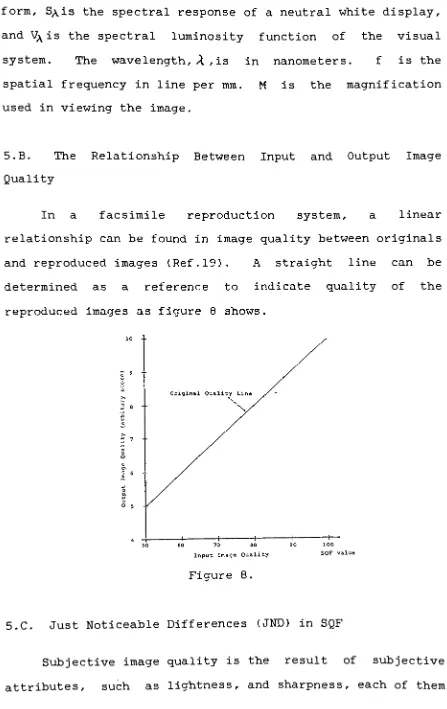
In
afacsimile
reproductionsystem,
alinear
relationship
canbe
found
in
image
quality
between
originalsand reproduced
images
(Ref. 19).
A
straightline
canbe
determined
as a referenceto
indicate
quality
ofthe
reproduced
images
asfigure
8
shows.5
Input Image Quality
Figure
8,
5.C.
Just
Noticeable
Differences
(JND)
in
SQF
Subjective
image
quality
is
the
result
ofsubjective
[image:28.531.30.477.36.745.2]depends
on
one
or
more
objective
or
physical
quantities,
such
as
solid
ink
density,
and
misregistration.The
subjective
image
quality
changed
whenthe
changeof
objective
quantity
happened.
In
orderto
find
the
relationship
between
subjective
quality
and objectivequantities,
oneapproach
is
to
find
what changes arerequired
in
the
physical
quantities
ofthe
image
before
anobserver
notices
any
changes
in
the
image.
In
this
study,
just
noticeable
difference
(JND)
data
was
performed
asfive
SQF
units(Ref. 20).
This
valueindicated
the
minimum changesin
the
physicalquantities,
misregistration
magnitudes,
that
were recognized"clearly
by
an
observer.
In
the
other
words:it
is
noticeable,
whenthe
subjectiveimage
quality
difference
between
precisely
registered and misregistered proofs
is
larger
than
five
SQF
units.
The
JND
value was usedto
establish minimumlimits
Chapter.
IV
METHODOLOGY
1.
Preparation
ofColor
Separations
The
originals
were
three
continuoustone
colortransparencies,
ahigh-frequency
image,
amedian-frequency
image,
and
a
low-frequency
image.
A
high-frequency
image
contains
many
fine
and smalllines
spreading
all overthe
image
without
much
space
left.
A
median-frequency
image
contains
about
the
same
amount
ofsmall
fine
lines
andspace.
A
low-frequency
image
containsonly
afew
smallfine
lines
and alot
space.
A
Screen
ruling
of65
line/ inch
was usedin
this
study,
because
it
is
the
coarsest onein
general useby
the
printing
industry
and makeit
easy
to
determine
the
misregistration.
Two
sets of color separationsfor
eachoriginals
werereproduced
by
electronic colorscanning
using
the
HELL
DC-399ER
with100%
GCR.
Conventional
chromatic
andGCR
color separation methods were used
in
65
line/
inch
screen
ruling.
Screen
angles weresixty
degrees
for
yellow,
onehundred
andfive
degrees
for
magenta,
onehundred
andsixty
five
degrees
for
cyan,
andforty
five
degrees
for
the
black.
Elliptical
dot
configuration waschosen
in
making
a
2.
Preparation
of
Sample
Proofs
The
3M
Matchprint
off
-pressproofing
system
wasdetermined
to
be
preferred
over
a
press
proof.
The
off
-pressproofing
method
eliminates
the
misregistrationfactors
to
aminimum
and
also
offers aneasier
way
to
produce
the
desired
registration.
Because,
there
aretoo
many
variables
in
the
pressproof
associated withevery
press
run such as:dot
gain,
ink
trapping,
ink
fluctuation,
etc,
off-pressproofing
system was usedto
givebetter
control.
After
press
proofs
are
made,
it
wouldbe
hard
to
identify
the
real
causes
ofimage
quality
variation whichbe
made
by
misregistration
orthe
other
factors.
Six
sample proofswere
reproducedby
3M
Matchprint
Proofing
System
for
three
originals oftwo
color separationmethods with precise registration which means
that
the
misregistration magnitude within each separation was
less
than
1/4
dot
sizein
65
line/inch
screenruling
on a50%
dot
area.
In
orderto
evaluatethe
effect ofmisregistration
for
each color
ink
individually,
only
one color separation wasallowed
to
misregister,
with aspecified
magnitude,
at onetime.
For
instance,
the
yellow wasmisregistered
at amagnitude,
but
the
magenta,
cyan,
andblack
were
registered
Before
doing
allthe
misregistered
sample
proofs,
a
test
experiment
had been done using only
two
misregistrationmagnitudes
1/4
and
1/2
dot
size.
Thirty
six misregisteredsample
proofs
were
made
under
this
conditionof
eachseparation
(except
black)
for
three
originals
andtwo
separation
methods.
Then
agroup
ofpeople,
five
persons,
were askedto
view
those
proofs
randomly
with
a30cm
to
40cm
distance
anda
D-50
light
source
viewing
booth.
All
ofthem
could notdetect
that
there
wasa
registration
difference
between
proofs.
This
meant
the
misregistration magnitude of ahalftone
reproduction under or equalto
onehalf
dot
size on50%
dot
areais
not noticeableby
the
human
eye withoutany
equipment
in
65
line/ inch
screen ruling.After
this
test
experiment,
fifty
four
sample
proofs
ofthree
originals were madewith
three
misregistration
magnitudes
(one,
one andhalf,
andtwo
dots)
for
three
color
separations
(yellow,
magenta,
cyan)
using
two
separation
methods
(conventional
chromatic andGCR).
Each
proofwas
made
by
only
one misregistration magnitude of one colorseparation at a
time.
Every
sampleproof
only
has
one colorseparation misregistered with
the
black
separation
which
been
alwaysprecisely
registered.As
aexample,
the
yellow
was misregistered with
the
magenta,
cyan,
and
black
All
color
sample
proofswere
reproduced
by
the
3M
Matchprint
II
Positive
Proofing
System.
It
includes:
3M
Matchprint
Laminator,
Olite
Exposure
System,
Olix
Light
Integrator
A1970,
MR427
Positive
Proofing
Processor,
andSWOP/GroupVI
positive
proofing
film.
In
order
to
have
optimum
resolution
anddensity
ofreproductions,
a3M
microline
target
was providedduring
each
exposure
to
give arange
ofdots
from
two
to
ninety
eight
percent.The
processing
temperature
ofthe
MR427
processor was
maintained
between
seventy
four
andseventy
eight
degrees
Fahrenheit.
Totally
there
weresixty
proofsbeen
usedin
category
analysis
for
this
study,
six ofthem
wereprecisely
registered and
the
others were misregistered withthree
different
magnitudes.Since
the
size of adot
of50%
dot
area
in
65
line/inch
screenruling
is
equalto
0.2mm.
Those
misregistration magnitudes were
0.2mm,
0.3mm,
and0.4mm
in
terms
of metric system.All
the
proofs weretrimmed
to
onesize,
sevenby
five
and
half
inches,
and mounted on a matte whitecardboard
with
a
size of eightby
six andhalf
inches
before
presentedto
3.
Subjective
Visual
Evaluation
All
the
facsimile
reproductions:prints,
proofs,
printedmaterials,
etc.
were
made
to
be
viewed
by
human
eye.And
no
proper
device
could
be
used
in
this
study
to
observe
the
sharpness
and
detail
change
excepting
human
eye.
So,
subjective
visual
evaluation
was
used
in
this
study
to
determine
the
image
quality
of
those
sample
proofs.The
image
quality
relationship
between
sample proofsusing
different
colorseparation
methods
and misregistrationmagnitudes
was
derived
by
category
analysis.Thirty
observers
were
chosenrandomly
from
the
generalpublic
to
evaluatethe
image
quality
of sample proofs.A
Macbeth viewing booth
withD-50
fluorescent
light
sourcelocated
atSensi
Complex
ofCenter
for
Imaging
Science
ofR.I.T.
was usedto
provide a standardillumination
for
the
subjective visual evaluation of sample proofs.
The
viewing
distance
for
observers was withinthirty
to
forty
centimeters.The
observers were askedto
observethe
overall color
hue
shift,
sharpness,
anddetail
ofthe
proofs.
The
observers were not allowedto
touch
the
proofsor permitted
to
changetheir
ratings.Scratches,
dirt
spots,
andthe
surface reflection onthe
proofs wereto
be
ignored.
The
subjective visual evaluation wasbased
upon
the
observers'overall
impression,
satisfaction,
and
4. Data Collection
For
the
method
ofcategory
analysis,
data
werecollected
by
arating
scale.
A
rating
form
was usedto
retain
the
use ofthe
term
scale
for
the
results ofapplying
a
formal
scaling
model.
A
rating
form
was a set ofcategories
by
which
asubject
was
required
to
partitiona
set
of
stimuli
into
mutually
exclusive
classes(Ref. 24).
In
this
method,
sample proof was presentedrandomly
to
the
observerone
at atime.
Then
the
observer was askedto
choose a
rating
which
best
representshis
preferencein
color
performance,
sharpness,
anddetail
for
the
proof.A
rating
form
wasdefined
and provided asfollows:
1
excellent2
very
good3
good4
acceptable5
unsatisfactory
6
poor7
unusableThree
precisely
registered conventional chromaticseparation proofs were presented as
rating
oneto
the
observers,
sothey
couldhave
a pointto
start with.Fifty
seven proofs were viewed and given ratings
by
thirty
observers.
After
that,
three
precisely
registeredGCR
observers.
Totally,
fifty
four
sample
proof
rating
data
were
analyzed
by
the
method
of
category.
All
thirty
observers
made
their
evaluationin
a singlesession
lasting
aboutthirty
minutes.
During
this
period oftime,
the
observers
were
asked
to
perform
as consistent aspossible.
5.
Category
Analysis
Each
proofhad
thirty
observers's
preferred ratings(categories)
from
oneto
seven.The
frequency
of ratingswere obtained
by
adding
up
allthe
number of observersin
each
rating
(category)
for
every
proof.Then
the
frequency
of
ratings weretransformed
into
cumulativeproportions,
Pjk,
of ratingsfor
eachproof,
asin
table
1.
From
atable
of
the
normalprobability
distribution,
these
proportions,
Pjk,
weretransformed
into
normaldeviates,
Yjk;
in
table
2
appear
the
Yjk
corresponding
to
the
Pjk
oftable
1.
When
the
values of cumulative proportions moreextreme
than
.01 or .99,the
sampling
of variance of normaldeviate
is
intolerably
large.
For
this
reason,
in
Table
2,
aYjk
value was estimated when
the
corresponding
Pjk
valuein
The
estimation
was
proceeded
as
follows.
The
meandifference
between
the
existed
Yjk
in
two
adjacent
columns
of
table
2
was
found,
based
upon
only
those
rows
of
a
table
in
which
a
Yjk
value
was
recorded
in
each ofthe
two
columns.
This
meandifference
then
wastaken
asthe
expected
increment
in
Yjk
values
in
those
cases where noentry
existed.
These
estimates
were
recordedin
parenthesesin
the
appropriate
cells.
In
the
sameprocedure,
estimates
were obtainedfor
the
missing
Yjk.
Adding
the
meandifference
between
two
adjacent
columns
to
the
estimatesin
parentheses,
columnn,
yielded
the
estimates
in
parentheses,
column n-1.Subtracting
the
meandifference
to
the
estimatesin
parentheses,
columnn,
yieldedthe
estimatesin
parentheses,
column n+1.
The
boundaries
of categories weredetermined
by
adding
all
the
normaldeviates,
Yjk,
together
in
each column anddividing
by fifty
four.
Then
shiftedthe
boundary
scaleby
adding
the
average oftwo
boundaries,
column3
and column4,
to
eachboundary.
The
fourth
category
ofthe
rating
form
was named "
acceptable,"
neither
like
nordislike,
a neutralcategory.
The
midpoint ofthe
fourth
category,
equidistantfrom
the
upperbound
ofcategory
3
andthe
upperbound
ofcategory
4,
wasthe
average ofthese
two
boundaries.
Now,
the
boundary
scale originis
atthe
pointof
neutrality
or
The
cumulative
proportions
were
plotted againstthe
shifted
boundaries
on
normal
probability
paper.
A
straightline
was
drawn
so
as
to
minimize
approximately
the
verticaldiscrepancies,
in
proportion
units,
of pointsfrom
the
line.
The
intercept
of
the
line
of
the
best
fit
with
the
valueP=.50
provided
anestimate
for
the
mean ofboundary
scaleof
a
proof.
Therefore,
eachproof
had
aboundary
scalevalue,
boundary
mean,
to
represent
its
image
quality
in
the
methodof
category.
6. SQF
and
Boundary
Scale
To
apply
SQF
value
to
sampleproofs,
subjective visualevaluation
wasperformed
in
this
stage of study.Eighteen
out of
fifty
four
misregistered proofs withapproximately
even
distance
of scale valueto
each other and sixprecisely
registered proofs were evaluated against
the
standardSQF
photographic
images.
The
image
quality
ofthose
proofs onthe
SQF
scale weredetermined
subjectively.Those
boundary
mean values andSQF
values of eighteenmisregistered proofs were analyzed
by
the
method oflinear
regression.
This
method provided a closeapproximation
andthe
best
possiblefit
to
the
data
points.The
SAS
softwarepackage
in
VAX/VMS
was usedto
do
the
regression
analysis.
Then
three
regression equations wereperformed
to
express
the
relationship
between
boundary
scalevalue
andSQF
value
equations,
all
the
boundary
means
weretransformed
into
corresponding
SQF
values.The
SQF
value of aproof
is
the
output
image
quality
ofthe
original.
The
SQF
values
were
plotted
versus
the
misregistrationmagnitudes
for
each
colorseparation
method andimage.
Six
plots
were
obtained,
each
of
them
containing
three
colorinks's
performance
in
misregistration.
Using
five
units ofSQF
value asJND,
the
relationship
between
two
different
color separation methods was
investigated,
andthe
ChapterV.
EXPERIMENTAL
RESULTS
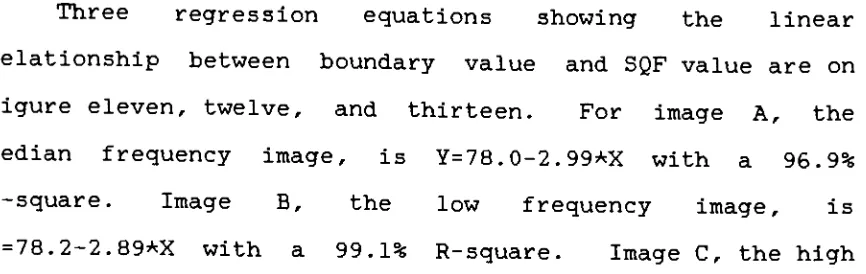
Three
regression
equations
showing
the
linear
relationship
between
boundary
value
andSQF
value
are onfigure
eleven,
twelve,
and
thirteen.
For
image
A,
the
median
frequency
image,
is
Y=78.
0-2.
99*X
with a
96.9%
R-square.
Image
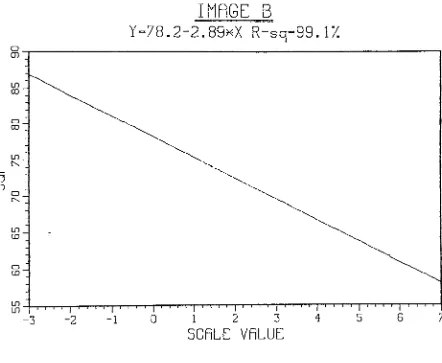
B,
the
low
frequency
image,
is
Y=78.2-2.89*X
with
a99.1%
R-square.
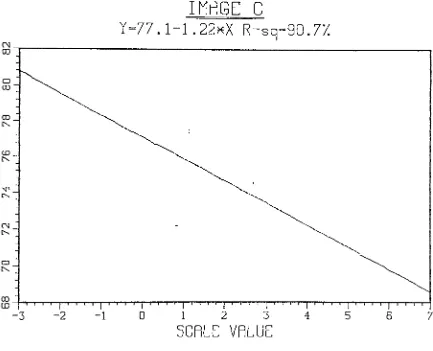
Image
C,
the
high
frequency
image,
is
Y=77
.1-1
.22*X
with
a90.7%
R-square.
Table
three
contains
the
misregistration
magnitudes,
boundary
mean
values,
andcorresponding
SQF
valuesfor
eachsample proofs.
The
plots ofSQF
value versusmisregistration
magnitude are onfigure
fourteen,
fifteen,
sixteen,
seventeen,
eighteen,
and nineteen.There
arethree
lines
in
each
plot withsquare,
circle,
andtriangle
symbols.
The
square symbol representedthe
yellow
ink,
the
circle symbol represented
the
magenta
ink,
andthe
triangle
symbol
representedthe
cyanink.
The
image
quality
of proofs ofthe
sameoriginal
within
0.0
and0.1mm
magnitudeshad
the
sameSQF
value.The
yellow
ink
had
the
best
performancein
allmisregistration
magnitude of
three
images
for
both
separation methods.In
image
A,
the
yellowink
had
less
than
oneSQF
difference
between
two
separation methods on0.2,
0.3,
and0.4
mm
[image:40.531.30.463.93.230.2]B
and
C,
all
the
SQF
difference
between
two
separationmethods
was
less
than
one
on
those
magnitudes.The
magenta
ink
had
the
worst
performancein
eachimage
from
the
magnitude
0.2mm
to
0.4mm.
Excepting
in
image
A
conventional
chromatic
separation
with
0.4mm
magnitude,
andGCR
separation
with0.2
mmmagnitude,
it
had
performedthe
same
(same
SQF
value)
withthe
cyanink.
The
magentaink
was carried out
differently
by
a range of1.5
to
2.6
SQF
values
in
those
two
separation
methods ofimage
A.
Same
distance,
but
shiftedby
0.3
units,
it
was1.2
to
2.3
SQF
values
in
image
B.
In
image
C,
the
difference
wasclose,
0.7
SQF
values,
on0
.2
and0.3mm.
But,
it
became
4.6
SQF
values on
the
magnitude of0.4mm.
The
SQF
valuedifference
oftwo
separation methods wasfrom
1.0
to
4.1
in
image
A
for
cyanink.
And
it
was shiftedby
0.7
SQF
units,
0.3
to
3.4,
in
image
B.
In
image
C,
the
o.
(J!
IMRGE
R
Y=78.0-2.99*X
R-sc|=96.9X
LD -1 I
|
II I I [
I c I I | I I I 1
|
r0
12
3
SCRLE
VALUE
-i i i t i i i i i i i i r -I I I I I I i I
r--3
[image:42.531.20.462.194.553.2]o en
IMRGE
B
Y-78.2-2.89xX
R-sq-99.17.
oo
CD
CO
O
CO
in
ex'
LD ID
'
CD
'
LD LT>
-r
i i i i i I l I i T 11 1 1 I I 1 T-l 1
1
I-1 1 1
1
1 1 1 I|
I 1 1 1 10
12
3
4
5
SCALE VALUE
[image:43.531.22.464.194.557.2]CO
CD ID
IMRGE
C
Y-77.l-l.22xX
R-sq=90.7X
-i r
i i i i i i I i
|
i I i i|
I i I i|
ri i i|
i I i I|
i i i i|
ri i i r i i i r
-2-10
1234567
SCALE
VALUE
[image:44.531.29.462.203.554.2]ID
CD
D CO
o ex
ID
IhRGE
R
Con.
Chromatic Separation
'V^
^
0.0
0.1
0.2
0.3
Magnitudes
of
Misregistration
(mm)
0.4
x
INDICATES
THE
95%
CONFIDENCE
INTERVAL
FOR
YELLOW
[image:45.531.54.496.194.541.2]0.0
INRGE
R
GCR
Separation
0.1
0.2
0.3
Magnitudes
of
Misregistration
(mm)
0.4
[image:46.531.34.484.205.548.2]CO
INRGE
B
Con.
Chromatic Separation
0.0
0.1
0.2
0.3
Magnitudes
of
Misregistration
(mm)
0.4
[image:47.531.43.499.190.538.2]0.0
IMRGE
B
GCR
Separation
0.3
Magnitudes
of
Misregistration
(mm)
0.4
[image:48.531.39.494.200.543.2]o
en
IMRGE
C
Con.
Chromatic
Separation
0.0
0.1
0-2
0.3
Magnitudes
of
Misregistration
(mm)
0.4
[image:49.531.39.506.174.534.2]LD
CO
O
CO
o tx
LD
CD
INRGE. C
GCR
Separation
-^
1
;c
Jt
[
-_
-t
-^^
-I'
1 1 i
0.0
0.1
0.2
0.3
Magnitudes
of
Misregistration
(mm)
0.4
[image:50.531.38.509.186.537.2]ChapterVI.
DISCUSSION
As
discussed
in
chapter
four
section
two,
an
off-pressproofing
system,
3M
Matchprintll
,was
used.
It
provided aneasier
way
to
control
the
tone
reproduction,
eliminated
the
other
variables
which
usually
happened
in
multicolor
halftone
printing.
Therefore,
the
image
quality
difference
between
sample
proofs
wasonly
the
result ofthe
misregistration and
separation
methods.
In
general,
GCR
proofshad
higher
SQF
valuesthan
conventional chromatic proofs
in
the
magnitudesfrom
0.2
to
0.4mm.
Especially,
the
cyanink
misregistered proofsin
image
A
andB
of a magnitude of0.4mm,
andthe
magentaink
in
image
C
with0.4mm