International Journal of Innovative Technology and Exploring Engineering (IJITEE) ISSN: 2278-3075,Volume-8, Issue-12, October 2019
Abstract: Universiti Tun Hussein Onn Malaysia (UTHM) collaboration with the Center of Applied Geomatics for Disaster Prevention (CAGeD) had developed an observation station as a catalyst for oceanographic and environmental research work and landmark of development in Tanjung Laboh. In conjunction with the construction of the station, monitoring of coastal process was carried out to identify the characteristics of sediment as input to the transportation of sediment around the construction area of the station in Tanjung Laboh. 20 points of surface sediment sampling were carried out along 200 meters of Tanjung Laboh bay during high tide. At the same time, the current speed test was carried out at the same point to identify the relationship of current speed to the transportation of sediment. All collected sediment samples have performed a test using wet sieve analysis (hydrometer), dry sieve analysis and specific gravity. The result found that the specific gravity of sediment at the study area is 2.53 and categorized as marine clay. The particle size distribution of sediment at the study area is silty clay due to the dominant of silt fraction. The percentage of sediment characteristics can be influenced by current velocity and sediment transportation.
Keywords : Sediment characteristic, surface sediment sampling, sediment transport, , hydrometer test.
I. INTRODUCTION
The development and utilization of coastal zones have extremely rising during last decades and likely to be grown from this time forth. In addition, the coastal area shows patterns of population structure and development which partly related to the trend of global growth and urbanization [1]. However, Malaysia coastal zone has significant socio-economic and environmental. It can fit a huge population percentage, and also being the center of economic activities such as urbanization, oil and gas exploitation, highway, airport, agricultural, fisheries and etc. [2]. As the standards of living and development has been increased in the coastal zones, this is in response to the expanding realization to the stability of the coastline [3]. Stability of the coastline will change by human and natural factor [4].
About 20 years ago, Malaysia coastline is facing erosion [5]. 55% of Peninsular Malaysia exposed to the shoreline vulnerability index (SVI) in between high and extreme [6]. Batu Pahat is an area of the most vulnerable to risk of coastal erosion that happened from 2007 [7]. Nine locations of Johor southwest coast has been classified as critical eroded during
Revised Manuscript Received on October 5, 2019.
* Correspondence Author
Sr. Dr. Anuar Bin Mohamad Salleh*, Department of Infrastructure and Geomatics, Universiti Tun Hussein Onn Malaysia, Batu Pahat, Johor, Malaysia.
Nursyahillah binti Nadzir, Department of Infrastructure and Geomatics, Universiti Tun Hussein Onn Malaysia, Batu Pahat, Johor, Malaysia.
2009 which are Minyak Beku, Tanjung Laboh, Parit Balau. Punggur, Sungai Ayam, Tampok, Sungai Lurus, Koris, and Parit Balau [8].
Tanjung Laboh beach encounter southwest monsoon and also has semi-diurnal mixed tide. According to [9], sediments along the Straits of Malacca shoreline is mostly muddy. Development will also take place in the coastal area of Tanjung Laboh. Therefore, UTHM in collaboration with CAGeD has built an observation station on this muddy beach area. This construction will assist in field work before development is done around the Tanjung Laboh area.
Morton [10] states, coastal features such as sediment composition, water level, morphology, and vegetation were also influence the process of erosion or sedimentation. The erosion process causes sediment transport to occur and is proportional to the movement of water and sediment particles [11]. It can be seen in the size, and distribution of sediment along the coast which increased from 4000 to 6000 years ago [12].
Therefore, a study was conducted to identify sediment characteristics which is a preliminary study to determine sediment transport as a result of the construction of a CAGeD observation station on the coast of Tanjung Laboh.
II. DEVELOPMENT OF CAGED OBSERVATION
STATION
The development of CAGeD observation station is divided into two phases:
A. Design of Observation Station
First, existing coastal structures design were reviewed such as bamboo pile walls [13] and T-groyne bamboo wave screen [14]. Afterward, the observation station was design based on the topography and oceanography data of the study area. Figure 1 shows the design of CAGeD observation station. There are several factors to be considered in designing the structure. Location of station need to be far away from mangrove forest to minimize the impact on the environment, not located on the access road and also do not consist of rocky seabed to avoid difficulty of piling process.
Based on the Malaysian Meteorological Department and manual observation, the maximum tide in year of 2018 was 3.26 meters. Therefore, design of height of observation station was more than 3.5 meters to ensure the stability of station and user safety. According to control plan, the maximum length of the station that can be built was 272 meters seaward.
CAGeD observation station was made up of over 300 poles with distance of 1.5 meters and
the main material for the
Development of CAGeD Observation Station
and Its Impact on Coastal Process
construction was bamboo and wood plank. Cost saving was taken into consideration in preparing the construction material. Bamboo was chosen over concrete because concrete is much expansive rather than bamboo. Plus, concrete-based construction required heavy machine and large pontoon that will give huge impact on the mangrove surrounding. Bamboo is a sustainable product. At the same time, bamboo structures is easier than permanent structure for relocating, modifying and extension work.
Fig. 1. The structural plan for the CAGeD observation station
B. Construction Process
A total of 800 bamboo poles were collected nearby village for the construction of CAGeD observation station. To standardize the size of the bamboo in the construction of observation stations, bamboo harvested over 10 to 12 meters length and 0.1 meters in diameter.
Overall construction of station was carried out manually. There were no heavy machinery used. This method was selected because of a very minimal workforce to the environment. In the construction process, there were three stages which are construction of jetty following by installation of platform and lastly construction of hut.
Construction of jetty
In the beginning of work, the collected bamboo poles were transport to the study area. Setting out point was marked before piling process begin. Bamboo pole were manually piled with the distance 1.5 meters from pole to pole. There were 315 bamboo poles in the construction. The connection of pole and braces was made by tied using rope.
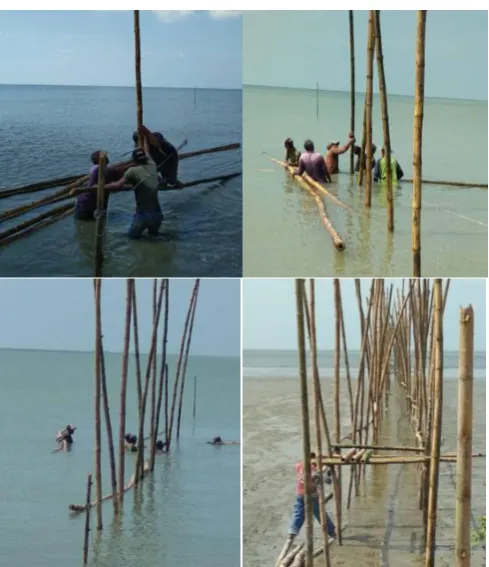
Piling process only started during high tide. This is because factor of muddy area makes movement during construction difficult. However, the piling process can only take four to six hours depending on the tide in the area. Figure 2 show the process of piling bamboo poles.
Although manual construction gave minimal impact on the environment, but there were some issues happened during construction which were construction progress and transporting material. In manual construction methods, the number of skilled workers was considered as a factor in construction progress. The shortage of skilled worker has slowed down the day-to-day construction progress. Addition to that, construction time was limited by influence of tide and weather. The transportation of building materials from coast
[image:2.595.50.289.169.314.2]to the point of structural design is also difficult to carry out by manual method and becomes more complicated as construction reaches the middle of sea.
Fig. 2.Manually piling of bamboo stick by skilled worker during high tide and condition of bamboo pole
during low tide.
Process of jetty construction were continued with the construction of beam by using wood. Construction of beam started after the bamboo poles completely piled. Connection between wood beam and bamboo pole was made by nailed and also tied using rope.
(a) (b)
Fig. 3.(a) Construction of bamboo pole and wood beam, (b) connection made by tied using rope.
Installation of platform
Platform of observation station were installed by using wood plank with approximately 2.0×0.05×0.1 meters in size. Installation started after bamboo pole and wood beam complete constructed. Wood planks were connected to the beam by nail and over 500
[image:2.595.305.555.503.645.2]International Journal of Innovative Technology and Exploring Engineering (IJITEE) ISSN: 2278-3075,Volume-8, Issue-12, October 2019
[image:3.595.45.292.100.238.2]work progress unlike jetty construction. Skilled worker can still proceed the work when raining. Work process of platform installation as shown in Figure 4.
Fig. 4.Installation of platform using used wood plank collected from nearby village.
Construction of hut
Process of hut construction was same as process of jetty construction. Piling bamboo poles, beam and wood plank installation started after jetty completed. The main function of the hut is to provide convenience to the users especially observer during fieldwork. The design of the hut must have the right size to accommodate the user and the equipment. There were a store to keep equipment, toilet and bench provided in the hut. 12.0×9.0 meters of hut size was enough to provide facilities on the station. Process of constructing hut shown in Figure 5.
Fig. 5.(a) Built a frame of hut using bamboo, (b) construct wood beam, (c) installation of platform and (d) construction of hut completed with a store, toilet, and bench.The construction of observation station has been completely built within six months as one of the landmarks of the Tanjung Laboh. It also serves as a catalyst for oceanographic and environmental research work. However, this construction is likely to affect coastal processes around
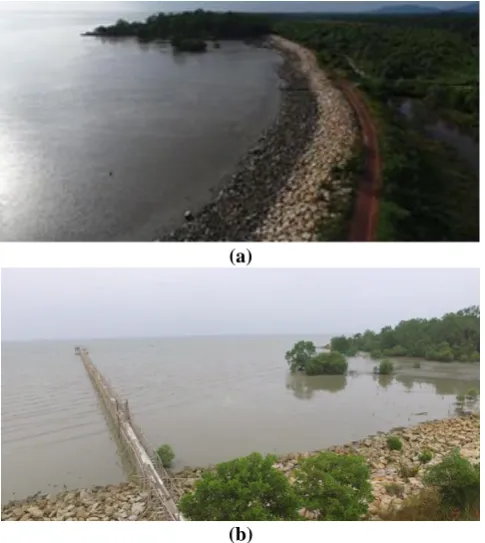
the study area. Therefore, coastal process monitoring work was carried out to identify the characteristic of sediment as input for sediment transport process at the study area. Figure 6 shows the situation of study area before and after the construction of CAGeD observation station.
(a)
(b)
Fig. 6. (a) Condition of study area before the construction begin, (b) after the construction had
completed
III. MONITORING OF COASTAL PROCESS
In order to identify the characteristic of sediment as input for sediment transport process, there were two parts of method contributed which are a sediment sampling and following by flow rate test. Then, laboratory test was conducted on the collected data.
Sediment sampling
In the process of sediment quantification, the method used was sediment sampling. This method was reviewed from [15]-[17]. Sediment sampling were carried out along 200 meter of Tanjung Laboh bay. With interval 50 meters of every point and 80 meters seaward, these 20 points were made to cover the entire study area, especially around the station. There are 18 points around the station and 2 points outside the station area. Determination of these points is made to see the difference and impact of sediment transport around the station area and outside the station. Figure 7 shows the schematic location with known coordinate of sampling point around station at Tanjung Laboh bay.
A B
[image:3.595.306.549.124.396.2]Fig. 7.Schematic location of sampling point around study area.
Sediment sampling was conducted on March 21, 2019 during high tide due to muddy area. Muddy condition made movement from one point to another point is difficult during low tide. Sampling were made from A1 point until E1 point. Sediment samples from the top 1 meter layer were taken using peat sampler. For subsequent laboratory analysis, the samples were preserve in plastic bag inside airtight container.
Current speed test
[image:4.595.302.553.51.181.2]Then, current speed test was conducted at the same point of sediment sample collection. This test was conducted to identify the relationship of current velocity to the transportation of sediment. AEM1-D current meter was used in this test. Measurement taken by submerged current meter into the water at 60 percent of water depth. Velocity of water were recorded and tabulated in Table 1 and overview of sediment sampling and flow rate test show in Figure 8.
Table- I: Current speed at the Tanjung Laboh beach March 21, 2019 during high tide
Point Velocity (m/s)
A1 0.082
A2 0.067
A3 0.068
A4 0.076
A5 0.044
A6 0.040
B1 0.144
B2 0.078
B3 0.081
B4 0.067
B5 0.057
B6 0.046
C1 0.075
C2 0.081
C3 0.100
C4 0.085
C5 0.111
C6 0.186
D 0.194
E 0.218
(a) (b)
Fig.8.(a) Sediment sampling, (b) current speed test.
Laboratory test
Particle size distribution test was performed to discriminate and determine the quantity of soil particles with reference to clay, silt, sand and gravel. The collected samples was performed a test using wet sieve analysis, dry sieve analysis and specific gravity according to (BS1377: Part 2: 1990) . Dry sieve analysis was performed using 0.063 mm to 5 mm sieve while wet sieve was performed using hydrometer (since grain size are passing 0.063 mm sieve). While, specific gravity for coarse grain was determined by using small pycnometer.
In the end of the test, quantification of soil at Tanjung Laboh was determine based on British standard range of particle sizes with reference to clay (0.002 mm and below), silt (0.002 – 0.06 mm), sand (0.06 – 2 mm) and gravel (2 – 60 mm).
IV. CHARACTERISTIC OF SEDIMENT
According to [18],[19], the primary sediment along muddy beach of west coast Johor was determine as marine clay and it is normally correlated to the coastal mangrove forest. Since Tanjung Laboh beach was situated around the muddy area, marine clay is proposed to be identified. Normally, content of sediment characteristic in every area of beach is kind of dissimilar. Therefore, the characteristic of sediment with related to the current speed in this study area are discussed in the subsequent section.
Particles size distribution
Hydrometer tests were conducted on the collected sample after passing through 0.063 mm sieve (between 40g to 49g) to identify the sediment size distribution around the jetty structure at Tanjung Laboh as shown in Figure 9(a)-(d).
[image:4.595.304.549.606.840.2]International Journal of Innovative Technology and Exploring Engineering (IJITEE) ISSN: 2278-3075,Volume-8, Issue-12, October 2019
(b)
(c)
[image:5.595.45.292.50.486.2](d)
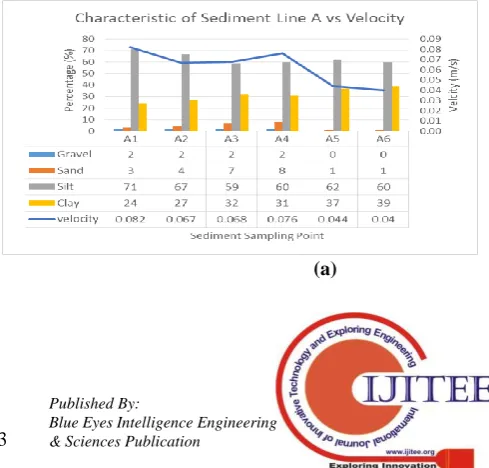
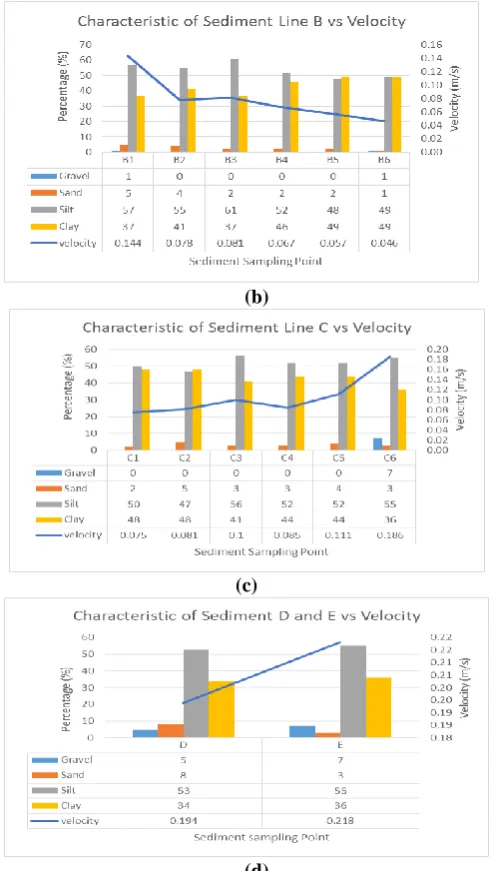
Fig. 9.Percentage of sediment characteristic along with velocity (a) at line A; (b) at line B; (c) at line C; (d) at
point D and E
On line A, point A1 has the highest percentage of silt and the lowest percentage of clay. This is due to the high current velocity and the point is also close to the coastline. When it comes to the center of the bay, a high percentage of sand and gravel is caused by deposition of sediments near the coastline. Whereas the value of clay at point A6 is the highest because it is close to the mangrove forest where mangrove acts as a natural wave breaker.
While on line B, the percentage of silt decreased and percentage of clay increasing compared to line A. Percent of clay increase occurred after the current flow passing through the station. This can be proved by the value of current velocity in the area B4, B5, B6 are decreasing.
When the sampling point approaches the middle of the sea, the percentage of silt and clay is almost equal. Line C shows higher current velocities and is proved by the rising of percentage of sand and gravel. In addition, the percentage of clay increases. This condition is similar to line B after the current flow passes through the station.
Point D and point E are located 400m seaward which
means there is no obstacle by station for current flow. This can be proof by the current velocity. Current velocity increases as it comes to the middle of the sea. For both points, the difference can be seen from the percentage of sand and gravel. Point D has the highest sand value and point E has the highest percentage of gravel. Unfortunately, the percentage of clay for point E is high compared to point D because there is a boulder around the area of point E.
Result can be conclude that percentage of clay increase as the velocity decrease after current passes through station. Current velocity started increasing after points are away from the station.
Specific gravity, Gs
The specific gravity, Gs for sediment samples at Tanjung Laboh also identified. The pycnometer was used for coarser sediment samples and gave the result of specific gravity is 2.53. This result have been tabulated in Table 2.
Table- II: Data of specific gravity for every sample Point Specific gravity value
A 2.37
B 2.44
C 2.56
D 2.75
Average of all
sample 2.53
According to [20] specific gravity for category marine clay is in range of 2.4 and 2.6. While study by [21], marine clay can be indicate in average of specific gravity is 2.6. However, [22] describe the value of specific gravity which is 2.6 until 2.9 was categorized as silt and clay.
V. CONCLUSION
The development of the CAGeD observation station has become a landmark for the Tanjung Laboh area. UTHM's efforts in constructing the station will assist in fieldwork as well as oceanographic and environmental studies in long-term. However, this construction has an impact on the coastal process. Particles size distribution test and specific gravity test were conducted to identify the characteristics of sediment as input to the sediment transportation. The sediment sampling and flow rate test were the method that have been used in achieved the objectives.
As a summary to the test have been conducted, the sediment type was classified as silty clay due to the dominant of silt fraction followed by clay, sand, and gravel. Majority of sediment was pass through 63 micron. The specific gravity indicates that the sediment density is 2.53 which can be categorized in silt and clay.
The percentage of sediment characteristic can be influenced by current velocity and sediment transportation. As there was obstacles from station, the result showed the current velocity is decreased after passing through station. Addition to that, the percentage of fine grained such as silt and clay were increased.
According to [23], transportation of sediment along the west coast Johor (including Tanjung Laboh) was moderate or low where fine sediment is likely
[image:5.595.321.539.273.357.2]such as coastal mangrove forests or any barrier. Furthermore, coastal that has high flow rate is dominated by coarse sediments such as gravel and sand. While, coastal with low flow rate is dominated by fine sediments such as clay and silt as in Tanjung Laboh coast [24].
ACKNOWLEDGMENT
This paper is fully financed by Universiti Tun Hussein Onn Malaysia GPPS Grant Scheme (Vot H292: Establishment of Data Observation Station at Tanjung Laboh and Its Impact on Physical Oceanography) and TIER 1 Grant Scheme (Vot U846: Development of Ocean Surface Wave Monitoring System). The authors thanks to Universiti Tun Hussein Onn Malaysia for the approved fund which makes this paper viable and excellent.
REFERENCES
1. B. Neumann, A.T. Vafeidis, J. Zimmermann1, R.J. Nicholls. (2015). Future Coastal Population Growth and Exposure to Sea-Level Rise and Coastal Flooding - A Global Assessment. PLoS ONE. 10(3), Available: e0118571. doi:10.1371/journal.pone.0118571
2. A. Salleh and M. Daud, (2016, March). An observation technique and GPS buoy processing strategy for ocean surface monitoring. Advances in Civil, Architectural, Structural and Constructional Engineering, pp. 347–350.
3. A. Jahangirzadeh, S. Akib, B. Kamali, N.S. Shamsudin, K. Kimiaei. (2012). Effects of Construction of Coastal Structure on Ecosystem, pp. 663–674.
4. R.A. Morton. (2003). An Overview of Coastal Land Loss: With Emphasis on the Southeastern United States. U.S. Geological Survey. USGS Open File Report, pp. 03-337.
5. Z. Md Ali and L.W Tan. (2012). Erosion scenario along Malaysian coastline. Proceeding of Persidangan Kebangsaan Hidrologi dan Alam Sekitar Kali ke-2 (HIDRAS 2012), Universiti Tun Hussein Onn Malaysia.
6. H.L. Lee and M.F. Mohamad. (2010). Coastal vulnerability assessment for Peninsular Malaysia coastline. Proceeding of National Seminar on Coastal Morphology (COSMO) 2010, The Muddy Coast of Malaysia. National Hydraulic Research Institute of Malaysia (NAHRIM). 7. H.F. Peter. (2005). Coastal Boundaries. Encyclopedia of Coastal
Science.
8. J. Ahmad, (2009, July 29). Tangani hakisan pantai. Utusan Malaysia, Utusan Melayu (M) Berhad.
9. H.L. Lee and M.F. Mohamad. (2010). Coastal vulnerability assessment for Peninsular Malaysia coastline. Proceeding of National Seminar on Coastal Morphology (COSMO) 2010, The Muddy Coast of Malaysia. 10. R.A. Morton, (2004). An overview of coastal land loss with emphasis on the southeastern United States, Open File Report 03-337. St. Petersburg, FL: U.S. Geological Survey, Center for Coastal and Watershed Studies, pp. 29.
11. C.T. Yang. (2003). Sediment Transport: Theory and Practice. Krieger Publishing Company.
12. H. Chen, H. Tang, Y. Liu, H.Wang, G. and Liu. (2013). Measurement of particle size based on digital imaging technique. Journal of Hydrodynamics. 25(2), pp. 242-248.
13. S. Harihar and H.J. Verhagen. (2016). Application of bamboo in mangrove rehabilitation projects. Proceedings of the Institution of Civil Engineers.
14. H.J. Verhagen and T.T. Loi (2012). The use of mangroves in coastal protection. Proceedings of 8th International Conference and Coastal and Port Engineering in Developing Countries, Madras. IIT Madras, Chennai, India.
15. M.Z. Ali, W.L. Tan, L.M. Khalid. (2013). Morfologi dan Taburan Sedimen di Teluk Wawasan. Persidangan Kebangsaan Geografi & Alam Sekitar Kali Ke 4. Anjuran Jabatan Geografi dan Alam Sekitar, Fakulti Sains Kemanusiaan, Universiti Pendidikan Sultan Idris, pp. 459-466 (in Malay).
16. M.Z. Ali, W.L. Tan, S.S.M.M. Tahar, A.A.F. Hakimd. (2015). Sediment properties of Pantai Punggur. Proceedings of Sixteenth The IIER International Conference, Kuala Lumpur, Malaysia, pp. 114-119.
17. S.A. Haghshenas and M. Soltanpour. (2011). An analysis of wave dissipation at the Hendijan mud coast, the persian gulf. Ocean Dynamic. 61, pp 217-232.
18. K.C. Sieh, Z. Midun, S.C. Lee, A.A. Ibrahim, S.M.S. Abdullah, and I. Iman. (1988). Assessment of coastal erosion. ASEAN-USAID Coastal Resources Management Project Task 241M-243M.
19. D. Tjahjanto and Sriyana. (2010). Study on Shoreline Erosion Problem along Senggarang Seashore, Batu Pahat, Johor, Report for UTHM. 20. Z.A. Rahman, W.Z.W. Yaacob, S.A. Rahim, T. Lihan, W.M.R. Idris,
and W.N.E. Mohd Sani. (2013). Geotechnical characterisation of marine clay as potential linear material. Sains Malaysiana, 42(8), pp 1081-1089.
21. S. Ramamoorthy. (2007). Correlation of engineering characteristics of marine clay from central west coast of Malaysia. Master Thesis, Faculty of Civil Engineering, Universiti Teknologi Malaysia. 22. B.M. Das. (2010). Principles of Foundation Engineering. 7th. United
States of America. Department of Irrigation and Drainage (DID). Coastal management, p. 1-25.Available: www.water.gov.my 23. Jabatan Perancangan Bandar dan Desa Semenanjung Malaysia
(JPBD). (2012). Rancangan Fizikal Zon Pesisiran Negara, Kementerian Perumahan dan Kerajaan Tempatan Jilid-1 (in Malay). 24. I. Roslan, J. Shamshuddin, C. Fauziah, and A. Anuar. (2010).
Occurrence and properties of soils on sandy beach ridges in the Kelantan–Terengganu Plains, Peninsular Malaysia. Centre of coastal engineering, 83(1), pp.55-63.
AUTHORS PROFILE
Sr. Dr. Anuar Mohd Salleh received BSc. of Geomatic Engineering from Universiti Teknologi Malaysia (UTM) He gained his Masters of Land Survey at UTM and PhD in Civil Engineering in Universiti Tun Hussein Onn Malaysia (UTHM). Sr. Dr. Anuar is currently a senior lecturer from Department of Infrastructure and Geomatics, Faculty of Civil and Environmental Engineering in UTHM. His research interests are in the area of ocean wave, environment monitoring and changes, Global Positioning System (GPS) and geomatics. He is also a member of Royal Institution of Surveyor Malaysia (RISM) in 2017 until present.