Abstract— Nitrobenzene and Nitrotoluene are potential explosives and pose a threat to mankind. As direct sensors for detection of these nitro-aromatic compounds are not available, an array of four gas sensors, sensing the aroma of explosives, along with a temperature and humidity sensor are exposed to varying concentrations of the explosives. An arduino based data acquisition system acquires the sensor arrays response and transmits it to a computer. Feature parameters of Area, Slope and Relative Response are extracted from the sensor response and are used to train and test for presence of explosives using supervised learning algorithms. After a comparative performance study of various such algorithms, the feedforward neural network with resilient backpropagation is employed for the detection of these explosives. The system is tested for 51 cases, where the explosive is mixed with air and not a pattern gas. The system correctly identified the presence of nitrotoluene and nitrobenzene with an accuracy of 94%. A user interface is developed for easy use of the system, which allows the user to set the training mode or testing mode of the system. This interface, pops up a message when it detects the presence of nitrobenzene or nitrotoluene before the explosion.
Keywords: Nitrobenzene, Nitrotoluene, Neural Network, Sensor Array
I. INTRODUCTION
For years, countries like Iraq, Syria, India, Afghanistan and many more have experienced terrorist activities, leading to the death of hundreds of soldiers and innocent people every year. These countries bear a huge monetary loss for dealing with such incidents. According to a recently submitted report [1], India, ranks 7th in the list of countries facing maximum terrorist attacks/ incidents. It is observed that most of the terror attacks are executed in civil areas, with use of explosives, which go untraced due to lack of simple, cost-effective techniques available to common man. This lacuna has motivated us to device a system that can be made available to everybody, for use in offices, schools, hospitals or crowded areas. This system is an inline application for detection of target explosives. Supervised learning allows reduction in time cycle and ensures potential utilization of its resources. Due to various algorithms and tools, supervised learning can take care of large and complex process environments with continuous quality assurance due to its
Revised Version Manuscript Received on July 18, 2019.
Dipali Ramdasi, Department of Instrumentation and Control, Cummins College of Engineering for Women, Karvenagar , Pune, Maharashtra, India.(E-mail : [email protected])
Rohini Mudhalwadkar, Department of Instrumentation and Control, Cummins College of Engineering for Women, Karvenagar , Pune, Maharashtra, India.(E-mail : [email protected])
ability to assess continuously and learn from data. It also leads to automation of tasks due to programming and use of computers.
In most of the cases, the explosive used is nitrogen based and exhibits a nitro-aroma. Two such nitroaromatic compounds with explosive properties are Nitrobenzene and Nitrotoluene. Nitrobenzene is an organic compound with the chemical formula C6H5NO2. It is water insoluble pale-yellow
oil with almond like odour and is used for the generation of explosives. Nitrotoluene is an organic compound with the chemical formula C7H7NO2. As both these compounds are
nitrogen based, they exhibit a nitro aroma. Mixtures with Nitrobenzene (NB) (PubChem CID 7416), 4 Nitrotoluene (NT) (PubChem CID 7473), are found to be highly explosive of high sensitivity and detonation velocity [2,3]. Also mixtures with nitrobenzene are spark detonable as mentioned by Bretherick [4]. Koldunov[3] has presented a study of liquid explosives, generated with nitromethane and nitrobenzene. The use of nitrobenzene and nitrotoluene as elements of explosive mixtures was reported 50 years ago by Mason[5]. Thus, these nitroaromatic compounds pose a threat to humans and their belongings. The developed system targets the detection of these two explosive compounds.
Many chemical compounds have sensors available in the commercial market, however, no direct, ready to use sensors are available for NB and NT in the Indian market. Thus, an array of commercial sensors available in Indian market are used for detecting the nitro-aroma of these compounds. The sensor arrays’ response is used to extract features which are used for training the neural network. The trained network, then is used for detecting the presence of explosives, typically NB or NT.
The sensors with specificity of ammonia, organic solvent vapors and oxides of nitrogen are selected for detecting the Volatile Organic Compounds (VOCs) emitted from the stored, non-detonated explosives[6]. Numerous scientists have worked upon enhancing the sensing mechanism for explosives and have developed specialized sensors for the target explosives[7-10]. However, availability of such sensors is stringent to common people. The objective of this work is to make available a system, to common people for detecting presence of explosives, in markets, schools, hospitals and crowded areas. The developed system is simple and will identify the presence of targeted explosives and indicate it's presence by popping up a message on the screen of a
Qualitative Detection of Nitro-Aromatic
Explosives using Supervised Learning Access
computer/ laptop. While Claude[11], Osowski[12], Depari[13] used sensor arrays for detection of target gas, their gases were hydrocarbons. Tony King[14] devised hard wired moths, where moths were attached with electrodes and trained for explosive detection. Though this system is effective, limited utility can be visioned for common man. Bing Luo[15] used a quad-rotor helicopter mounted with gas sensors for estimating the direction from where the odor comes from. However, the use of such systems for densely populated countries like India is limited.
Many researchers [12,13,16-20] used machine learning approaches, however, their target gas was not VOCs of explosives. Depari[13] developed the ANFIS algorithm, while Amine Bermak [16] used the Bayesian Learning Using Gaussian Process for Gas Identification with an average accuracy of 90.5% for hydrocarbons with a gas range of 25 ppm to 200 ppm. Lei[17] used the multilayer perceptron neural network for identifying indoor air contaminants. Khalaf et. al. [18] used a sensor array of commercially available five figaro sensors for identification limited to acetone, benzene, ethanol, isopropanol and methanol. Support Vector Machine (SVM) [21] and the least squares regression approach to predict the concentration of each type of analyte was used. Srivastava [19] designed and developed an electronic nose system based on Pd, Pt and Au doped tin oxide gas-sensors array and artificial neural network for the identification of some of the volatile organic compounds relevant to environmental monitoring. Olguín et. al. [20] developed an electronic nose system with metal oxide semiconductor sensors to discriminate and quantify different chemical warfare agents (CWA) mimics. The system consisted of an array of commercial MOS for different gases, two sensors for temperature sensing, a sample handling system, a data acquisition system and a laptop with the data acquisition system control. Quantification was done using Partial least square. In the developed system, a data driven modeling approach is used. The collected data is used to derive the feature parameter and then given to a suitable supervised learning algorithm. To select the appropriate algorithm, performance of various neural network algorithms is compared on the basis of accuracy, sensitivity, specificity, precision and time to train the network and the best performing network, that is the feedforward neural network with resilient backpropagation is used in the developed system. For the timely detection of explosives, a system is developed to interface the sensors as input and a computer or laptop as the decision-making device.
II. OVERVIEW OF THE SYSTEM
[image:2.595.317.506.56.171.2]For the timely detection of explosives, a system is developed to interface the sensors as input and a computer or laptop as the decision-making device. The details of the system are covered in reference [22], however a brief overview is presented in this section.
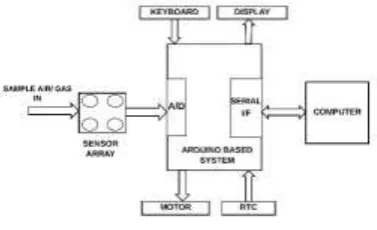
Fig. 1. Block diagram of the system
Figure 1 shows the block diagram of the system. The system based on the ATMega2560 based Arduino board at operating frequency of 16MHz. For detecting the presence of explosives, a detailed study of the sensors available in the market is done and a sensor array consisting of four gas sensors, typically TGS826, MQ135, TGS2201 and TGS822 along with temperature and humidity sensor, LM35 and DHT11 are interfaced to an arduino based data acquisition system [22]. The decomposition of nitrobenzene and nitrotoluene result into ammonia, methane, nitrogen dioxide, isobutane and hexane, where ammonia is the dominant element in both the reactions, with concentration ranging from a few ppb to hundred ppm. Hence the sensors sensitive towards the above elements are selected in the sensor array.\\ During the training mode, standard samples of Nitrobenzene (LOBA Chemie Pvt. Ltd. Mumbai, India) and Nitrotoluene (Research Lab Fine Chem Industries, Mumbai, India) are used for the experimentation. A sampling system is designed to acquire vaporized samples in required concentration. A pump is used to deliver the sample gas from the gas generating chamber to the sensors. The pump is driven by a motor, which in turn is driven by L293D, a high current half H-bridge drive for motors. A serial Real Time Clock (RTC) IC is used for providing the actual timings for the observations and the system operation. The keyboard and liquid crystal display (LCD) are included in the system to facilitate the setting of gas exposition time, pump speed and operating temperature locally. The system works on a 12 Volt battery and is portable. The sensor array is subjected to 102 varying concentrations of Nitrobenzene and Nitrotoluene from 200 parts per billion (ppb) to 200 parts per million (ppm).
Fig. 2. Derivation of Parameters from Sensor Response Each sensor’s response is acquired with a sampling time of 110 ms and is measured in terms of voltage, digitized and transmitted to a computer at a baud rate of 9600. This response is stored in the computer as a .csv file along with time stamps generated with the RTC. A software program then extracts the features of Area (A), Slope and Relative Response (RR) from the response of each sensor for every concentration of the explosive it is subjected to. The extraction of features is carried out using the equations (1-3) and are illustrated in figure 2.
(1)
(2)
(3)
[image:3.595.52.292.551.731.2]The Relative Response and Slope of the sensor response are calculated using the maximum value max(i), minimum value min(i) and time taken to reach the maximum value, using equation (1) and (3). An average of 25 values is considered for calculating the minimum value. Area under the curve of the sensor response is calculated using the trapezoidal rule. An approximate numerical solution was used for generating the program using equation (2), where A is the area, f(i)(t) is the response of sensor i at time t, f(i)(t+1) is the response of sensor i at time t+1, t = current time, n = total time for which sensor response is taken, Δt = time interval, preset to 110 millisecond. After every cycle, the sensor array is subjected to ambient air for flushing the earlier traces of test gas.
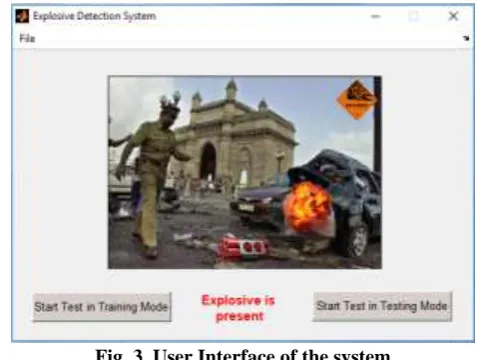
Fig. 3. User Interface of the system
A User Interface (UI) is developed in Matlab for ease of handling the system, where two modes of operation are given as options to the user as illustrated in figure 3. When the user clicks on the “Start test in Training mode”, the system is
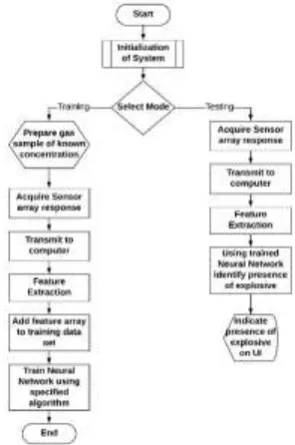
subjected to a known concentration of the known explosive and the features extracted are added to the training data set. In the “Start test in Testing mode”, the system derives the features from the sensors' response and determines the presence of explosive. The results of classification of the two individual compounds are combined together to display the message of “Explosive is present” even if any one of the explosives is present in the test mixture of gas, as illustrated in figure 3. The Lower Explosive Limit (LEL) and Higher Explosive Limit (HEL) values of both the explosives are referred when deciding the presence of explosive. Figure 4 illustrates the general flowchart of the system.
III.EXPERIMENTATION
The sensor array is subjected to 102 varying concentrations of Nitrobenzene and Nitrotoluene from 200 ppb to 200 ppm. The data points are separated to form training files and testing files for the neural network classifier. The data points are separated to form training files and testing files for the neural network classifier. The amount of volatile compound is introduced in liquid phase in an air tight container. The compound is allowed to mix with the air in the container and the sensor array response is acquired. To generate the desired concentration, the following steps are followed:
Note the temperature in degree Kelvin
Calculate the density ∂ in g/litre using the following formula and values
(4)
where P is the standard atmospheric pressure, 1 atm; MW is the molecular weight of compound (NB=123.06 g/mol; NT=137.14 g/mol);
R is the Universal gas constant in L.atm/mol.K = 0.0821 T is the temperature in degree Kelvin
Using the formula, calculate the volume to be injected in liquid phase
(5)
where Vgas is the required volume of compound in gaseous
Fig. 4. General Flow chart of system
For every concentration, the response of the sensors is acquired with a sampling time of 110 ms and transmitted to the computer, where the features of Area, Slope and Relative Response are extracted for each concentration. These features are the smell prints of the sensor array and directly reflect the concentration of the compound. The readings are taken in triplicate and at different time zones to ensure correctness of the readings. After every response, the sensor array is purged with air to remove traces of the earlier gas concentration from the sensors. This ensures the capturing of factual response of the sensors. As every concentration requires the exact amount of volatile compound in liquid form to be introduced in the air tight gas chamber and allowing the compound to stand for 25 minutes to vaporize, acquiring the sensor array response for each concentration is time consuming. This is followed by the exposition of the sensor array to the gas for 20 seconds. However, once the features of all the concentrations are extracted, the training and testing of neural networks is speedy.
IV. DATA PROCESSING AND CLASSIFICATION USING NEURAL NETWORK
The extracted features from the experimentation containing 600 feature data points are split in two equal parts. One part is used for training the neural network, while the other is used for testing the performance. The spectrum of data points used for training and testing cover the entire range. Six types of supervised learning algorithms are used, each with ten different training algorithms for the neural networks.[23-25] The selection of the supervised learning algorithms is based on an extensive literature survey done for completion of this work. The most suitable algorithms for gas detection are identified and used in the developed system. They are:
Support Vector Machine (SVM)
Feedforward Neural Network
Pattern Recognition Neural Network
Fitting Neural Network
Cascade-forward backpropagation Neural Network
Elman Backpropagation Neural Network
Apart from the SVM, different training algorithms for the neural networks were used to select the appropriate combination. The list of training algorithms used is:
BFGS quasi-Newton backpropagation
Conjugate gradient backpropagation with Powell-Beale restarts
Conjugate gradient backpropagation with Fletcher-Reeves updates
Gradient descent with adaptive learning rate backpropagation
Gradient descent with momentum backpropagation
Gradient descent with momentum and adaptive learning rate backpropagation
Levenberg-Marquardt backpropagation
One-step secant backpropagation
Resilient backpropagation
Scaled conjugate gradient backpropagation
The performance of each supervised learning algorithm for every training algorithm is measured in terms of Accuracy, Specificity, Sensitivity, Precision and time required for training and classification. The Accuracy is a ratio of correct predictions to the total predictions and is represented in equation 6. The proportion of positive identifications that are actually correct are represented by Precision and expressed in equation 7. Sensitivity represents the actual positives identified correctly and expressed as equation 8. Specificity is defined as the proportion of actual negatives, that are predicted as the negative and expressed in equation 9. The confusion matrix is a table used to describe the performance of a classifier on a set of test data for which the true values are known and is illustrated in Table I.
A True Positive (TP) is an outcome where the model correctly predicts the positive class while a True Negative (TN) is an outcome where the model correctly predicts the negative class. A False Positive (FP) is an outcome where the model incorrectly predicts the positive class a False Negative (FN) is an outcome where the model incorrectly predicts the negative class.
(6)
(7)
(8)
TABLE I: CONFUSION MATRIX
Explosive Predicted Present
Predicted Absent Actually
Present True Positive (TP)
False Negative (FN)
Actually
Absent False Positive (FP)
True Negative (TN)
The feedforward neural network with resilient back propagation is used in the system to identify the presence of explosives. For this, first the number of input nodes are identified depending on the number of features, which are three in this case. The number of hidden layers and output layers in the system is one.
V. RESULTS AND DISCUSSION
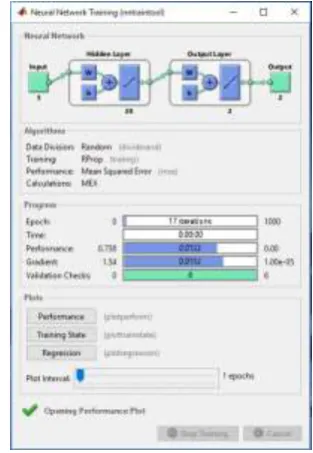
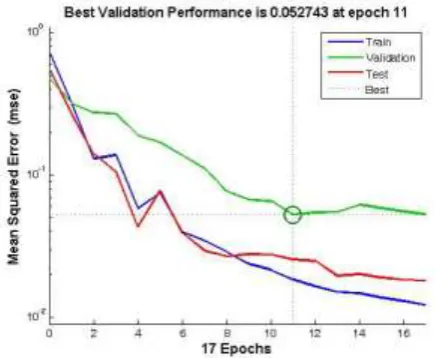
Comparing the performance of all the supervised learning algorithms, the Feedforward neural network with resilient back propagation is the fastest and the Elman Backpropagation (BP) Neural Network with resilient back propagation (RBP) is the most accurate with justifiable time. Priority is given to the fastest training network, the Feedforward neural network with resilient back propagation and is further used in the system for explosive detection. Performance parameters for the best performing network combination are presented in Table II for NB. The feedforward network has one input layer, one hidden layer and one output layer. The neural network is trained in 17 epochs and the structure is illustrated in Figure 5. The performance graph of the selected network are shown in Figure 6.
[image:5.595.54.284.68.133.2]Results of the system are noted at various stages. Initially, the performance of the sensors is verified with a 6 and half digit Keithly multimeter. The extracted features from the sensor array response are separated to form a training and testing data set. Various training algorithms are tried for different neural networks for qualitative detection of explosives. The fastest algorithm is finalized and implemented in the system.
Table II: TOP PERFORMING ALGORITHMS
Fig. 5. Feedforward Neural Network with Resilient Back Propagation
The user interface developed makes the operation of the system easy and allows the selection of mode, whether training or testing. Once the system starts, the sensor array is exposed to unknown gas sample for 20 seconds, during which the sensor response is digitized and transmitted to the computer. The extraction of features is done using software, which are further used to identify the presence of explosive. The total time taken from introduction of unknown gas sample to detection of explosive is 48 seconds.
[image:5.595.58.287.555.683.2]Fig. 6. Performance of the Feedforward Neural Network
VI. CONCLUSION
Qualitative detection of explosives is implemented with a machine learning approach with an in-house developed system and market available sensors. The main contribution of this work is the simple, easy available and accurate, explosive detection system which can be made available to common man in densely populated areas. The designed system derives features from the sensor array response when exposed to varying concentrations of nitrobenzene and nitrotoluene from 0.2 ppm to 200 ppm. Part of the acquired response is usedS to train the Feedforward Neural Network with the Resilient Back Propagation. The classifier is tested for the remaining acquired responses. When the concentration of the nitroaromatic compound is greater than the LEL of the explosive, the system indicates the presence of explosive in the developed UI. Thus, preventive measures can be taken to avoid possible mishaps due to explosion. The system can be used for practical detection of explosives with the classifier exhibiting an Accuracy of 94%, Specificity of 96%, Sensitivity of 91% and Precision of 95% for identifying the presence of nitrobenzene or nitrotoluene in 48 seconds.
REFERENCES
1. Institute for Economics & Peace, 2018, November. “Global Terrorism Index 2018: Measuring the impact of terrorism”,
Retrieved from
http://visionofhumanity.org/app/uploads/2018/12/Global-Terror ism-Index-2018-1.pdf
2. Qingsong, Wang, Guo Song, and Sun Jinghua, “Nitrobenzene and aniline caused fire and explosion: A case study”, In IChemE Symposium Series, vol. 153. 2007
3. Koldunov, S. A., A. V. Anan’in, V. A. Garanin, and S. I. Torunov, “Detonation properties of diluted liquid explosives: A mixture of nitromethane with nitrobenzene”, Combustion, Explosion, and Shock Waves 48, no. 1, pp. 106-111, 2011
4. Bretherick, Leslie, “Bretherick's handbook of reactive chemical hazards”, Elsevier, 2016.
5. Mason, C. M., Van Dolah, R. W., & Ribovich, J. “Detonability of the System Nitrobenzene, Nitric Acid, and Water”, Journal of Chemical and Engineering Data, vol. 10, no. 2, 173-175, 1965 6. Meyer, R., Köhler, J., & Homburg, A. “Explosives”, John Wiley &
Sons, 2016
7. Vobecka Z., R. Blue, F. Vilela, P. J. Skabara, and D. Uttamchandani “Microelectrode sensor utilising nitro-sensitive
polymers for application in explosives detection”, Micro & Nano Letters vol. 7, no. 9, pp. 962-964, 2012
8. Liu Yun, Lifei Wu, Liquan Sun, and Aiqin Luo, “Computational and experimental investigation of 4-nitrotoluene molecularly imprinted polymers”, In Remote Sensing, Environment and Transportation Engineering (RSETE), 2011 International Conference on, pp. 8140-8143. IEEE, 2011
9. Harbeck Mika, Dilek D. Erbahar, Ilke Gürol and Emel Musluoğlu, “Chemical sensing of explosives in water”, In Instrumentation and Measurement Technology Conference (I2MTC), 2010 IEEE, pp. 111-115, IEEE, 2010
10.Sagar Mathure, Rohini Mudhalwadkar and Gaurav Sonar, “Metal oxide semiconductor based thin film sensor for nitro aromatic explosive detection”, In Convergence of Technology (I2CT), 2014 International Conference for, pp. 1-4. IEEE, 2014 11.Delpha Claude, Maryam Siadat and Martine Lumbreras,
“Identification of Forane R134a in an air-conditioned atmosphere with a TGS sensor array”, IEEE Transactions on Instrumentation and Measurement vol. 50, no. 5, pp. 1370-1374, 2001
12.Osowski Stanislaw, Tran Haoi Linh and Kazimierz Brudzewski, “ Neuro-fuzzy TSK network for calibration of semiconductor sensor array for gas measurements”, IEEE Transactions on Instrumentation and Measurement vol. 53, no. 3, pp. 630-637, 2004
13.Venkatesan, C., P. Karthigaikumar, Anand Paul, S. Satheeskumaran, and R. Kumar. "ECG signal preprocessing and SVM classifier-based abnormality detection in remote healthcare applications." IEEE Access 6 (2018): 9767-9773.
14.King Tony L., Frank M. Horine, Kevin C. Daly and Brian H. Smith. “Explosives detection with hard-wired moths”, IEEE Transactions on Instrumentation and Measurement vol. 53, no. 4, pp. 1113-1118, 2004
15.Luo Bing, Qing-Hao Meng, Jia-Ying Wang and Ming Zeng, “A Flying Odor Compass to Autonomously Locate the Gas Source”, IEEE Transactions on Instrumentation and Measurement vol. 67, no. 1, pp. 137-149, 2018
16.Bermak Amine and Sofiane Brahim Belhouari, “Bayesian learning using Gaussian process for gas identification”, IEEE transactions on Instrumentation and Measurement vol. 55, no. 3, pp. 787-792, 2006
17.Zhang Lei and Fengchun Tian, “Performance study of multilayer perceptrons in a low-cost electronic nose”, IEEE Transactions on Instrumentation and Measurement vol. 63, no. 7, pp. 1670-1679, 2014
18.Khalaf Walaa, Calogero Pace, and Manlio Gaudioso, “Gas detection via machine learning”, Int. J. Comput. Electr. Autom. Control Inf. Eng 2, no. 1, pp. 61-65, 2008
19.Srivastava A.K., “Detection of volatile organic compounds (VOCs) using SnO2 gas-sensor array and artificial neural network”, Sensors and Actuators B: Chemical, vol. 96. no. 1. pp. 24-37, 2003
20.Olguín C., Laguarda-Miró, N., Pascual, L., García-Breijo, E., Martinez-Manez, R. and Soto, J., “An electronic nose for the detection of Sarin, Soman and Tabun mimics and interfering agents”, Sensors and Actuators B: Chemical, vol. 202, pp. 31-37, 2014
21.Chen Nianyi, “Support vector machine in chemistry”, World Scientific, 2004
22.Dipali Ramdasi, Rohini Mudhalwadkar, “Parameter-Controlled Gas Sensor System for Sensor Modeling”, In Progress in Advanced Computing and Intelligent Engineering, pp. 459-468, Springer, Singapore, 2018
23.Venkatesan, C., P. Karthigaikumar, and S. Satheeskumaran. "Mobile cloud computing for ECG telemonitoring and real-time coronary heart disease risk detection." Biomedical Signal Processing and Control 44 (2018): 138-145.Gurney Kevin, “ An introduction to neural networks”, CRC press, 2014