International Journal of Innovative Technology and Exploring Engineering (IJITEE) ISSN: 2278-3075, Volume-8 Issue-10, August 2019
Abstract: Distribution utilities are facing multitude of
challenges like cost optimization, profit maximization, increasing customer satisfaction, government subsidies and changing technology. These myriad of goals are making the utilities to treat the operating and maintaining substations and their assets as a business process and it goal is to maximize the Return On Investment (ROI) on each asset. This is achieved by maintaining each asset at its optimal condition with minimum maintenance cost so as to yield more revenue per asset. Maintenance is a core process and a tweaking parameter in the asset management. Well optimized maintenance management along with the structured life cycle asset management will guarantee the overall performance. Maintenance optimization is carried out using the equipment models considering the effect of maintenance and deterioration due to aging. Objective function for Optimization is minimizing the maintenance cost and cost due to interruptions.
Index Terms: About four key words or phrases in alphabetical
order, separated by commas.
I. INTRODUCTION
Distribution utilities are facing multitude of challenges like cost optimization, profit maximization, increasing customer satisfaction, government subsidies and changing technology. These myriad of goals are making the utilities to treat the operating and maintaining substations and their assets as a business process and it goal is to maximize the Return On Investment (ROI) on each asset. This is achieved by maintaining each asset at its optimal condition with minimum maintenance cost so as to yield more revenue per asset. Maintenance is a core process and a tweaking parameter in the asset management. Well optimized maintenance management along with the structured life cycle asset management will guarantee the overall performance. Maintenance optimization
is carried out using the equipment models considering the effect of maintenance and deterioration due to aging for minimizing the maintenance cost along with cost due to interruptions.
II. EQUIPMENTAGEING
Ageing is a General process in which characteristics of a System, Structure or Component (SSC) gradually change
Revised Manuscript Received on August 05, 2019
N.V.P.R. Durga Prasad,BHEL, Corporate Research & Development, Hyderabad, India.
Dr. C. Radhakrishna, His Department Jawaharlal Nehru Technolgical Unviersity Hyderabad, India,
.
with time or use. The term ageing does not refer to how old equipment is, but it is related to its condition and how it is changing over time (Wintle et al. 2006). During the service life the physical and electrical capabilities of equipment will deteriorate gradually until it reaches a point of failure or breakdown [1]. Power system aging process is categorized into four groups based on its physical attributes [1]:
• Chronological Age (CA): Aging since
acquisition/design due to the natural properties of the material with age.
• Cumulative Service Stress (CSS): This is the experienced while performing it functioning.
• Abnormal Event Stress (AES): This is due to the experiencing of events which are not in the regular operation like faults, thunderstorms, etc.
• Technical Obsolescence (TO): This is the advances in the technology and could not be upgraded to meet the system requirements.
Even though the aging is classified as four types, net aging is due to the overall effect of all the above.
III. MODELLING AGING PROCESS USING BATHTUB CURVE
If you are using Word, use either the Microsoft Equation Editor or If no preventive or corrective maintenance is carried out on the equipment life period, then the equipment will function till its failure. This failure rate over a period of time will follow the bath-tub curve type of relationship as shown in Fig. 1. [1]. This can be used for all types of devices for representing the aging equipment hazard rate or failure rate modelling.
Fig. 1. Traditional Bathtub Failure Rate Curve
IV. EQUIPMENTMODELLINGCONSIDERING
AGEING,RELIABILITYANDECONOMICCOST
Semi-Markov processes have been applied for modelling the power system equipment for solving the optimization problems related to reliability and availability. In this equipment is expected to be
repairable and time to bring
back the equipment to
Substation Maintenance Optimization By
Considering Ageing Equipment
operating will depend on the nature of the fault. Fundamental two state models for reliability studies are not enough to represent the real state of the equipment. In a two state model is suitable for capturing the equipment states with random failures but not failures due to equipment deterioration. Random failures can occur at any time and whose reasons are not well understood. The frequency of such failures mostly depends on the external factors like lightning, earthquakes, etc. Whereas equipment condition goes to deterioration state due to its aging and operating conditions and leads to failure state. In view of this the trend and distribution of failures due to deterioration are predictable. Deterioration process leads to failure only if no maintenance is applied. If appropriate maintenance is carried out, the equipment condition state will be brought back to previous state or a new improved deterioration state. Hence, maintenance plays critical role in the studies of failures due to aging of equipment. Power system utility operators would like to maintain the equipment in order to slow down the deterioration rate and avoid the failures. Hence, after every deterioration state maintenance state is introduced which bring back the equipment state to its previous state [2]. Accordingly, maintenance state is added to the above model and revised model is given in Fig 2 [3].”
Fig.2. Multi- State Model with maintenance, deterioration and failure
Maintenance operations are divided into minor maintenance and major maintenance (Endrenyi et al., 2001) [4]. Maintenance carried out with limited resources is called Minor maintenance and its impact on equipment condition is minimal. Maintenance carried out for long duration and huge resources is called major maintenance and it affects the equipment condition substantially. Hence, as a first addition to this model requires decision for which type of maintenance to be carried out like minor or major or nothing. This will have impact on the maintenance cost of the equipment. Secondly, adding the inspection stage before the maintenance. This is very essential since in present day distribution automation, on-line condition monitoring of the equipment is available and enable the selection of appropriate type of maintenance. Thirdly probability for human related errors which are normally neglected is to be considered. But in real situation if inspection tasks are not properly carried out wrong type of maintenance is selected resulting to further equipment deterioration instead of improvement and increases the maintenance cost. Finally, decision state to make a precise judgement for the replacement is added. Normally utility operators are required
to make a decision either to maintain or replace depending on the equipment deterioration state and cost of maintenance. This will ensure the right time of investment for replacement. Normally equipment life cycle cost is considered for the decision on replacement [5]. Advanced model incorporating all the above is given in Fig. 3.
Fig.3. Multi- State Model for Random Failures and Deterioration due to Ageing
D1, D2 and Dk are the equipment deterioration states and I1 , I2 and Ik are the inspection states with inspection rates as I1 to Ik. After deterioration state at K , if no maintenance is carried out the equipment deterioration state reaches to failure state F1. Equipment can also reach failure state F0 due to random failures. The equipment cost of repair and duration of maintenance are different from F1 state. Based on the inspection decision is take whether to go for Minor (M1 , M2 to Mk) or Major Maintenance ( MM1 , MM2 to MMk) with a specific maintenance rates. After maintenance equipment deterioration state either improves to previous condition or further deterioration to next state. M1 , MM1 are the rate at which the state transition after minor and major maintenance. MM1 is expressed as n M1, F1H, F2H and FkH are the human error states whose decision lead the equipment either to failure state F0 or remain in the present state. The probabilities for minor maintenance to failure and major maintenance to failure are considered for necessary evaluation. Replacement decision R is added for each state having a replacement rate as λR for all states whose value is normally decided based on the historical equipment maintenance data and operators experience.
V. SUBSTATIONLEVELMODELLINGFOR
RELIABILITYWITHAGINGEQUIPMENT
International Journal of Innovative Technology and Exploring Engineering (IJITEE) ISSN: 2278-3075, Volume-8 Issue-10, August 2019
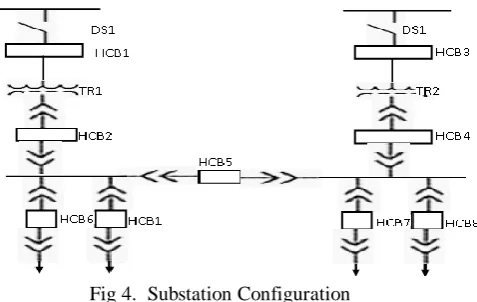
Fig 4. Substation Configuration
There are two sub-transmission lines feeding two transformers and servers power to two outgoing feeders. Two transformers are protected by two high voltage circuit breakers and lower section is protected by other four circuit breakers for outgoing feeders. Keeping the sensitivity of the equipment in the overall substation transformers and circuit breakers are mainly considered for the maintenance optimization studies in this paper.
In the literature many methodologies are presented for the reliability or availability evaluation of sub-stations. Fundamentally power system reliability assessment methods can be classified into two types and they are deterministic and probabilistic [6]. In deterministic methodology normally uses the reserve margins and large sets of data and do not use the stochastic behavior of the system. Since, deterministic methods do not take care of the dynamic behavior, like equipment deterioration due to aging, faults, etc., it cannot be used for the present maintenance studies. In probabilistic methodology dynamic behavior of the system such as equipment failures, system faults, etc. are considered for the estimation of reliability indices. Probabilistic methods are further subdivided into two types and they are analytical methods and simulation methods [7]. In the analytical methods, mathematical models for the system will be generated and numerical techniques are used for evaluating the reliability indices. Minimal cut set method, fault tree analysis, event tree analysis and Reliability Block Diagram (RBD) and Markov Modelling (MM) are the most commonly used analytical methods. Among the above the Minimum cut-set method is widely used because of its advantages like ease of implementation, capability to handle complex networks, etc. In simulation methods, Monte Carlo simulation is used extensively for the reliability studies. However, with the increased number of states in the equipment modelling for accurate maintenance decisions, the simulation time is increasing enormously [8]. Hence, in this paper analytical approach using minimal cut set method is opted in view of its inherent advantages for evaluating the substation reliability indices.
Markov model is employed to study the equipment deterioration due to aging and maintenance (major & minor) and minimum cut-set method is used to extend the above studies to substation levels as shown in Fig 5. Hence, Markov models for equipment and minimum cut-set based reliability estimations have been combined for the substation level reliability or availability studies [9]. Substation
[image:3.595.56.295.47.198.2]availability is a very crucial index which is used for the substation maintenance optimization. In a given substation load points are identified and the substation reliability is estimated based on the availability of connected load points. Similarly using the individual equipment cost load point maintenance cost is estimated and then to the substation maintenance cost. Similar approach as shown in Fig .5 is followed for the estimation of all other reliability indices.
Fig 5. Approach for Substation Modelling for Reliability
using equipment and load points
VI. COMPUTATION OF SUBSTATION AVAILABILITY
As per the above methodology, initially equipment availability is calculated using the multi-state Markov modelling as explained above. Equipment model considering equipment deterioration due to aging, major maintenance, minor maintenance and inspection as shown in Fig (3) is considered for the substation reliability calculations. The equipment model is a 14 state semi-Markov model whose availability is calculated as explained in sections as a function of maintenance and inspection rates is shown below:
Aequp = f ( M, MM, I)
[image:3.595.312.542.608.713.2]Next step is to estimate the load point reliability indices and its maintenance parameters. As explained above minimum cut-set based reliability estimation procedure is adopted for the load points. A cut set path for the network is such that the unique set of equipment in that path will determine the availability of the connected load point. If a cut set is minimal cut set, if with a single event (any equipment fails) in this path the load point interruption will occur.
Fig.6. Cut Sets for Fig. (4) at Consumer Load point 1 (First order and second order)
ULA = U (5) + U (A) + U (B) + U (C) + U (D)
─ U (5∩A) ─ U (5∩B) ─ U (5∩C) ─ U (5∩D)
─ U (A∩B) ─ U (A∩C) ─ U (A∩D)
─ U (B∩C) ─ U (B∩D) ─ U (C∩D)
In the similar way unavailability factors for all other load points can be calculated.
Above equation is valid with the following assumption: - 100 % availability at the sub-transmission levels. -Probability of simultaneous failure of more than one equipment is neglected.
Substation reliability is estimated by adding the above availabilities for all the load points.
Asub =
Where Ai = Availability at Load point i
In the estimation of substation level reliability using the above conventional manner have many short comings [8]. Since while estimating the whole substation availability, considering the importance of the load point with respect to system level is very important. In order to incorporate this, individual load point importance’s are to be calculated. Normally load point importance will depend on its location in the substation topology, its nature of the connected loads and customer interruption costs. In the literature two types of importance measures are employed and they are structural importance [1, 2] and reliability importance. Structural importance is based on only the position of the load point while reliability importance is based on its position and its reliability. In the present paper reliability based importance is used along with customer interruption cost [9].
No. of equipment in a substation = N No. of Load points in a substation = N Load importance at J = LIJ
Economic Importance of a load point = EIJ This is decided based on the customer interruption cost.
User Importance of a load point = UIJ This is decided based on the nature of loads connected. Final Load importance at J = LIJ = EIJ ·UIJ / (EIi ·UIi) Accordingly the final substation availability is revised as given below:
Asub = Ai · LIi
= f ( M1 , I1 , M2 , I2 ,,,,,,, Mn , In ) · LIJ = f ( M1, I1 , M2 , I2 ,,,, Mn , In,EI1,UI1 ,EI2,UI2 ,,,,,EIN,UIN)
Optimization Function = F = Min (CENS + Cmiant + Cinsp )
Where Cmiant =Total cost of Equipment Maintenance
Cinsp =Total cost of Equipment Inspection CENS =Total cost of Energy Not Supplied In this approach both the above parameters are formulated as a function of individual equipment maintenance rates and optimization is carried for minimization.
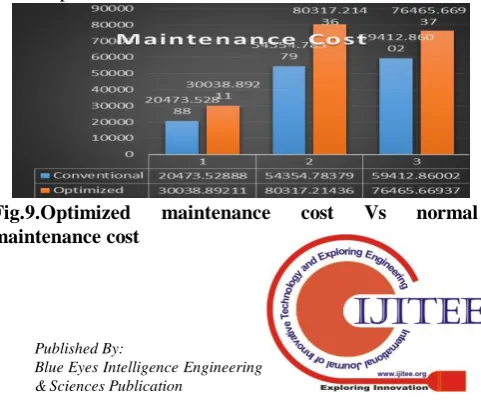
CENS = Llp(i) ∙ Tlp(i) ) Cout Where
CENS = Total cost of Energy Not Supplied Cout = Cost of outage
Llp(i) = Load at Load point i
Tlp(i) = Outage duration at load at Load point i Cmiant = i ∙ ri ) Ci
Cinspe = ( Ii ∙ rIi) Cii Where
Cmiant = Total Substation Maintenance cost Ci = Unit rate of Maintenance cost of equipment i = Maintenance rate of equipment
ri = Repair time of equipment Ii = Frequency of Inspection for equipment
i (times/hr)
rIi = Inspection Repair time for equipment i (hr/each time)
Ci = Cost of Inspection for equipment i ( Rs/hr)
This method is based on the direct estimation of cost based on the substation availability and the maintenance cost. The objective function is formulated using the direct maintenance cost as an independent variable along the cost of energy not supplied. This objective function is more appropriate for the asset optimization at substation level.
In the above reported formulation [7], load point probability indices are estimated using the minimal cut set method but the load point criticality is not being considered. In addition to it, in the multi-state Markov model for equipment maintenance did not considered various states like the equipment inspection, different types of maintenance, failures, predictive replacement and human errors. These are very essential for the accurate estimation of optimized maintenance rates at minimum cost towards the asset optimization [8].
In the present paper, effective substation level maintenance optimization is proposed incorporating the load point availability based on its importance as well as detailed maintenance model of equipment considering the inspection, maintenance (major & minor) and aging process.
VII. SUBSTATIONLEVELMAINTENANCE
OPTIMIZATION
With the above method, substation availability with chosen maintenance rates for equipment can be calculated considering the effect of maintenance and aging on the equipment condition. But, ultimate requirement of the utilities is to minimize the operational or maintenance cost and maximize the overall substation availability. For this, it is required to optimize the equipment maintenance rates for
maximum substation availability with minimum
maintenance cost. In the literature many methods are reported for the above optimization. The methods are characterized mainly the way optimization problem is formulated and the calculation of the variables considered for the optimization process. The main variables in the optimization are substation availability and substation
maintenance cost. Equipment Maintenance Rate
Optimization using substation economic benefit:Normally
substation availability is
International Journal of Innovative Technology and Exploring Engineering (IJITEE) ISSN: 2278-3075, Volume-8 Issue-10, August 2019
method by considering the load point availability without considering the effect of maintenance and aging [9].But the load point availability calculation by considering the load point criticality and load point importance is more accurate than the just summation of the all load points. Estimation of overall substation reliability using all the above considerations is explained in sec. 2.6.
Maintenance cost is estimated based on the substation economic benefit and the individual equipment economic benefit through economic cost modeling [8]. In this approach maintenance cost optimization is indirectly related to the economic benefit optimization. In order to find the effect of individual equipment on the overall substation availability, the sensitivity analysis is employed as given below.
Sensitivity = Si = Asub / Ai
Where Asub is the small change in the substation availability and Ai is the small change in the equipment availability.
Where Rsub is the substation revenue. This method is more focused towards the consumer’s perspective by considering the revenue for successful serving the consumers for calculating the Rsub .
Overall Substation Economic Benefit = ∑ Rsub Si-normalized
=f (Equipment Maintenance rate) Using the above approach various optimizations scenarios like maximizing the substation availability with no constraints, optimization with target substation availability and substation availability with target maintenance cost using economic benefit is reported [8]. In this paper, optimization of overall substation maintenance cost based on the economic benefit approach is chosen as it is more towards the maintenance performance. And maintenance cost is directly involved in the optimization process. In the literature, economic benefit is calculated from the equipment perspective [8]. But while optimizing the substation maintenance cost it is important to optimize the substation availability from the utility and consumer perspective. This approach will yield a result which is optimized for maintenance as well as the overall substation performance. In this paper, optimization function is formulated with cost of energy not supplied as a member in the optimization function representing the substation performance along with maintenance cost.
VIII. OPTIMIZATIONUSINGCOSTOFENERGY
NOTSUPPLIEDANDMAINTENANCECOST
The Optimization function based on the minimization of cost of energy not supplied due to load point outages and the total substation maintenance cost of equipment [10] is given below:
Optimization Function = F = Min (CENS + Cmiant + Cinsp )
Where Cmiant =Total cost of Equipment Maintenance Cinsp =Total cost of Equipment Inspection CENS =Total cost of Energy Not Supplied In this approach both the above parameters are formulated as a function of individual equipment maintenance rates and optimization is carried for minimization.
CENS = Llp(i) ∙ Tlp(i) ) Cout Where
CENS = Total cost of Energy Not Supplied Cout = Cost of outage
Llp(i) = Load at Load point i
Tlp(i) = Outage duration at load at Load point i Cmiant = i ∙ ri ) Ci
Cinspe = ( Ii ∙ rIi ) Cii Where
Cmiant = Total Substation Maintenance cost Ci = Unit rate of Maintenance cost of equipment i = Maintenance rate of equipment
ri = Repair time of equipment
Ii = Frequency of Inspection for equipment i (times/hr)
rIi = Inspection Repair time for equipment i (hr/each time)
Ci = Cost of Inspection for equipment i ( Rs/hr)
This method is based on the direct estimation of cost based on the substation availability and the maintenance cost. The objective function is formulated using the direct maintenance cost as an independent variable along the cost of energy not supplied. This objective function is more appropriate for the asset optimization at substation level.
In the above reported formulation [10], load point probability indices are estimated using the minimal cut set method but the load point criticality is not being considered. In addition to it, in the multi-state Markov model for equipment maintenance did not considered various states like the equipment inspection, different types of maintenance, failures, predictive replacement and human errors. These are very essential for the accurate estimation of optimized maintenance rates at minimum cost towards the asset optimization [8].
In the present paper, effective substation level maintenance optimization is proposed incorporating the load point availability based on its importance as well as detailed maintenance model of equipment considering the inspection, maintenance (major & minor) and aging process.
IX. SUBSTATIONLEVELMAINTENANCECOST
OPTIMIZATION
The optimization formulation as explained in sec.2.7.2 has been extended with more accurate equipment model and load point availability calculations. Multi- State Model for Random Failures and deterioration due to Aging as shown in Fig () is considered for the individual equipment maintenance modelling. Load point reliability indices are estimated considering the load point criticality and economic importance. The optimization function is for minimizing the sum of cost of energy not supplied and substation maintenance cost is given below:
Method :1
Optimization Function=F = Min (CENS + Cmiant + Cinsp )
Where
[image:5.595.328.540.49.270.2]Where Usub = Total Substation Outage duration estimated using the equation given below:
Cout = Cost of outage
CENS = f ( M1, I1 , M2 , I2 ,,,, Mn , In,EI1,UI1 ,EI2,UI2 ,,,,,EIN,UIN)∙Cout
Cmiant = ( Mi ∙ rMi ) Ci Cinspe = ( Ii ∙ rIi ) Cii Where
Mi = Frequency of Maintenance for equipment i rMi = Repair time for equipment i
N = Total number of Equipment
Ci = Cost of maintenance for equipment i
Ii = Frequency of Inspection for equipment i ( times/hr ) rIi = Inspection Repair time for equipment i (hr/each time) Ci = Cost of Inspection for equipment i ( Rs/hr)
Cmiant = f ( M1, I1 , M2 , I2 ,,, Mn , In,EI1,UI1 ,EI2,UI2 ,,,,,EIN,UIN)∙ Ci
Method :2
Optimization Function=F = Min (CENS + Cmiant + Cinsp ) CENS = Llp(i) ∙ Tlp(i) ) Cout
Where Llp(i) = Load at Load point i
Tlp(i) = Outage duration at load at Load point i Tlp (i) is calculated considering the load point criticality and importance as explained in sec. 2.6. CENS = f ( M1, I1 , M2 , I2 ,,,, Mn , In,EI1,UI1 ,EI2,UI2 ,,,,,EIN,UIN)∙Cout
Cmiant = ( Mi ∙ rMi ) Ci Cinspe = ( Ii ∙ rIi ) Cii
Where
Mi = Frequency of Maintenance for equipment i rMi = Repair time for equipment i
N = Total number of Equipment
Ci = Cost of maintenance for equipment i
Ii = Frequency of Inspection for equipment i ( times/hr ) rIi = Inspection Repair time for equipment i (hr/each time) Ci = Cost of Inspection for equipment i ( Rs/hr)
Cmiant = f ( M1, I1 , M2 , I2 ,,, Mn , In,EI1,UI1 ,EI2,UI2
,,,,,EIN,UIN)∙ Ci
The detailed flow chart for the above process for optimization is given in Fig. 7..
X. OPTIMIZATIONALGORITHM
Solving the above optimization process requires a global optimization technique since the number of variable are large and their behavior is un-known. For such problems many optimization algorithms like Genetic based on Evolutionary techniques, annealing stochastic based and Particle Swarm Optimization based on Swarm are available. Among the above Particle Swarm Optimization (PSO) which is a global optimization algorithm results good results and it has been applied to similar problems
International Journal of Innovative Technology and Exploring Engineering (IJITEE) ISSN: 2278-3075, Volume-8 Issue-10, August 2019
Fig 7. Flow chart for Optimization (Contd.)
XI. CASESTUDYFORSUBSTATIONLEVEL
MAINTENANCECOSTOPTIMIZATION
In the above sections, detailed methodology for calculating the optimal maintenance rates for minimum overall substation maintenance cost and minimum interruption cost based on the load point availability has been explained. The proposed procedure includes the accurate equipment modelling for maintenance considering the effect of its ageing and maintenance.
[image:7.595.60.281.48.602.2]Estimation of optimal maintenance rates is applied to a typical substation configuration [8] as shown in Fig.8 and results are analyzed in the following sections.
Fig 8: Substation Topology for Case Study
List of equipment considered for study are: Transformers : TF1 and TF2
Circuit Breakers : BR1, BR2, BR3, BR4, BR5, BR6 and BR7
Following assumption are made for the calculations: • Sub-Transmission lines are always available. • First and second order cut sets are considered. • Statistical independence for equipment failures. • Equipment of same type follows same consideration for maintenance perspective.
• Switching devices delays are not considered in the equipment modelling.
• Exponential distribution for the transition times among all states.
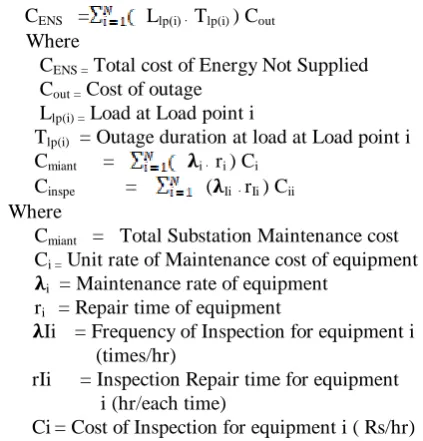
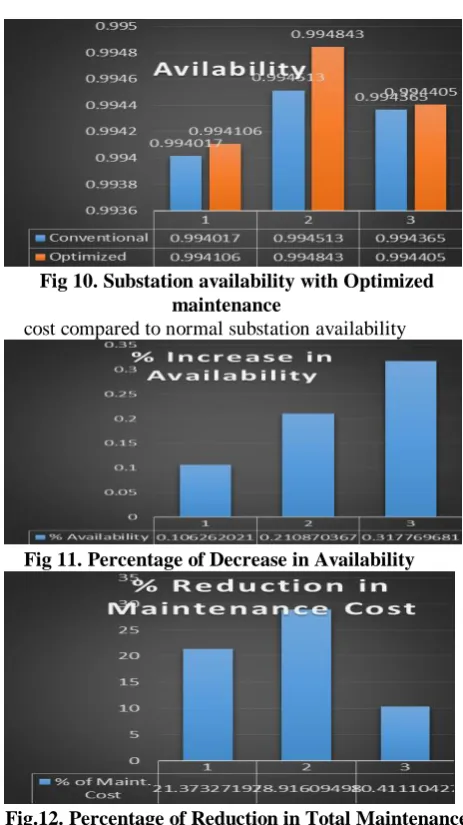
Required reliability related data for the estimation of the equipment availability as a function of frequency of maintenance for all equipment are considered from reference 10, Ch 6, App.1 and reference 503, Ch 6, App.1. Proposed optimization process is carried out and results are analyzed. It is observed from the results that the proposed optimization method yielded lower total maintenance cost when compared to the maximum substation availability optimization method as shown in Fig. 9. There is also marginal improvement in the substation availability as shown in Fig. 10. The reduction in maintenance cost and increase in availability can be correlated with the underlying objective function of the optimization. The results are well studied with the percentage of increase in availability as shown in Fig. 11 and decrease in maintenance cost as shown in Fig. 12. This is further studied with the reduction in the cost of energy not supplied due to interruptions as shown in Fig. 13. It is evident that higher availability means interruption duration is less which results lower cost energy not supplied. Hence, the proposed optimization algorithm achieved expected results for the optimum maintenance cost.
[image:7.595.309.550.634.834.2]Fig 10. Substation availability with Optimized maintenance
cost compared to normal substation availability
Fig 11. Percentage of Decrease in Availability
[image:8.595.55.286.461.588.2]Fig.12. Percentage of Reduction in Total Maintenance Cost
Fig 13. Cost of Energy Not Supplied with Optimized maintenance cost Vs maximum substation availability
based Optimization.
It is also noticed that the contribution of inspection cost in the total maintenance cost is minimal. Hence, the inspection rates can be fixed and need not be considered as a variable in the optimization algorithm to improve the execution rime of optimization process.
XII. CONCLUSION
Maintenance optimization is carried out using the equipment models considering the effect of maintenance and deterioration due to aging. Advanced equipment model incorporating decision for which type of maintenance to be carried out like minor or major or nothing, probability for human related errors which are normally neglected and
decision state to make a precise judgement for the replacement has been used for the estimation of availability. Overall substation availability is estimated based on the load point availabilities considering their importance also. Substation level maintenance optimization is carried out with an objective function of minimizing the maintenance cost and cost due to interruptions. Case study has been implemented and the results are analyzed with optimization having objective function of maximum substation availability.
REFERENCES
1. Jana Galambosova and Vladimir Rataj “Design of condition – Based decision support system for preventive maintenance”, , 2017 Acta Technologica Agriculturae, pp.19-22.
2. Alain lamarche and Pierre Samson, “Development of an Equipment Maintenance management support system 2008 International oil spill conference, pp.454-458.
3. Mohammad zarei,hetic ,“Correct modeling for maintenance scheduling”, 2018 Iranian conference on electrical Engineering, pp.1356-1361. 4. J. Endrenyi, S. Aboresheid, R.N. Allan, G.J. Anders, S. Asgarpoor, R Billinton, N. Chowdhury, E.N. Dialynas, M.Fipper, R.H. Fletcher, and Ch. Singh, C. Grigg, J. Mccalley, S. Meliopoulos, T.C. Mielnik, P. Nitu, N. Rau, N.D. Reppen, L. Salvaderi and A. Schneider, “The present status of maintenance strategies and the impact of maintenance on reliability”, 2001 IEEE Transactions on power systems, pp.638-646. 5. Ling wang, Jian chu, Weijie mao and Yongfeng Fu ,“Advanced maintenance strategy for power plants – introducing intelligent maintenance systems, 2006 the 6th world congress on intelligent control and automation, pp.7444-7448.
6. Y. Suzuki, H. Kojima, N. Hayakawa, F. Endo and H. Okubo, "Optimization of asset management in high voltage substation based on equipment monitoring and power system operation," 2010 IEEE International Symposium on Electrical Insulation, San Diego, CA, 2010, pp. 1-5.
7. R. Billinton and G. Lian “Monte Carlo approach to substation reliability evaluation”, Volume 140, Issue 2, March 1993, p. 147 – 152. 8. Haifeng Ge “Maintenance Optimization for Substations with Aging Equipmen”, Phd Thesis.
9. Haifeng Ge, and Sohrab Asgrapoor, “Reliability and maintainability improvement of substations with aging infrastructure”,2012 IEEE transactions on power delivery, pp.1868-1876.
10.N. Sudket and S. Chaitusaney, "Optimization of substation equipment maintenance by considering equipment deterioration," 2014 International Electrical Engineering Congress (iEECON), Chonburi, 2014, pp. 1-4.
. AUTHORS PROFILE
N.V.P.R. Durga Prasad did his Master’s degree in
Electrical Engineering from IIT Kanpur, India in 1984. Since then he is working in BHEL Corporate R&D, Hyderabad, India. Actively involved in the asset management for electrical power distribution related projects.
Dr. C. Radhakrishna has more than 35 years of experience in teaching & research in Electrical engineering and published more than 85 papers in international, national journals & conferences. He was associated with Jawaharlal Nehru Technological University (JNTU)-Hyderabad and was the founder
Director of Academic Staff College-JNTU-Hyderabad, India.