International Journal of Innovative Technology and Exploring Engineering (IJITEE) ISSN: 2278-3075,Volume-8, Issue-9S4, July 2019
Abstract: In the current paper, analysis has been carried out for a system that has been created on a roof specially designed for semitransparent thermal system. A thermal model has been designed considering quasi-steady state condition to predict the solar cell temperature, tedlar and the temperature at the outlet of duct and room temperature air from room is used as design and electrical parameters. Calculation has been done for electrical and thermal energy outputs at respective places. Finally a comparison has been made between conventional and present system and cost calculation has been calculated. It has been found that for the same system there would be a loss of 6.13 Ton amount of CO2 and a saving of Rs 3,41,390 for 30yrs for the same amount of generation.
Keywords: Roof top Photovoltaic thermal (PVT) System,
Exergy, Carbon credit, Energy.
I. INTRODUCTION
In recent years the application of PVT system has been improved as compared to a normal PV system due to its improvement in efficiency. Agrawal,Tiwari [1] expressed about Energy payback period and its economics of sustainability for Building Integrated Photovoltaic Thermal (BIPVT) system .
Agrawal et.al [2] expressed economic viability about glazed and normal PVT system. Chauhan A, Sanjeev Anand [3] explained variety of application of PVT with the help of soft computing technique. Nayak, Tiwari [4] investigated for a PV/T system integrated with a green house for sunny weather and calculated its energy and exergy performance Gaur et al. [5] made a comparision between semitransparent and opaque system and concluded that the former one gives better result as compared to the later system Chow [6] discussed different research issues associated with PVT system have been discussed in detail. Tiwari, Sodha [7] estimated the overall efficiency of an unglazed PVT/air col- lector in India. In 1998, Loferski [8] et al. calculated the velocity and volume of the air circulated inside the duct and room.
Tiwari [9] et al. discussed numerical investigation and parametric analysis of a photovoltaic thermal. Rajoria et al.
Revised Manuscript Received on July 10, 2019.
Amit Kumar Dash, EN Deptt., Noida Institute of Engineering & Technology Greater Noida, G. B. Nagar, U. P., India.
Sanjay Agrawal, EE Deptt., IGNOU New Delhi, India
Sanjay Gairola, EE Deptt., Pauri Engineering College, Uttarakhand, India. Shweta Shukla, EE Deptt., Meerut Institute of Engineering & Technology Meerut, U. P., India.
[10, 11] discussed the characteristic behavior of different case and a comparison had been made on the basis of different type of energy exerted. Singh S et.al [12] optimized the system for single channel system based on soft computing technique. According to Singh S [13] an increment of 6 to 14 percent exergy has been made for different city after a comparison with the system proposed by Agrawal and Tiwari by soft computing technique. Vats et.al [15] described enormous data about different types of material out of which one can select. Wicker et al. [16] explained different practical application in terms of exergy calculation for different cold climatic condition.
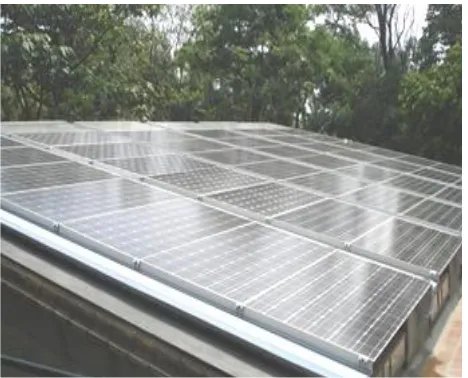
II. DESCRIPTIONOFBIPVTSYSTEM As we know that PV system gives higher efficiency at an inclination of latitude of that particular city, the current system placed at 35 degree w.r.t horizontal for Srinagar. The current system consists of total 48 panels connected in 8rows.
Fig. 1 (Proposed BIPVT systems as rooftop for Srinagar) Each panel can generate a total power of 150 watt and over electrical output of 7.2KW. A DC fan of 120watt is blown to
circulate air in the duct.
Calculation of Energy Flow and Carbon
Credit Earned in Roof Integrated Photovoltaic
Thermal System
Amit Kumar Dash, Sanjay Agrawal, Shweta Shukla, Sanjay Gairola,
Fig. 1 (Proposed BIPVT systems as rooftop for
[image:1.595.310.544.428.617.2]Table I: Technical specification of proposed model
Parameter Description
Vmax 425V
η 17 %
Size of room 5.580m × 4.910 m
Wall height 2765 × 6238 mm
Roof area 11.060 m × 6.144 mm
Roof inclination 350
[image:2.595.43.330.183.520.2]η ref 16%
Table II: Specification of the proposed parameters Design parameters Corresponding values
Length of module 1.650 m
Width of module 0 .800 m
Net output 155 W
Depth of propose Duct 0.255 m
channel single pass channel
Cair (J/kg K) 1005
Cr 0.38 [22]
A 25 degree (ambient)
Hout 5.70 + 3.8 x Va (Watt/m2)
hins 2.8 (Watt/m2)
hTd 2.80 + 3 x v air (Watt/m2)
Kcs 0.040 (Watt/m2 )
KGl 0.80 (Watt/m2)
Kins 0.0350 (Watt/m2 )
KTd 0.380 (Watt/m2 K)
Lcs (mm) 0.3
LGl (mm) 34
Lins (mm) 11
LTd (mm) 3
αc 0.7
αt 0.7
βc 0.9
ηc 0.16
ίg 0.85
ρa (kg/m3) 1.29
III. THERMALMODELINGOFTHEPROPOSED
DESIGN
To calculate the overall electrical efficiency of the cell Zondag (2002) proposed a theory given by,
(1)
Quantities like reference, ambient are generally set by the researcher according to requirement
(2)
The equivalent thermal energy of electrical is given by
(3)
(4)
The thermal energy of the proposed system can be explained from
(5)
Overall thermal efficiency can be derived as,
(6)
(7)
(8)
Fig. 2 (Variation of Ambient Temp and Solar Intensity w.r.t time)
8 10 12 14 16 18
0 1000 2000 3000 4000 5000 6000 7000 8000
Time(Hr)
O
ut
pu
t(w
h)
Fig. 3 (Comparison of Electrical and thermal Energy w.r.t Time)
8 9 10 11 12 13 14 15 16 17
14 14.5 15 15.5 16 16.5 17 17.5
Time(Hr)
E
le
c
tr
ic
a
l
E
ff
ic
ie
n
c
y
(%
)
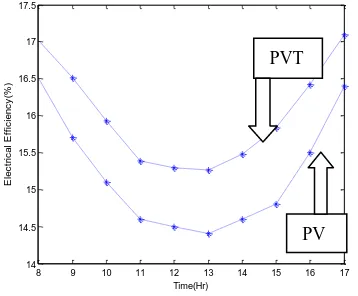
Fig. 4 (Comparison of Electrical efficiency for PV and PVT)
Electrical Output
Thermal Output
PVT
[image:2.595.311.554.322.540.2] [image:2.595.311.490.566.714.2]International Journal of Innovative Technology and Exploring Engineering (IJITEE) ISSN: 2278-3075,Volume-8, Issue-9S4, July 2019
0 5 10 15 20 25 30 35 40
14.5 15 15.5 16 16.5 17 17.5
Time(Hr)
E
le
c
tr
ic
a
l
E
ff
ic
ie
n
c
y
(%
)
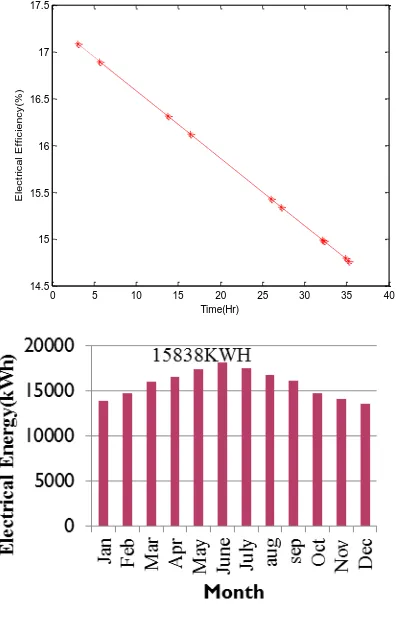
Fig.6 (Monthly variation of electrical output in kWh)
Fig. 7 (Monthly variation of overall Energy in kWh)
Fig. 8 Monthly variation of thermal output in kWh
Fig. 9 (Inclination of Panel for getting maximum efficiency) Energy balance equation of the proposed model is given by:
(9) Simplifying
(10)
For proposed model, Energy balance can be derived as,
(11) Substituting Tc in Eq. (11)
(12)
Energy balance equation of the air flowing inside the duct is given by,
=
+
(13)
(14)
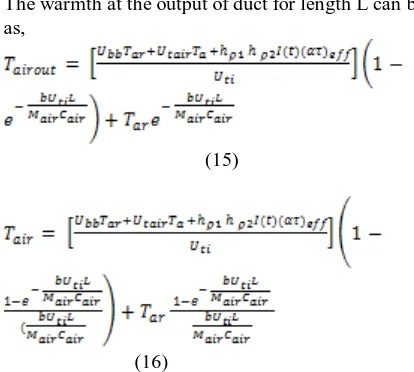
[image:3.595.319.527.53.221.2] [image:3.595.62.261.61.372.2] [image:3.595.59.244.563.676.2]The warmth at the output of duct for length L can be derived as,
(15)
(16)
For ηpv row of the system the overall thermal energy can be derived as,
(17)
Energy balance equation for space heating can be calculated as,
(18)
Temperature of air inside the room can be derived as
(19)
(20)
IV. CARBONCREDITEARNED
Overall energy (electrical and thermal) produced for the whole year = 54716 kWh
If the unit cost of electricity is then, Total cost of energy produced = 54716 × 6 =
Due to 40% of transmission and distribution losses , 20% of equipments loss used and rest in terms of (CO2) , figure comes to be 2.04 kg of CO2/kWh.
So, the carbon dioxide emission reduction = 328296 × 2.04
= 6.69tCO2e (1 ton = 103 kg)
If it will be traded after European standards (21 pound),then = 6.69 × 21 × 81 = Rs. 11,379 per annum (where € 1 = Rs. 81; Nov, 2018)
For the life time (30 year) analysis, = 11,379 × 30 = Rs 3,41,390
The values have been compared with the previous one and percentage change is calculated with the use of “MATLAB-15”.
The proposed BIPVT system can be overviewed from Fig. 1.
V. RESULTS&DISCUSSION
Based on the above discussions and plots following summarization have been made:
a. Fig 2 shows how the ambient temperature and Intensity of
light increases with time. Maximum intensity is attended at 1pm
b. With 48 modules, each has an optimum 150 watt power
the whole system generates electrical energy of 7.100 (kWh) and thermal energy of 6.200 (kWh) which can be shown from Fig. 3.
c. Hybrid PVT System has an edge as compared to normal PV system as the total electrical efficiency is 0.5% more in PVT as compared to PV system as heat is utilized. It can be shown from Fig. 4
d. Fig. 6, 7, and 8 gives the annual electrical, thermal and
over all equivalent thermal energy of the system. It has found that 1888kWh more energy being generated in electrical energy.
e. Fig. 9 describes the angle of inclination of the panel to get
maximum efficiency
VI. CONCLUSION
Depending upon the above investigations, paper can be summarized as follows:
a. Data shows that the solar intensity is maximum in Srinagar at 1pm in the month of January. Comparative graphs drawn tells that, as compared to normal PV system PVT system gives better efficiency in both electrical and thermal energy outputs.
b. A total thermal energy of 54716kWh has been generated annually from this system.
c. As far as effectiveness is concerned this system produces 17% of electrical effectiveness and overall exergy of 18% as compared to 16% and 17% of previous system .
[image:4.595.45.252.55.241.2]International Journal of Innovative Technology and Exploring Engineering (IJITEE) ISSN: 2278-3075,Volume-8, Issue-9S4, July 2019
APPENDIX
=
-=
=
= .
UL= (Ubb+ Utair).
(UA) t . = (UA)t_wall+(UA)t_win+(UA)t_dr.
(UA) t_dr .= .
(UA)t_win=
(UA)t_wall= .
ACKNOWLEDGMENT
The authors give special thanks to centre of energy studies, IIT Delhi for guiding us to complete our work. Also, the Indian Meteorology Department (IMD), Pune has a major role in providing data related to temperature of different cities.
REFERENCES
1. Agrawal, B., Tiwari, G.N “Building Integrated Photovoltaic Systems”: For sustainable development; RSC Publishing. 2010.
2. Agarwal, B, Tiwari GN “Performance evaluation of building integrated photovoltaic thermal (BIPVT) Systems”. International Journal of Green Energy. 2009,90,115-119.
3. Chauhan A, Sanjeev Anand “Futuristic approach to thermal management in solar PV/thermal systems with possible Applications”, Energy
conversion and management, 2018, 163,314-354.DOi:
http://dx.doi.org/10.1016/j.enconman.2013.11.016
4. Nayak, S. , Tiwari, G.N ”Energy and Exergy analysis of photovoltaic/thermal integrated with a solar greenhouse”, Energy and Buildings, 40, 2008, 2015-2021.
5. Gaur A , Tiwari GN “Performance of photovoltaic modules of different
solar cells”,,Journal of Solar Energy, 2013, DOI:
http://dx.doi.org/10.1155/2013/734581
6. Chow, T.T. “Performance analysis of photovoltaic-thermal collector by explicit dynamic model”. Solar Energy, 2003, 75, 143-152.
7. Tiwari A, Sodha MS, Chandra A, Joshi JC “Performance evaluation of photovoltaic thermal solar air collector or composite climate of India”. Solar Energy Materials and Solar Cells, 2006, 90: 175–189.
8. Loferski, J. J., Ahmad, J. M., Pandey, A “Performance of photovoltaic cells incorporated into unique hybrid Photovoltaic/thermal panels of a 2.8 KW residential solar energy conversion system”. In Proc. Of the 1988 Annual Meeting, American Solar Energy Society, Cambridge, Massachusetts, 1998, 427–432.
9. Tiwari A, Sodha MS,”Performance evaluation of hybrid PV/thermal water/air heating system: A parametic study”. Renewable Energy, 2006; 31: 2006, 2460–2474.
10. Rajoria, C.S., Sanjay Agrawal, Tiwari, G.N., “Overall thermal energy and exergy analysis of hybrid photovoltaic thermal array”. Solar Energy,
86, 2012, 1531-1538. Doi:
https://doi.org/10.1016/j.solener.2012.02.014
11. Rajoria, C.S., Sanjay Agrawal, Tiwari, G.N “Exergetic and enviro economic analysis of novel hybrid PVT array. Solar Energy”, 2013, 88, 110-119.DOI: http://dx.doi.org/10.1016/j.solener.2012.11.018 12. Singh S, Agrawal “Modelling and parameter optimization of hybrid
single channel photovoltaic thermal module using GA”. Solar Energy,
2015, 113:78-87.DOI:
http://dx.doi.org/10.1016%2Fj.solener.2014.12.031
13. Singh S, Agrawal “Parameter extraction and performance evaluation of glazed PVT module for Indian meteorological condition based on soft
computing technique”. IEEE conference.17-19
2016,Novemember.1-.DOI:10.1109/ICTFCEN.2016.8052712 14. Tushar sathe, A S Dhoble “A review on recent advancements in
photovoltaic thermal techniques”, 2017,76,645-672
15. Vats Kanchan, Tiwari G N “Energy and exergy analysis of a building integrated semitransparent photovoltaic thermal (BISPVT) system”. Applied energy, 2012, 96:409-416.
16. Wicker, U., Fux, V., Infield, D., Mei “ Heating and cooling of combined PV-solar air collector’s facades”. In: Proceedings of International Conference of 16th European PV solar energy. Glasgow, UK, 2000, 1–5 May, pp 1836–1839.
AUTHORSPROFILE
Amit Kumar Dash has done his Bachelor of Engineering from Utkal University,Bhubaneswar and completed his Masters from UPTU, Lucknow. Pursuing his Phd in the field of solar energy with 7 research papers which is Peer reviewed including SCI journals and attended conferences to deliver lectures.
He is a permanent member of Society of ISTE.
Dr Sanjay Aggrawal has done his Post-Doctoral Fellowship from SMERC, University of California, Los Angeles, CA, USA. He has completed his PhD from IIT, Delhi, M. Tech from UPTU, Lucknow and BE from Madan Mohan Malviya University of Technology, Gorakhpur, UP, India. He has more than 30 research paper in the field of solar