Abstract: Generally, a reliable method of analysing the quality of experience is through the subjective method, which is time consuming, lacks usability, lacks repeatability in real-time and near real-time. Another method is the objective measurement that aims at predicting the subjective measurement based on the estimated mean opinion score. Therefore, this study adopted the objective measurement by implementing a quality of experience framework, which employed predictive analytics techniques to analyse the mobile internet user experience dataset gathered through the mobile network. The predictive analytics employed the use of multiple regression, neural network, decision trees, random forest, and decision forest to predict the mobile internet perceived quality of experience. Result from the study shows that decision forests perform better than other algorithms used for the predictive analytics. In addition, the result indicates that the predictive analytics can be used to enhance the allocation of network resources based on location and time constituted in the dataset.
Keywords: Internet Service, Subscribers, Prediction, Real-time, Machine Learning
I. INTRODUCTION
The use of internet has reached a historic turning-point whereby internet usage on mobile devices have almost replaced the use of fixed-host or server used on desktop computers. At the same time, the wide proliferation of different applications used on mobile devices have made the usage of mobile internet gain a tremendous momentum in recent years. Internet usage on mobile devices allows the mobile internet subscribers (i.e., users) to connect with family and friends through voice or video calls, web browsing, e-mail, sharing of pictures and other information through the available mobile applications installed on individuals‟ mobile devices. Since, mobile internet subscribers have become the central focus of service design for the mobile network operators (MNOs), quality of experience (QoE) is now a new term coined to be used by the MNOs to quantify, manage, and improve the perception of the mobile internet subscribers.
Revised Manuscript Received on May 22, 2019.
Ayisat W.Yusuf-Asaju, Department of Computer Science, University of Ilorin, PMB 1515, Kwara-State Nigeria, School of Computing, Universiti Utara Malaysia, 06010, Sintok, Malaysia.
ZulkhairiMD. Dahalin, School of Computing, Universiti Utara Malaysia, 06010, Sintok, Malaysia
Azman Ta’a, School of Computing, Universiti Utara Malaysia, 06010, Sintok, Malaysia
QoE is a subjective measure that is like but different from quality of service (QoS [1]). QoS is the threshold of technical parameters of the MNO‟s performance. The technical parameters involve varieties of technologies and services that can be easily measured.
However, QoS is not specifically linked with the subscriber‟s perception [2], as such QoS alone is insufficient to measure the mobile internet subscribers‟ perception [3]. QoE is a multidimensional concept that integrates both the subjective and objective aspects of the internet services provided by the MNOs [3]. On one hand, the subjective aspect of internet services provided by the MNOs aimed at subscribers‟ experiences, expectation, personal and social background [3]. While, the objective aspect of the internet services is the network performance often represented in the form of the QoS parameters (e.g., throughput, bandwidth, loss, delay and jitter). QoE has become an important factor for most mobile internet subscribers when choosing aMNO. Therefore, the MNOs are faced with the challenges of monitoring and measuring QoE, because the performance of individual MNO can vary between location, time of the day, and may not always meet the mobile internet subscribers‟ expectations.
Considerable amount of literatures has proposed and assessed internet QoE through subjective and objective methods in both fixed-server used on desktop computers and mobile devices [4]. The subjective method of measuring QoE is a form of survey usually conducted in a laboratory experiments using mean opinion score (MOS) that represents the subjective QoE of the internet subscribers for a particular network service. Several studies have utilized MOS to measure the QoE of different internet services provided by the MNOs, the likes of video streaming [5], Voice over Internet Protocol (VOIP [6]), Skype voice calls [7] and web-browsing [8, 9]. Results from these studies demonstrated that the subjective method is a reliable measurement because it constituted the conscious and unconscious aspects of the subscribers‟ quality evaluation process that may not otherwise be captured [10, 9, 11, 12, 13]. Despite the reliability advantage of subjective measurement, previous studies have reported that the subjective measurement is expensive, time-consuming, not reproducible on demand and may not be adequate for in-service quality monitoring [13]. The drawbacks associated with the subjective measurement bring about the objective measurement, which can measure and predict the internet QoE in real or near
real-time.
Implementation of Quality of Experience
Prediction Framework through Mobile Network
Data
Generally, objective measurement is linked with quality estimation model related to mathematical and/ or comparative methods, which produce perceptible measure of the internet QoE [14]. Several studies have analysed the internet QoE degration (delay, jitter, loss and latency) based on parametric and hybrid models using user experience data gathered through the network. However, limited studies have considered context and content of internet service-related in mobile network [13] based on the user expectation as stated in service level agreement (SLA) and throughput representing the aggregated experienced by all the users on a particular node. In addition, while previous studies have reported an adequate and accurate estimated QoE, the use of multiple possible metrics comprising of time and location of mobile internet network is still limited in the literature, as most studied utilized the participant in laboratory experiments to estimate the perceived QoE [15, 9, 16].
Therefore, this study proposed an enhanced QoE framework to analyse (predict) perceived QoEthrough the use of mobile internet subscribers‟ experience throughput metrics gathered from the MNOs‟ network. The framework was implemented in Microsoft machine learning R client server (MMLRCS), through several machine learning algorithms like multiple regression, neural network, decision trees, random forest, and decision forest to predict the mobile internet perceived QoE. Results from this study shows that decision forests perform better than the other machine learning algorithms used for the predictive analytics. In addition, the result indicates that the predictive analytics can be used to enhance the allocation of network resources based on location (longitude and latitude) and time of the day variable used as predictors. Equally, overall, this study supported the results of previous studies that reported employing objective measurement to estimate and predict perceived QoE can overcome the drawback observed while analysing mobile internet perceived through the subjective method. The study compared the results obtained from the network traffic datasets obtained from the TEMS measurement platform with the predicted Perceived QoE. The predictive measurement results validated the methodology using acceptable relationship between the predicted MOS and the subjective QoE. Thus, the results show that the proposed framework used the prediction of perceived QoE can effectively measure the perceived QoE through the mobile network dataset.
The remainder of this article is organized as follows. Firstly, the articles provided an extensive literature on QoE, QoE measurements, QoE previous frameworks and proposed framework. Secondly, the articles discussed the methodological instances of implementing the proposed framework. Thirdly, the results obtained from the implementation phase was presented and discussed. Fourthly, the theoretical and practical contribution of the proposed QoE model was discussed. Lastly, conclusion and future work was discussed and highlighted respectively.
II. MOBILE INTERNET QUALITY OF EXPERIENCE
In wireless communication field, mobile internet is one of the most fast-growing field because of its impact in peoples‟ daily life and massive income generated by the MNOs. The growth was associated with the enormous development of different internet applications used on mobile devices. QoE is an essential phase of mobile internet service provisioning due to the spontaneous growth of subscribers who access the internet through their mobile devices. According to Qualinet white paper in [17], QoE is described as the “degree of delight or annoyance of the user of an application or service. It results from the fulfilment of his or her expectations with respect to the utility and / or enjoyment of the application or service in the light of the user‟s personality and current state.” This definition implies QoE combines the subscribers „perception, expectations, network performance and experience of the service applications. Mobile internet services provided by the MNO is influenced by different QoE factors that is system (e.g., delay, throughput, jitter, loss and security), human (gender, age, background and education), and context (location, time of the day, costs and subscription type [17]. Appraised QoE influence factors facilitates the assessment of subscribers perceived QoE [10]. System QoE influence factor in the form of QoS parameters (throughput, loss, bandwidth, delay, and jitter) is commonly examined in the literature. Among the QoS parameters, delay, jitter and latency is the most examined in previous studies, because previous studies believed quality degration affects the users‟ experience [11, 9, 18]. While most studies in the field of QoE has assessed throughput measurement for both wireless web traffic and mobile internet applications [9, 12, 19], few studies have used aggregated throughput measurements experienced by the user‟s mobile network environment. This implies that, previous studies examined QoEdegration through the fundamental network information and performance dataset gathered in laboratory experiments through the desktop computers [9, 12]. However, Tsiaras et al. in [16] reported that results obtained from the laboratory experiments may not be generally suitable because of the fixed contextual factors in the QoE assessment. Therefore, it is essential to examine mobile internet perceived QoE based on multiple possible throughput metrics along with the time of the day, location, and expectation to ensure a generalised objective perceived QoE measurement.
Quality of Experience Measurement
Subjective and objective measurements are the two types of perceived QoE measurements. Subjective measurement seeks to evaluate subscriber‟s immediate perception of the internet services provided by the MNOs using filled out surveys with MOS quantification in a controlled environment [20]. Subjective measurement provides an accurate and reliable measurement through the perceptual quality scale (excellent = 5, good= 4, fair = 3, poor = 2 and bad = 1) termed mean opinion score (MOS [21]). However, the subjective measurement is not visible in real-time QoE evaluation, time-consuming, expensive and is not reproducible on demand
In this case, the subjective measurement may not be adequate for in-service quality monitoring, whereby the subscribers experience can be gathered and evaluated in real or near real-time without the subscriber‟s participation [13]. Similarly, the subjective measurement may overburden the subscribers who struggle to determine the appropriate quality ratings based on their previous experiences [23]. Due to the drawbacks associated with the subjective measurement, objective measurement was developed to automatically predict (estimate) the perceived QoE based on the previous experience usage of the subscribers.
Objective measurement is concerned with the automatic prediction of subscribers QoE at high accuracy through algorithmic processing or mathematical models of the input parameters without the subscribers‟ intervention [13, 14, 24]. Schatz et al. in [24] highlighted that the objective measurement can only be appropriate when the input measurements closely relates with the subjective quality measurement. Thus, the basic design process of the objective measurement process is the derivation of quality models that correlates the perceptible influence factors into a predicted MOS values [24]. An example of the model used in objective measurement is the signal- based models used in media layers. The signal-based model is concerned with the comparison between the original source signal and the degraded destination signal by employing the knowledge derived from psychophysics [13]. Another example of the model type use in objective measurement is the hybrid model that is situated between the subjective and objective measurement [25]. The hybrid model operates as an automatic and objective quality estimator that is built on the previously available subjective scores. Oftentimes, the hybrid model employs the subjective test scores as an input to train the QoE model through the machine learning algorithms [13, 14, 25, 24]. This means the hybrid model is concerned with the mapping of the QoE influence factors to the MOS values that can be used for the real-time QoE prediction model [13, 14, 24].
Several studies have employed objective measurement for the prediction of perceived QoE in various applications through the machine learning algorithms [1, 9, 12, 22, 6, 14]. Most of these studies that used the objective measurement placed more focus on human factors that is concerned with the inherent characteristics [13]. However, the use of mobile internet usage data consisting of throughput metrics, corresponding context (location and time of the day), content of the services, expectation from both the user and the MNO‟s perspective are still limited in the literature.
Quality of Experience Prediction framework for Mobile Data Network
An abstract representation and relationship of dataset gathered from the users, network, or both and analysed with statistical and algorithms software for automatic prediction to get a higher accuracy is the process of modelling perceived QoE. Based on the drawbacks of limited use of mobile network diverse dataset comprising of the context and content of the internet services highlighted in the previous studies [14, 26, 27]. Therefore, this study enhanced
Yusuf-Asaju et al. study in [28] by implementing the perceived QoE framework through the dataset gathered from the mobile network in MMLRCS, The enhanced perceived QoE framework aimed at predicting the perceived QoE through the perceived QoE influence factors, perceived QoE measurements and estimations with the aim of overcoming limited use of mobile internet usage data consisting of throughput metrics, corresponding context (location and time of the day), content of the services, expectation from both the user and the MNO‟s perspective are still limited in the literature.
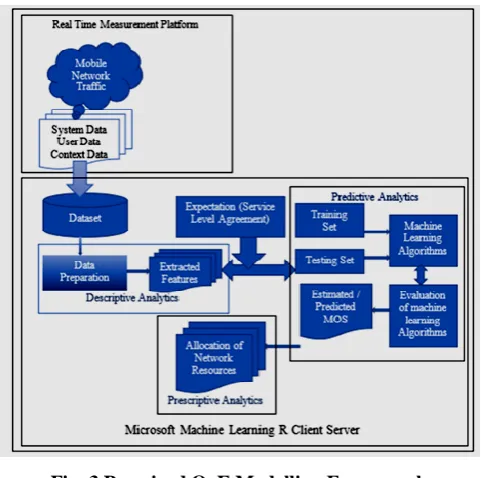
[image:3.595.307.548.416.655.2]Several studies have pointed out that contextual experiences a direct impact perceived QoE[16, 18]. Therefore, analysis of perceived QoE was based on all the three dimensions of the perceived QoE influence factors, which enables an adequate estimation of the perceived QoE in relation to mobility (such as time and location). The perceived QoE framework was proposed to overcome the drawbacks associated with the subjective measurement and bring about the objective measurement, which can measure and predict the internet QoE in real or near real-time without human intervention and enhance in-service quality monitoring [13]. In addition, the framework enables the prediction of perceived QoEthrough the use of mobile internet usage data consisting of throughput metrics, corresponding context (location and time of the day), content of the services, expectation from both the user and the MNO‟s perspective that is limitedly studied in the literature. The perceived QoE modelling framework is depicted in Figure 1.
Fig. 3 Perceived QoE Modelling Framework Implemented in MMLRCS
As reported in previous literatures[10, 29, 30], the mobile network traffic is believed to consist of the QoE influence factors (System, User, and context). These factors were gathered in the form of dataset from the real time measurement of the mobile network.
The second phase is the descriptive analytics. This phase involves the cleaning of the dataset gathered from the network traffic to make it suitable for the predictive analytics phase. This phase comprises of the data pre-processing, the data exploratory process feature selection and extraction from the dataset gathered from the mobile network traffic. The data pre-processing constitutes the cleaning, integration and transformation of the dataset to make it suitable for the predcitive analytics phase. Exploration process of the dataset is to enable better understanding of the dataset, and this is usually conducted using the statistical techniques. The feature selection focus on the selection of the relevant attributes and the extraction process integrates attributes into a reduced set of features to be used for the predictive analytics phase.
The third phase is the predictive analytics phase that involves modelling of the perceived QoE (estimating the MOS) through the machine learning algorithms. The predictive analytics model the perceived QoE through the observation of the dataset instances. In this study, the variables in the dataset collected from the mobile network and SLA are the independent variable while the predicted possible values of the dependent variable (MOS) outcome. Equally, for the effective modelling of the perceived QoE, the predictive modelling stage involves the training and testing set as shown in Figure 1. The fourth phase is the prescriptive analytics that involves using the results observed in the predictive analytics phase for allocation of network resources and other actions to improve the network performance of the mobile network.
III. IMPLEMENTATION OF PERCEIVED QOE MODELLING FRAMEWORK
The framework was implemented in MMLRCS, which is an extensible, scalable analytics platform that integrates machine learning tasks and tools for predictive analytics [31]. Based on the framework depicted in Figure 1, the implementation phase of the framework was divided into three parts, which are the data collection, data preparation and data modelling as discussed below. While the data collection process was conducted through test mobile system (TEMS), the data preparation and data modelling were conducted through the MMLRCS.
Data Collection
The dataset used for the implementation of the framework was collected from a major Africa telecommunications (telecoms) industry through the drive test measurement. The drive test measurement is a process used by the MNOs to evaluate the performance of different mobile network on predetermined parameters. According to Budhiraja and Jadon in [32], drive test can be used for network benchmarking, service quality monitoring, optimization, and troubleshooting. Service quality monitoring is the related drive test usage of this study because it focuses on the subscriber QoE and enables the MNOs to react to subjective
quality degradation promptly by investigating the technical cause of the degradation using the time correlated dataset collected during the drive test [32].
An example of the software used for drive test is TEMS. TEMS is an end-to-end testing solution used by the MNOs to test the quality of the service delivered to their subscribers from the subscribers‟ perspective (QoE) and network perspective (QoS). Therefore, to enable the implementation of the framework, HTTP (Hypertext transfer protocol) download and file transfer protocol download (FTP DL) dataset was collected through TEMS software. The dataset used in this study is the throughput parameters, time of the day, location (longitude and latitude) of subscribers, content in the form of different applications (HTTP and FTP DL) used by mobile internet subscribers. FTP is a protocol used to facilitate exchange of data between a server and clients(s) and is used as a test due to the specific nature of the data exchange. HTTP is the underlying protocol used in worldwide web (WWW) that is webpages and its data exchange is receiving and sending. Thus, the network test using FTP is to determine how the network fares when the user is downloading or uploading only. While, HTTP testing is how the network fares when downloading and uploading simultaneously. This is a common situation in mobile devices whereby the user sends and receive files simultaneously. Since FTP is specific for either downloading or uploading file, this study considers FTP download since most users often download applications to be used on their mobile devices. FTP simulates file download, HTTP simulates general browsing of the mobile applications. The dataset was collected at the different times of the day for different locations within a period of 3months to make a total of 4million observations to be used for the modelling of perceived QoE.
Data Preparation
The second implementation phase is data preparation that involves data pre-processing (data cleaning, integration, and transformation), exploratory analysis, feature, and extraction. The data cleaning and integration process helps to handle the missing values and identify error instances present in the data set. Transformation of the dataset was conducted using standardization method, which is the process of scaling data attributes, to enable the data attributes fall within the smaller range. In addition, mapping of the dataset to the MOS scores was done through discretization, which is the process of replacing raw values of a numeric attributes with interval labels or conceptual labels.
Since the dataset is a 3G dataset, the study assumes the maximum throughput that should be offered in a cell per second is 42Mbps. The initiative of the DQX model proposed by C. Tsiaras and Stiller in [34] was considered in this study, which allows the use of maximum and minimum expected values to be defined for the QoE influence factors selected and extracted from the datasets. Hence, the maximum and minimum values used for the mapping of the SLA (expectation) is 42Mbps and 0Mbps respectively. Afterwards, exploratory analysis was conducted through descriptive statistics to ensure the normality of the dataset. Equally, feature selection was conducted using correlation analysis, which can determine the relationship between the variables in the dataset. Lastly feature extraction process was carried out through the principal component analysis. Throughput variable representing the aggregated total application layer throughput, time of the day and location was extracted from the dataset for the two applications (HTTP and FTP DL). The descriptive statistics of the TT variable observed on the node is presented in Table 1 below
Table. 1 Descriptive Statistics of TT Variable Application
Type
Variable TT
Maximum Minimum Intervals FTP DL 35.77 Mbps 0 Mbps 7.2Mbps
HTTP 30.23 Mbps 0 Mbps 6.05Mbps
Perceived QoE Modelling
[image:5.595.316.540.275.376.2]This section focused on the modelling of the perceived QoE through the abstract representation of the dataset observations. To achieve the modelling of the perceived QoE, this study mapped the dataset to the MOS based on the TT variable (aggregated total application layer throughput used by the users on a node) and the absolute categorical rating (ACR) MOS scale was represented as a discreet value (that is 5= excellent. 4= good, 3= fair, 2 = poor, and 1= bad). In addition, the TT variable was also used to map the user expectation (SLA) into discreet value (that is 5= excellent. 4= good, 3= fair, 2 = poor, and 1= bad) based on the maximum 42Mbps that is achievable on a node [33, 35]. The interpretation was based on the maximum and minimum value of the TT variable for the ACR scale was achieved through probability mass function of the discrete random variable (TT). This is evident in the study of Battisti et al. in [36] that shows throughput has a linear relationship with MOS, that is an increase in throughput corresponds to an increase in MOS respectively. Table 2 and Table 3 presents the descriptive statistics of TT for both applications after the interpretation of the ACR scale through the probability mass function for MOS and SLA respectively. This process achieved translation of objective measurements into subjective test by rating the throughput achieved into perceived impairment giving one of the MOS and SLA scores.
Table. 2 Descriptive Statistics of TT Variable Interpretation to ACR MOS Score
FTP DL
Applications
HTTP Applications
TT Variable Intervals (Mpbs)
ACR MOS Score
TT Variable Intervals (Mpbs)
ACR MOS Score
Scale Interpretation
0-7.2 1 0-6.046 1 Poor 7.3-14.3 2 6.047 - 12.092 2 Bad 14.4-21.5 3 12.092 -
18.138
3 Fair
21.6-28.7 4 18.139 - 24.184
4 Good
[image:5.595.68.267.315.395.2]28.8-35.8 5 24.185 - 30.23 5 Excellent
Table. 3 Descriptive Statistics of TT Variable Interpretation to SLA Scale Score TT Variable
Intervals (Mpbs)
ACR MOS Score
Scale Interpretation
0-8.4 1 Poor
8.41-16.8 2 Bad
16.81-25.2 3 Fair
25.21-33.6 4 Good
33.61-42.00 5 Excellent
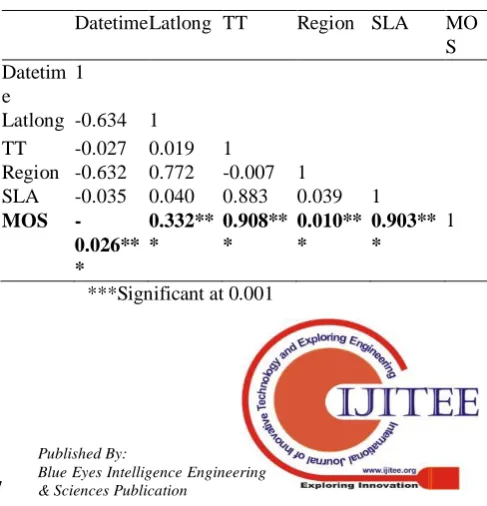
Correlation analysis was examined through Pearson correlation between the MOS and TT variable of FTP DL applications given a correlation value of 0.908 (significant at p<0.001). In the case of the HTTP application, correlation of TT and MOS was 0.915 (significant at p<0.001). Similarly, the correlation of the MOS and expectation was examined given 0.903 (significant at p<0.001) and 0.855 (significant at p<0.001) for both FTP DL and HTTP respectively. The correlation between the time of the day and MOS was -0.026 (significant at p<0.001) and 0.173 (significant at p<0.001) for both FTP DL and HTTP respectively. Lastly, the correlation between location and MOS was 0.332 (significant at p<0.001) and 0.033 (significant at p<0.001) for both FTP DL and HTTP respectively as presented in Table 4 and Table 5.
Table. 4 Correlation Matrix of FTP DL Application Datetime Latlong TT Region SLA MO
S Datetim
e
1
Latlong -0.634 1
TT -0.027 0.019 1
Region -0.632 0.772 -0.007 1
SLA -0.035 0.040 0.883 0.039 1
MOS
-0.026** *
0.332** *
0.908** *
0.010** *
0.903** *
1
[image:5.595.304.548.581.834.2]Table. 5 Correlation Matrix of HTTP Application Datetime Latlong TT Region SLA MOS Datetime 1
Latlong -0.193 1
TT 0.175 0.017 1
Region -0.452 0.793 -0.080 1
SLA 0.156 0.024 0.847 -0.076 1 MOS 0.173*** 0.033*** 0.915***
-0.071***
0.855*** 1 ***Significant at 0.001
The multiple R squared for multiple regression was 0.871 (standard error = 0.275) and 0.861 (standard error = 0.310) for FTP DL and HTTP respectively. The regression result was compared with other machine learning algorithms like, neural network, decision trees, random forest, and decision forest. The prediction analysis was conducted in MMLRCS platform by dividing the dataset into training (70%) and test (30%) sets and applying different machine learning algorithms. Evaluation of the resulted prediction model was carried out using (root mean squared error (RMSE) to determine the accuracy of the different machine learning algorithms used for the prediction model. While the actual MOS of FTP DL application was 1.5018 and actual MOS of HTTP was 1.6170, Tables 3 and 4 depicts the accuracy results of the prediction model along with the MOS of FTP DL and HTTP application respectively.
Table. 6 Perceived QoE Modelling Accuracy Result for FTP Download Applications
Machine Learning Algorithms
RMSE MOS
Multiple Linear Regression 0.274 1.5025 Decision Trees 0.120 1.5024 Random Forest 0.118 1.5021 Decision Forest 0.072 1.5019 Neural Network 0.141 1.4937
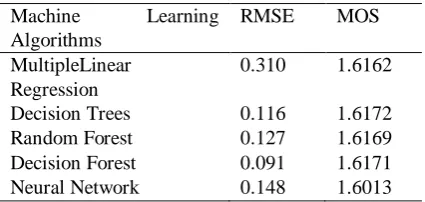
Table. 7 Perceived QoE Modelling Accuracy Result for HTTP Applications
Machine Learning Algorithms
RMSE MOS
MultipleLinear Regression
0.310 1.6162
Decision Trees 0.116 1.6172 Random Forest 0.127 1.6169 Decision Forest 0.091 1.6171 Neural Network 0.148 1.6013
The correlation results of MOS and throughput indicates increment in throughput will increase the MOS for both the FTP DL and HTTP applications. This finding supported the findings of Tsiaras et al. in [16] that states the effects of throughput are always felt in HTTP applications and the study of Battisti et al. in [36], which demonstrated increasing throughput corresponds to a linear increase in QoE. Overall, this result shows that the mobile internet users of HTTP and FTP DL application are experiencing a poor
perceived QoE since the MOS is between 1.5018 and 1.6170 for FTP DL and HTTP application respectively, with a correlation of 0.908 and 0.915 and highest prediction accuracy of Decision forest 0.072 and 0.091 for FTP DL and HTTP application respectively.
Similarly, the correlation of MOS and expectation also depicts a linear relationship. This means an increase in MOS tends towards achieving the user expectations and a decrease in MOS interprets the MNO are not meeting the user expectation. This assumption of previous studies that describes expectation in the form of SLA as a service contract between the customer and users [37]. Infact, Djogatovic et al. in [38] described expectation as a starting point of the perceived QoE evaluation process. However, the MNOs must always update the user expectation in the form of the service agreement from time to time as the technology improves. Following, Tsiaras et al. in [16] interpretation of MOS based on “expected value that either the user is paying for, or SLA defines or a service demands to perform as expected”, then this study can conclude that correlation of MOS and expectation corresponds to a poor experience at MOS 1.5 and 1.6 for both FTP DL and HTTP application respectively.
In addition, in a mobile environment, time of the day and location is an important influence on the perceive QoE. This was demonstrated with the correlation of the time of the day with the MOS for both FTP DL and HTTP applications. For example, it was observed from both raw data set and predicted data set that the MOS of the subscribers was low at peak time (busy time like 7am to 5pm), and high between 11pm and 5am. Another interesting evidence from the data is that the internet speed depends on the location of the subscribers for both applications. However, it was observed that the MOS of the subscriber in the urban areas is higher than those in the rural areas based on the coordinates of the location present in the data set. This evidence supports the work of Tsiaras et al. in [16] that time of the day and location is very important for the modelling of mobile internet perceived QoE.
[image:6.595.63.276.559.660.2]IV. THEORETICAL AND PRACTICAL CONTRIBUTION
To start with, the whole contribution of this study is that, to the utmost best of the researcher‟s knowledge, is one of the first attempts to predict perceived and bring empirical evidence on System (throughput), Human (Expectation and Region) and Context (Time of the day and location) QoE influence factors that helps to build a perceived QoE prediction model. Even though the results are mobile internet application independent, the overall results show that throughput, expectation, region, time of the day and location have a direct significant effect on perceived Therefore, this study contributes to the extant knowledge at the conceptualization stage by providing a perceived QoE prediction model without human intervention. This shows that MNOs can provide a proactive measure for improve the network performance [19], in areas that experience a low level of perceived QoE before the network performance would deteriorate and leads to large rate of mobile internet customer dissatisfaction.
Theoretically, this study incorporates all the three perceived QoE influence factors dimensions in the Perceived QoE modelling framework, which enables an adequate estimation of the perceived QoE in relation to mobility (such as time and location) that represents the context QoE influence factor, aggregated data transmission speed (throughputs) that represents the System QoE influence factor, expectation and region that represents the Human QoE influence factor. This was because of the limited use of time of the day, location, expectation, throughput, and region as a perceived QoE influence factor [10, 16, 9]). Afterwards, the findings showed that all the perceived QoE influence factors have significant effect on mobile internet perceived QoE.
Practically, the prediction perceived QoE showed that larger percentage of users were dissatisfied with the mobile internet services provided by both MNO. Based on the findings the MNOs can identify the perceived QoE of the users in real or near real-time, since the prediction method can capture the technical aspect of the network and performance and does not requires human intervention. In addition, the datasets used in this study was a traffic dataset, it can be concluded that the high rate of poor perceived experience can be because of lack of network resources [39]. This can be resolved by allocating network resources in locations that have poor rate of perceived experience. Because this study strongly believed good allocation of network resources will enhance the perceived QoE and in turn increases the customer satisfaction.
V. CONCLUSION AND FUTURE WORKS
This study presented an overview of mobile internet QoE, enhanced the perceived QoE modelling framework proposed in previous study. The framework was implemented in Microsoft R platform through the drive test dataset collected from the mobile network in real time environment. The dataset comprises of the throughput aggregated metrics experienced by the mobile internet subscribers, time of the day and location of the subscribers. The dataset was cleaned and prepared to make it suitable for the modelling of the
perceived QoE. Perceived QoE was modelled using different machine learning algorithms like neural network, decision trees, random forest, and decision forest. The accuracy of the prediction model shows that decision forest is the most suitable for the data set and the platform in which the perceived QoE was conducted. Evidence from this study indicated that, mobile internet data set collected through the drive test measurement can be used for the modelling of the perceived QoE based on the subscribers‟ expectation in the form of SLA. Equally, the result of the perceived QoE showed that larger percentage of subscribers experienced a poor internet services from the MNO that the dataset was used for the modelling of perceived QoE. In addition, the result obtained from the modelling of perceived QoE clearly indicated that the MNO can use predictive analytics result for prescriptive analytics (such as network allocation) using location and time of the day to address network issues appropriately before such issues will deteriorate and affect large number of subscribers. Future work will employ the use of standard deviation, cumulative density functions and quartile on the dataset to maximize the perceived QoE to determine the diversity of satisfied and unsatisfied mobile internet subscribers.
REFERENCES
1. M. Fiedler, T. Hossfeld and P. Tran-Gia, "A generic quantitative relationship between Quality of Experience and Quality of Service," IEEE Network 24(2), pp. 36-41, 2010.
2. M. Dong, K. Sugiura, T. Kimata and K. Zettsu, "Quality of experience
(QoE) in emerging mobile social network," Institute of electronics, information and communication engineers (IEICE) Transactions Information Systems 97 (10), pp. 2606-2612, 2014.
3. S. Qaiyum, I. A. Aziz and N. Haron, "Quality-of-Experience Modeling
in High-Density Wireless Network," Journal of Advanced Research Design 14(1), pp. 10-27, 2015.
4. C. W. Chen, P. Chatzimisios, T. Dagiuklas and L. Atzori, Multimedia
quality of experience (QoE) current status and future requirements, United Kingdom, John Wiley & Sons, Ltd, 2016.
5. L. Amour, S. Sami, S. Hoceini and A. Mellouk, "Building a Large Dataset for Model-based QoE Prediction in the Mobile Environment," in Proceedings of the 18th ACM International Conference on Modeling, Analysis and Simulation of Wireless and Mobile Systems, Cancun, Mexico, 2015.
6. P. Charonyktakis, M. Plakia, I. Tsamardinos and M. Papadopouli, "On
User-Centric Modular QoE Prediction for VoIP Based on Machine-Learning Algorithms," IEEE Transactions on mobile computing 15 (6), pp. 1443-1456, 2016.
7. T. Spetebroot, S. Afra, N. Aguilera, D. Saucez and C. Barakat, "From network-level measurements to expected Quality of Experience: the Skype use case," in IEEE International Workshop on Measurement and Networking (M&N), Coimbra, Portugal, 2015.
8. A. Balachandran, V. Aggarwal, E. Halepovic, J. Pang, S. Seshan, S. Venkataraman and H. Yan, "Modeling Web Quality-of-Experience on Cellular Networks," in MobiCom, Maui, Hawaii, USA, 2014. 9. M. Rugelj, M. Volk, U. Sedlar, J. Sterle and A. Kos, "A novel user
satisfaction prediction model for future network provisioning," Telecommunication system, 56 doi: 10.1007/s11235-013-9853-4 Springer, pp. 417-425, 2014.
11.J. Shaikh, M. Fiedler and D. Collange, "Quality of Experience from
user and network perspectives," Ann. Telecommun DOI:
10.1007/s12243-009-0142-x, Springer, pp. 47-57, 2010.
12.A. Singh, A. Mahmoud, A. Koensgen, X. Li, C. Göerg, M. Kus, M.
Kayralci and J. Grigutsch, "Enhancing Quality of Experience (QoE) Assessment Models for Web Traffic," in 5th International Conference, Cork, Ireland, 2013.
13.D. Tsolkas, E. Liotou, N. Passas and L. Merakos, "A Survey on Parametric QoE Estimation for Popular Services," Journal of Network and Computer Applications, 2016.
14.M. Alreshoodi and J. Woods, "Survey on QOE\QOS corelation models
for multimedia services," International Journal of Distributed and Parallel Systems (IJDPS) 4(3), pp. 53-72, 2013.
15.M. Andrews, J. Cao and J. McGowan, "Measuring Human Satisfaction
in Data Networks," in Proceedings of the 25th IEEE International conference on Computer Communications, Barcelona, Spain, 2006.
16.C. Tsiaras, A. Sehgal, S. Seeber, D. Dönni, B. Stiller, J. Schönwälder
and G. D. Rodosek, "Towards evaluating type of service related Quality-of-Experience on mobile networks," in 7th IFIP on Wireless and Mobile Networking Conference (WMNC), 2014.
17.P. Le Callet, S. Möller and A. Perkis, "Qualinet White Paper on Definitions of Quality of Experience Output version of the Dagstuhl
seminar 12181," 2 June 2012. [Online]. Available:
http://www.qualinet.eu/images/stories/whitepaper_v1.1_dagstuhl_outp ut_corrected.pdf.
18.E. Ibarrola, F. Liberal and A. Ferro, "Quality of service management for ISPs: A model and implementation methodology based on the ITU-T recommendation E.802 framework," IEEE Communications magazine, pp. 146-153, 2010.
19.E. Diaz-Aviles, F. Pinelli, K. Lynch, Z. Nabi, Y. Gkoufas, E. Bouillet,
F. Calabrese, E. Coughlan, P. Holland and J. Salzwedel, "Towards real-time customer experience prediction for telecommunication operators," in IEEE International Conference on Big Data (Big Data), 2015.
20. C. Lozano-Garzon, C. Ariza-Porras, S. Rivera-Diaz, H. Riveros-Ardila
and Y. Donoso, "Mobile Network QoE-QoS Decision Making Tool for Performance Optimization in Critical Web Service," International Journal of Computing and Communication 7(5), pp. 892-899, 2015.
21.N. Staelens, M. H. Pinson, P. Corriveau, F. De Turck and P.
Demeester, "Measuring of Video Quality in the network: From Quality of Service to User Experience," in Ninth International Workshop on Video Processing and Quality Metrics for Consumer Electronics (VPQM 2015), Chandler, 2015.
22.K. DeMoor, I. Ketyko, W. Joseph, T. Deryckere, L. De Marez, L.
Martens and G. Verleye, "Proposed framework for evaluating quality of experience in a mobile testbed- oriented living lab setting," Mobile Networks and Applications, 15 (3), pp. 378-391, 2010.
23.W. Song, D. Tjondronegoro and M. Docherty, "Understanding User
Experience of Mobile Video: Framework, Measurement, and
Optimization," intechopen.com,
http://www.intechopen.com/books/mobile-multimedia-user-and- technology-perspectives/understanding-userexperience-of-mobile-video-framework-measurement-and-optimization, 2012.
24.R. Schatz, T. Hoßfeld, L. Janowski and S. Egger, "From packets to people: Quality of experience as a new measurement challenge," in Data Traffic Monitoring and Analysis, vol. 7754, Biersack, E; Callegari, C; Matijasevic, M. Eds. Berlin, Heidelberg, Berlin Heidelberg, Springer, 2013, p. 219–263.
25.E. Liotou, D. Tsolkas and N. Passas, "A Roadmap on QoE Metrics and
Models," in 23rd International Conference on Telecommunications (ICT), 2016.
26.P. Reichl, S. Egger, S. Möller, K. Kilkki, M. Fiedler, T. Hossfeld, C. Tsiaras and A. Asrese, "Towards a comprehensive framework for QoE and user behavior modelling," in Seventh International Workshop on Quality of Multimedia Experience (QoMEX), 2015.
27.V. A. Machado, C. N. Silva, R. S. Oliveira, A. M. Melo, M. Silva, C.
R. L. Francês, J. C. W. A. Costa, N. L. Vijaykumar and C. M. Hirata, "A New Proposal to Provide Estimation of QoS and QoEoverWiMAX Networks An approach based on computational intelligence and discrete-event simulation," in IEEE Latin-American Conference on
Communications (LATINCOM), Doi: 10.1109/LatinCOM.2011.
6107419, 2011.
28.A. W. Yusuf-Asaju, M. D. Zulkhairi and A. Ta‟a, "Framework for modelling mobile network quality of experience through big data analytics approach.," Journal of Information and Communication Technology (JICT), 17 (1), pp. 79-113, 2018.
29.J. Spiess, Y. T'Joens, R. Dragnea, P. Spencer and L. Philippart, "Using big data to improve customer experience and business performance," Bell labs technical journal 18(4) doi: 10.1002/bltj.21642, pp. 3-17, 2014.
30.K. Zheng, Z. Yang, K. Zhang, P. Chatzimisios, K. Yang and W. Xiang,
"Big data-driven optimization for mobile networks towards 5G," IEEE network, pp. 44-51, 2016.
31.Microsoft, "Advanced analytics on SQL Server," 2 2 2018. [Online]. Available: https://docs.microsoft.com/en-us/sql/advanced-analytics/r/r-services.
32.R. Budhiraja and J. S. Jadon, "Study and Implementation of Drive Test
For Development Of GSM Network," International Journal of Engineering Trends and Technology (IJETT) 4(10), pp. 4352-4357, 2013.
33.Techtarget, "HSPA (high speed packet access)," 2 2 2018. [Online]. Available:
http://searchmobilecomputing.techtarget.com/definition/HSPA-high-speed-packet-access.
34.C. Tsiaras and B. Stiller, "A deterministic QoE formalization of user satisfaction demand (DQX)," in Annual IEEE conference on local computer networks, Canada, 2014a.
35.Ericson, "Basic Concepts of HSPA," 02 2007. [Online]. Available: http://escrig.perso.enseeiht.fr/HSPA-Concepts.pdf.
36.F. Battisti, M. Carli and P. Paudyal, "QoS to QoE mapping model for wired/wireless video communication," in Euro Med Telco Conference (EMTC), 2014.
37.J. Gozdecki, A. Jajszczyk and R. Stankiewicz, "Quality of service terminology in IP networks.," IEEE Communication Magazine 41(3), pp. 153-159, 2003.
38.V. R. Djogatovic, A. Kostic-Ljubisavljevic, M. Stojanovic and B.
Mikavica, "Quality of experience in telecommunication," in 8th International Quality Conference, Kragujevac, 2014.