International Journal of Innovative Technology and Exploring Engineering (IJITEE) ISSN: 2278-3075,Volume-8 Issue-11, September 2019
Abstract:In this paper, a compelling methodology, Taguchi grey relational analysis, was employed to the test results of wire-cut electrical discharge machining on Titanium Grade - 5 material with the consideration of multiple performance characteristics of the output response variables. The methodology merges the orthogonal array design of experiment with grey relational analysis. The primary target of this examination is to accomplish the maximization of material removal rate, minimization of both Surface roughness and kerf width. Grey relational theory is implemented to assess the optimal process parameters that improve the response measures. The test was finished by utilizing Taguchi's orthogonal array L18. Each test has been performed under various states of input parameters. The response table and grey relational grade for each level of the machining parameters have been established. From 18 tests, the best mix of parameters was identified. The results of test verify that the suggested technique in this investigation adequately develops the machining performance of Wire cut EDM process.
Keywords: Titanium grade-5 material, Wire cut electrical discharge machining, GRA, Optimization technique
I. INTRODUCTION A. Wire cut EDM
W
ire cut electrical discharge machining (WEDM) is one of the most widely accepted non- conventional machining process for material removal used to manufacture components with complicated or intricate shapes and profile. A thin wire used as an electrode for transforming the electrical energy into the thermal energy for cutting the materials in the WEDM process. By the use of this WEDM process alloy steels, conductive ceramics and aerospace materials irrespective of their hardness and toughness can be machined. WEDM process is capable of producing a fine, precise, corrosion and wear resistant surfaces. Wire cut EDM machining process is an electro thermalRevised Manuscript Received on September 05, 2019. * Correspondence Author
P.Sai Kumar*, M. Tech II year, Department of Mechanical Engineering, Prasad V Potluri Siddhartha Institute of Technology, Vijayawada, India, mail id: [email protected]
Dr. M.S.R.Niranjan Kumar, Professor & COE, Department of Mechanical Engineering, Prasad V Potluri Siddhartha Institute of Technology, Vijayawada, India. Mail id: , niranjan.m356gmail.com
P, Gopala krishnaiah, Assistant Professor, Department of Mechanical Engineering, Prasad V Potluri Siddhartha Institute of Technology, Vijayawada, India, mail id:[email protected]
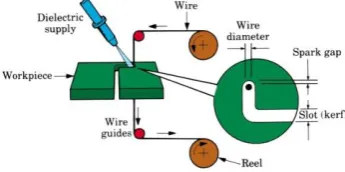
[image:1.595.357.530.492.578.2]production process in which wire electrode such as a thin single-standard wire, generally brass wire, is fed through the work piece and immersed into the dielectric fluid, typically distilled water, which is used to conduct the electricity. And it allows the wire to cut the work piece through metal by the using of heat from the electrical spark. Spark jumps over gap between wire and work piece and then the material is expelled from the work piece and wire or electrode. To stop the sparking process from shorting out a non-conductive fluid or dielectric fluid is also applied. The waste material is expelled from work piece by dielectrics and the process will continue until the desired shape of geometry obtained. Wire cut EDM is generally used when the low residual stresses are desired because it does not require any higher cutting forces for the removal of material from the work piece. If the energy per pulse is comparably little as in finishing operation, due to these small residual stresses little change in the mechanical properties of the material is anticipated. While the material that has not been stress relieved can cause distortion during the machining process. The main objective of this work is to achieve the optimization of the minimum kerf width and the better quality of surface roughness and maximum material removal rate simultaneously.
Fig. 1 wire cut EDM process
In the past few years, Wire cut EDM has become an essential non-conventional machining process, which is extensively utilized in the biomedical, aerospace, and automotive industries. Although, the choice of the cutting parameters for attaining larger cutting efficiency or exactness in the Wire cut EDM is not still completely solved, even with the most up-to-date Computer Numerical Controlled Wire cut EDM machine. Due to the problematic process mechanism in Wire cut EDM, the relationship between the cutting performance and cutting parameters are difficult to design the model precisely.
Optimization of Process Parameters of Wire Cut
Electrical Discharge Machining on Titanium
Grade-5 Material using Design of Experiments
Material using Design of Experiments
B. Literature surveyIn WEDM one of the most significant procedures is to select the machining parameters for achieving optimal machining performance of Titanium Grade-5 material. For the most part, the ideal machining parameters of WEDM are resolved dependent on the trial results. In any case, this does not guarantee that they chose machining parameters bring about ideal or close ideal machining execution for the specific wire-cut electrical discharge machine and condition. Saravanan Ma et al. [1] clarified the technique for improvement of WEDM process parameters on TiGr2 material just as SR and MRR associated with corner machining mechanism utilizing the Taguchi strategy. It has been seen that the gap voltage, wire tension, and diameter of wire play a vital role during the machining process. From observed results reveal that at a Ton of 8µs, DV of 35 Volts, WF of 45 mm/min Toff of 7µs, the IP of 7amps, wire thickness of 0.20 mm and WT of 1600N/mm. P. Sneh et al. [2] optimization of WEDM process by Taguchi method approach while machining of Ti-6AL-4V alloy. The examination of the results demonstrates that the factors of machining affect the output reactions. The watched outcomes uncover that the Ton has the largest grounded impact on the MRR and WS has the most grounded impact on kerf width and SR. Siva Prasad Arikatla et al. [3] researched the procedure execution of kerf width, material removal rate, and surface roughness of Wire EDM and surface geography of wire electrical discharge machining surface of Titanium alloy. From the observed experimental results reveal that the kerf width increments as the Ton, IP, SV, and WT increments and the material removal rate increments as the Ton and IP increases and the Ton and IP increases, the surface roughness also increases. Dwaipayan De et al. [4] investigated on the output responses such as kerf width and overcut of wire cut electrical discharge machining such as Ton, Toff, wire tension and WF. The response surface methodology (4 factors 3 levels) design of experiment (DOE) has been connected to look at the machining capacity of unadulterated sintered Titanium alloy. The observed experimental results reveal that the machining output response such as Ton, Toff, WT and WF demonstrates a tremendous impact on the output reactions. It has been shown that the response surface methodology can optimize the input process parameters to get the best output responses. J.B. Saedon et al. [6] analyzed the mixed technique of an OA and GRA is utilized for the determination of ideal combination of procedure parameters of titanium alloy. From the experimental results reveal that the optimal machining parameters of titanium alloy achieved smaller the SR, larger CS and larger MRR are; the Ton at 3s, IP at 12A, WT at 16 N and WF at 4 mm/min. It has been demonstrated that the proposed method can improve the exhibition attributes of the WEDM procedure parameters like CS, MRR, and SR. A.V.S. Ram Prasad et al. [6] investigated the impact of machining output responses on the material removal rate and surface roughness in wire cut electrical discharge machining tasks for Ti-6Al-4V. Based on the Taguchi method analyses were conducted to think about the presentation qualities of different machining parameters on the material removal rate and surface roughness. The output responses of MRR and Ra were calculated by utilizing ANOVA. It has been discovered that the dependent upon the analysis biggest important output responses on both material
removal rate and Ra the IP and Ton, while Toff and SV has fewer compelling elements; both material removal rate and surface finish increment or abatement at the same time. Prathik Jain S et al. [7] studied the performance of SR and AE signals while machining Titanium Grade-2 material utilizing Artificial Neural Network in wire cut electrical discharge machining. Each trial directed under the various states of info parameters, for example, Ton, Toff, IP and bed speed. During machining of the titanium grade-2 material in WEDM, the process parameters voltage and flush rate were kept constant. It has been shown that the Artificial Neural Network can estimates the SR and AE (Absolute Energy) successfully. Binoy Kumar Baroi et al. [8] investigated the rate commitment of every information parameter on the yield reactions by the use of performance of the ANOVA. It has been observed that the variety of power and Ton on yield reactions of material removal rate, tool wear ratio, and surface roughness. From the exploratory outcomes, it has been discovered that the material removal rate differs from 0.0010733-0.0053367 g/min, tool wear ratio fluctuates from 0.0000067-0.0018600 g/min, and SR differs from 2.960-5.792 µm and most noteworthy MRR of 0.0053367 g/min, least TWR of 0.0000067 g/min and SR of 2.960 µm has been accomplished. The framework of this work is organized as follows. The work starts with the selection of process parameters and experimental runs and procedure followed by the Taguchi analysis of obtained data. Then Taguchi grey relational analysis of the various measures of performance characteristics are talked about in detail. Analysis of variance of GRG has been used to predict the optimal process parameters. In last segment of this work, the experimental validation of the results is carried out.
II. MATERIAL AND METHODS A. Work Material
Titanium alloys are very tough materials which consist of mix of titanium and synthetic components. These materials have great mechanical properties like high rigidity, fatigue resistance, corrosion resistance, a most noteworthy strength-to-weight proportion, and unprecedented strength even at the raised temperature. It is a solid and light in weight alloy. It has the most elevated solidarity-to-weight proportion compared with different metals that are concentrated to utilization of medicine as a result of this excellent property. By using the conventional machining methods machining of the titanium and its amalgams have a few challenges, for example, large cutting temperature and large device wear proportion. In this way, hard to machine materials of titanium and its amalgams. Therefore, for the machining of the titanium and its composites the non-traditional machining procedures are introduced. An alpha-beta sort titanium grade-5 material (Ti-6Al-4) has been chosen as work material for the present investigation. The titanium grade-5 material (Ti-6Al-4V) has a resistant on the request for multiple times more noteworthy than the steel which is utilized for the different applications like flying machine gas turbine circles, prosthetic gadgets, motor segments, airframe auxiliary segments, seaward, control age
International Journal of Innovative Technology and Exploring Engineering (IJITEE) ISSN: 2278-3075,Volume-8 Issue-11, September 2019
[image:3.595.88.267.98.296.2]The chemical composition of Titanium grade-5 material is provided in Table 1 as well as typical properties is given in table 2.
Table 1: Chemical composition of Titanium grade-5 material
Element Percent by weight
Titanium 90% Aluminiu m
6%
Vanadium 4% Carbon <0.10% Oxygen <0.20% Nitrogen <0.05% Hydrogen <0.0125% Iron <0.3%
Table 2: property of Titanium grade-5 material
Material Thermal conductivity
Titanium grade-5 material 6.7W/m-k
B. Experimental Setup and Experimental Procedure a. Schematic of Machining
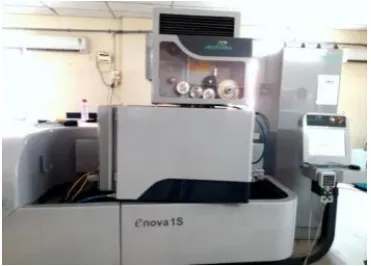
The eNOVA 1S submerged type traveling non- conventional Wire cut Electrical Discharge Machine (WEDM) was used to carry out all the experiments. Before the experimentation starts the operator properly choose all input parameters to allow the machine to operate.
The experiments were carried out on eNOVA 1S computerized numerical control wire cut electrical discharge machining machine. It contains the axes of four are servo-controlled and machining has been modified to pursue codes of computerized numerical control which are nourished through the control board. And possess the precision of 1µm for all the four axes. The Boline H plus brass wire used as an electrode material and it has the diameter of 0.25 mm and elasticity of 1000 Mpa. The small gap is maintained between the wire and workpiece within the range of 0.025 to 0.05 mm. By the process of vaporizing and local melting, the high-energy-density has destroyed the material from the tool and electrode. The distilled water is used as a dielectric fluid and it is ceaselessly excited over the hole across the electrode and to the starting territory, to expel the creation of garbage throughout the disintegration. The accumulation tank used to collect the used wire erosion and then disposed and it is located at the bottom. Because of the variety in dimensional precision, the once used wires cannot be reused again. The machining can be modified based on NC code. The wire cut EDM of Titanium grade-5 material was assessed in the present arrangement of investigation study. The Titanium Grade-5 material is utilized as the workpiece material and it has the dimensions of 258mm X 40mm X7mm respectively. For the experimentation size of the work material is assessed on the Wire cut electrical discharge machining machine 10 mm length, 10 mm width, and 7 mm depth of trim. As indicated by the Taguchi approach dependent on the strong structure, the L18 OA is applied for the performance of experimentation. Conduct the experiments in random orderly as per the Taguchi orthogonal array. 18 work pieces of square pockets are trimmed for this examination. In setting the machining parameters especially in the activity of unpleasant cutting, to achieve the measures of process performance characteristics for maximizing
[image:3.595.74.265.262.338.2]material removal rate, minimizing surface roughness and minimization of kerf width. Usually, the table of input parameters to be utilized for set input parameters which are provided by the machine tool builders. This process mainly depends on the skill of the operator. By and large, it is exceptionally complicated to utilize the ideal elements of a machine giving for there being an excessive number of movable parameters of machining. To reduce this problem, a basic yet predictable approach dependent on the factually planned experiment is proposed for analyzing the impact of various procedure parameters on material removal rate, surface roughness, and kerf width and finds the ideal procedure settings. In this study, the information has been gathered from all the tests performed with arbitrarily chosen mixes of factors. The quadratic prototype has been made for the reorganization of the machining procedure to create inexact interrelation among the different process parameters just as the reaction of output factors. These mathematical models used to achieve the information according to Taguchi experimental design of approach. At last, grey-dependent Taguchi approach was embraced to analyze the ideal procedure condition. Among the four Wire cut EDM parameters, for all the three levels four control elements are assessed for ideality investigation during the machining of Titanium grade-5 material. Fig. 3 represents the work material after performing on Wire cut EDM.
[image:3.595.339.525.305.438.2]Fig. 2 enova 1S Wire Cut EDM
Fig. 3 Titanium grade-5 material after performing on wire cut EDM
C. Selection of Machining Parameters and Performance Estimation
[image:3.595.317.538.484.584.2]Material using Design of Experiments
As MRR, SR, and kerf width are the major significant outputreactions in Wire cut EDM. Hence, the choice of machining parameters problem is not completely contingent upon the machine controls rather on the dependence of material. In this present work, has been studied the behaviors of the four control factors like a Ton, Toff, IP, and SV. These machining parameters with their levels and ranges are represented in the below Table 3. The machining process parameters must be at least in three levels to give back the true behavior of the output response parameters of the study. Based on a review of the literature survey and experience the machining parameter has been chosen. The Wire cut EDM has conducted the experiments to study the influence of the machining of process parameters on the characteristics of the output responses like material removal rate (MRR), kerf width and surface roughness (SR). To achieved the high productivity of the Wire cut EDM with the maximum amount of MRR, and with the minimum amount of the kerf width and SR.
III. EXPERIMENTAL RESULTS AND DISCUSSIONS The various output reactions from the test results has been determined as pursues:
The MRR is determined as;
MRR= (Cutting speed) X (Kerf width) X (Thickness of Workpiece) mm3/min
Cutting speed (CS) is calculated as; CS = in (mm/min)
Where;
Cutting speed in millimeters per minute Kerf width in millimeters
The thickness of the workpiece in millimeters and
Kerf width = Outer diameter – Inner diameter of the workpiece in mm
Kerf width is measured with Digital Vernier Calipers in mm and SR is deliberate with the Surface Talysur tester
By using statistical software Minitab 17, statistical analysis was carried out on the experimental data achieved through the Taguchi experimental design approach. The ANOVA has been conducted to determine the effect of the measures of performance on the output response variables. Hence, the main focal point of this present investigation is on the GRA, the Taguchi experimental results were not complicated here. In this segment, subsequently, have two subsections. The primary subsection explains the Taguchi design of experimental results detailed. The subsequent subsection explains the results of the utilization of GRA as shown in (Table 4).
A. Statistical Outcomes Dependent on the Taguchi Examination
The individual performance characteristics of statistical analysis were completed to find the effect the four control factors such as pulse on time, pulse off time, peak current and servo voltage on the output response variables like material removal rate, kerf width, and surface roughness. Table 5.4.1 shows the results of ANOVA for the selected performance characteristics such as MRR, kerf width, and SR.
B. Optimization Steps Using Taguchi Grey Technique For our situation, the issue has four performance characteristics that are should have been limited by selecting suitable handling conditions. They are MRR, rate, kerf width, and SR. In these situations, the issue is transformed into a single objective problem utilizing GRA (see Fig. 6). It has been dealing the ranks and not with the genuine value of the GRA.
a. Method of The Present Examination
The Wire cut EDM procedure is to be investigated correlate with 18 distinct experiments. For the grey relational analysis, these 18 tests become 18 subsystems. By using the GRA technique, the impact of these subsystems on the response factor has been dissected. Since the process (system) is estimated by performed 18 experiments (subsystems) where each of the experiments termed as comparability sequence have been achieved. The parametric states are correlated with the largest GRG give the minimum values of the kerf width and SR, and the maximum values of the MRR. In this aspect, the multi-objective problem has been transformed into a single objective optimization applying the grey relational grade strategy.
b. Plan of The Problem
Since, under the investigation the multi-objective optimization problem can be declared as "minimize: f (Kerf width, Surface roughness)" and maximize: f (material removal rate), in view of the free factors, for example, pulse on-time Ton (in microseconds), pulse off-time Toff (in microseconds), servo voltage SV (volts), and peak current IP (amperes). The range of the independent variables should be 100≤Ton≤110; Toff, 50≤55≤60; IP, 10≤11≤12; and SV, 10≤15≤20.
Moreover, the above multi-objective optimization problem has been transformed into a single optimization problem adopting the GRG technique as “maximizing Grey Relational Grade (GRG); 0≤GRG≤1," based on the free factors in the scope referenced previously.
c. Methodology
The stepwise procedure of Grey Rational Analysis (GRA) has been shown below in the flow chart (see Fig.4.3) is utilized to solve the formulation. To calculate the approximate correlation between these sequences in terms of grey relational grade with the absolute value of data difference between the comparability sequences.
STEP 1: Normalization of Signal-To-Noise Ratio
International Journal of Innovative Technology and Exploring Engineering (IJITEE) ISSN: 2278-3075,Volume-8 Issue-11, September 2019
The higher-the-better performance characteristic is used for the material removal rate (MRR) to determine the maximum MRR since the maximization of the optimum quality characteristic is sought and it can be expressed as follows;
/
S N ratio
log10 1 12 1 n
n i y
ij
(1)Where
n = quantity of repetitive and Detected reaction value Where i=1, 2, 3 ….n, j = 1, 2, 3…..k.
Both the SR and Kerf width are have the “smaller- the-better” performance characteristics and it can be expressed as the same for the loss function;
1 2
/ log10
1
n
S Nratio yij
n i
(2)STEP 2: Calculation of Deviation Sequences
,
oi k
Deviation sequence oi
k is the distinction between the absolute reference sequencesx*o( )k and the comparability sequencexi*( )k after the normalization of S/N ratio and itcan be calculated by utilizing Eq. 3:
*| xo( )k xi*( ) |k
oi k
(3)
STEP 3: Determination of Grey Relational Coefficient Grey relation coefficient for every one of the sequences of expresses the connection between the real normalized S/N ratio and the ideal (best). On the off chance that at all points the two sequences are agreed, at that point the grey relational coefficient is 1: y xo k x k (
, i )can be communicated by Eq. 4
min
max,
max
( )
y xo k x ki
oi k
(4)
Where min is the littlest value of the
max min | x*( ) *( ) |oi k i k
k o k xo
and
max
Is the biggest value of the
max min | x*( ) *( ) |oi k i k o k xi k
is the
ideal normalized S/N ratioxi*( )k is the normalized comparability sequence, and ζ is the distinctive coefficient. The value of the ζ has been balanced with actual need of the orderly and it very well may be characterized in the range of 0 to 1, ζ[0, 1]. It will be used generally is 0.5.
STEP 4: Determination of Grey Relational Grade Based on GRG the general various execution qualities are evaluated. The GRG is the normal sum of the GRC. It can be expressed as follows:
( 0, ) 1 ( 0( ), ( )) 1
n
y x xi y x k x ki
i m
(5)
Where, ( 0, )
y x xi is the GRG for the jth test, And m is the quantity of performance characteristics
In the event that at the all point the two sequences are concur, at that point the GRG is 1 wherever, and hence, their GRG must be equivalent to I. In the visibility of this, the comparing of two sequences of the grey relational grade can be specified by the average estimation of their GRC and the GRG. It has been also specify the influence degree that an comparability sequence should employ across the reference sequence. Hence, If the particular likeness sequence should simply contrast to the after comparability sequences particularly to the reference sequences. Therefore, GRG for that the reference sequence and the comparability sequence will be greater than the other GRG’s.
STEP 5: Calculation of Optimum Process Parameters For each sequence the grey relational grade has been determined is `taken as the response for the further analysis. To analyzing the grey relational grade the higher-the-better quality characteristic has been used, hence, the larger value specifies the better performance of the process. The quality characteristics are to be used is given the Eq. 1. The number of replicated test is 1; hence, the only one grey relational grade was obtained in each group for this particular determination of S/N ratio. By using the analysis of variance (ANOVA) the grey relational grade has been analyzed and it is obtained by using the Eq. 5. The ANOVA is used to explain the level of significance of the factors on a particular response. This is experienced by the dividing the absolute variability of the GRG’s and that is calculated by the total squared deviations from all out GRG mean, into the percentage contribution by every one of procedure parameters and mistakes. Based on response table of the Taguchi methodology is utilized to determine the GRG mean for every level of the factor. In this, the assembling of the GRG has been completed originally by the factor level for every of the columns in the OA and after that meaning them.
IV. UTILIZATION OF GREY RELATIONAL
ANALYSIS
Material using Design of Experiments
After the normalization all the deviation sequences indicatedas and oi
k for the comparability sequence and reference sequence separately. The normalized results of the higher value can express the superior performance characteristics, and results of optimum normalized are will be equivalent to 1. At that point, with the using of Eq. 3 the deviation sequences
*| xo( )k xi*( ) |k
oi k
are calculated. After, the GRC
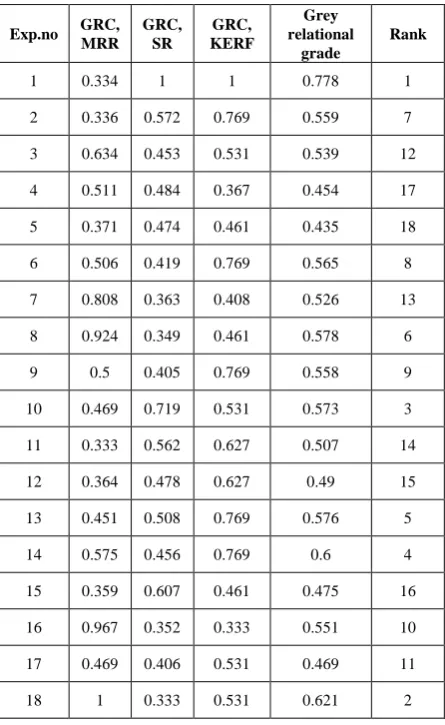
is determined. In this investigation, the effect of all the machining performance measures on the MRR and just as well as SR, kerf width, furthermore, similarly. By taking into account that the equal weighting of all the process parameters, and the value of the distinguishing coefficient of the ζ = 0.5 has been replacement in Eq. 4. At that point, by using the Eq. 5 the GRG has been calculated. The GRG’s for every one of the tests utilizing the L18 OA have been represented in table 7. Larger value of the GRG denotes that the corresponding S/N ratio is much nearer to the ideally normalized S/N ratio. From the GRG data, which is followed experiment 1 has largest GRG (see Table 7); hence, it is treated as the best sequence of the experiment for different performances of machining procedure. Additionally, the order of the tests is confirming to the values of the GRG is represented in Table 7.To analyze the obtained GRG’s by the use of the Taguchi method. The determined GRG has been extracting the value
[image:6.595.96.502.371.459.2]of response in the Taguchi technique. The overall grey relational grade of the mean response table as represented in table 8 and is illustrated graphically in Fig. 9 the line up of Fig. 8 indicates the averages of the GRG utilizing the “bigger the-better” principle utilizing Eq. 1. The grey relational grade of the steep slot graph represents the most impact of the machining parameters in the form of performance characteristics. Firstly, the higher the values of the GRG, the multiple performance characteristics have the better. The ideal parametric state has been calculated from the chart of the GRG. The optimum parameter setting is A1, B1, C1, and D1, by users throughout the machining of titanium alloy at larger cutting rates the similar results were followed. Due to the greater thermal impact in the machining area, the surface flaws and interruptions get killed, which causes at the larger cutting speed. Thus, the significant decrement in SR is found. Moreover, it promotes the simple removal of the work piece material because of the decreased unique shear quality of Titanium grade-5 material in existence of larger thermal impact in the machining area. Hence, during the machining condition, the lower efforts are produced. Therefore, the general machining performance is larger and returns in the larger value of the GRG. Hence, the general machining execution is superior at the bigger grey relational grade (see Figs. 7, 8, and 9).
Table 3: Experimental factors and their levels for Wire cut EDM process
Sample no. Facto
r parameters Symbol
Level 1 Level 2 Level 3
Range of process parameters
-1 0 1
[image:6.595.118.486.499.715.2]1 A Pulse on time T on (μs) 100 105 110 100-110 2 B Pulse off time T off (μs) 50 55 60 50-60 3 C Peak current IP (Amps) 10 11 12 10-12 4 D Servo voltage SV (Volts) 10 15 20 10-20
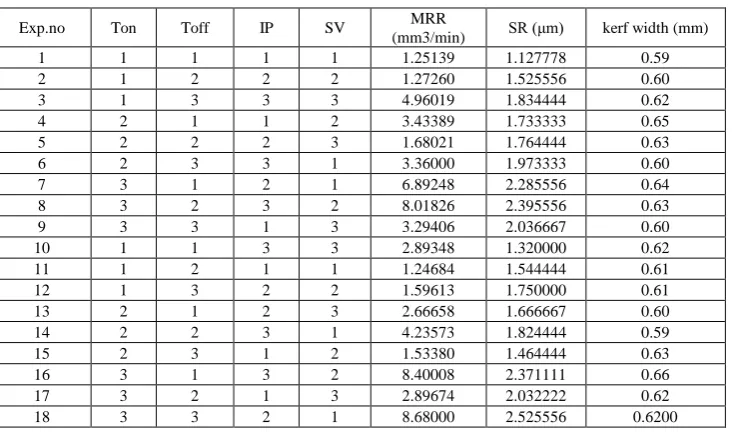
Table 4: Experimental design adopting L18 orthogonal array and experimental results
Exp.no Ton Toff IP SV MRR
International Journal of Innovative Technology and Exploring Engineering (IJITEE) ISSN: 2278-3075,Volume-8 Issue-11, September 2019
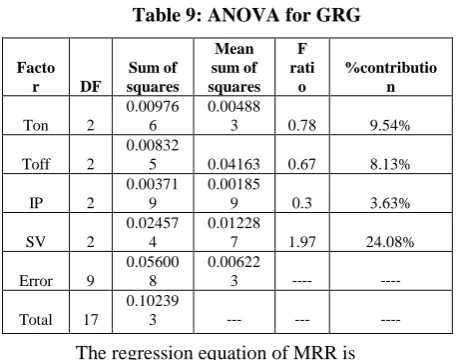
V. ANALYSIS OF VARIANCE
[image:7.595.52.259.215.277.2]The results are achieved from the experiments were analyzed applying the analysis of variance to determine the importance of each input factors on the measures of process performance characteristics of output responses such as material removal rate (MRR), surface roughness (SR) and kerf width. Applying the value of GRG, Analysis of variance is prepared for determining the important factor. The results of analysis of variance are given in Tables 9 and 10. The results of the analysis of variance were given in above Table and from this Table, it has been clarified that the servo voltage is significant
influence variable (contributing 24.08% to performance measures), pursued by Ton (contributing 9.54%), Toff (contributing 8.13%) and peak current (contributing 3.63%).
.
Fig. 4 Interactions between processing conditions and
[image:7.595.110.517.358.744.2]output responses Fig. 5 Response of grey relational analysis purpose
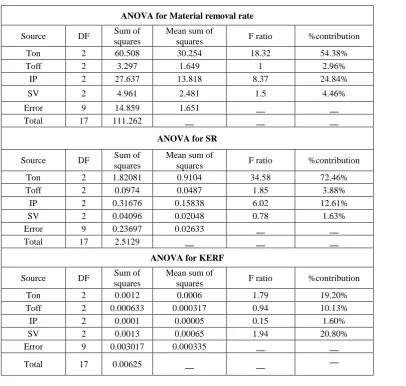
Table 5: Analysis of variance for reaction factor
ANOVA for Material removal rate
Source DF Sum of squares
Mean sum of
squares F ratio %contribution
Ton 2 60.508 30.254 18.32 54.38%
Toff 2 3.297 1.649 1 2.96%
IP 2 27.637 13.818 8.37 24.84%
SV 2 4.961 2.481 1.5 4.46%
Error 9 14.859 1.651 __ __
Total 17 111.262 __ __ __
ANOVA for SR
Source DF Sum of squares
Mean sum of
squares F ratio %contribution
Ton 2 1.82081 0.9104 34.58 72.46%
Toff 2 0.0974 0.0487 1.85 3.88%
IP 2 0.31676 0.15838 6.02 12.61%
SV 2 0.04096 0.02048 0.78 1.63%
Error 9 0.23697 0.02633 __ __
Total 17 2.5129 __ __ __
ANOVA for KERF
Source DF Sum of squares
Mean sum of
squares F ratio %contribution
Ton 2 0.0012 0.0006 1.79 19.20%
Toff 2 0.000633 0.000317 0.94 10.13%
IP 2 0.0001 0.00005 0.15 1.60%
SV 2 0.0013 0.00065 1.94 20.80%
Error 9 0.003017 0.000335 __ __
Material using Design of Experiments
Table 6: the signal-to-noise ratio values for the test resultsExp. no Ton Toff IP SV S/N Ratio, MRR S/N Ratio, SR S/N Ratio, KERF
1 1 1 1 1 1.9479 -1.0445 4.583
2 1 2 2 2 2.0938 -3.6686 4.437
3 1 3 3 3 13.91 -5.2701 4.1522
4 2 1 1 2 10.7157 -4.7776 3.7417
5 2 2 2 3 4.5073 -4.9322 4.0132
6 2 3 3 1 10.5268 -5.904 4.437
7 3 1 2 1 16.7675 -7.1798 3.8764
8 3 2 3 2 18.0816 -7.5881 4.0132
9 3 3 1 3 10.3546 -6.1784 4.437
10 1 1 3 3 9.2284 -2.4115 4.1522
11 1 2 1 1 1.9162 -3.7754 4.2934
12 1 3 2 2 4.0613 -4.8608 4.2934
13 2 1 2 3 8.5191 -4.437 4.437
14 2 2 3 1 12.5386 -5.2226 4.437
15 2 3 1 2 3.7154 -3.3135 4.0132
16 3 1 3 2 18.4857 -7.499 3.6091
17 3 2 1 3 9.2382 -6.1594 4.1522
[image:8.595.308.530.352.504.2]18 3 3 2 1 18.7704 -8.0471 4.1522
[image:8.595.42.265.358.721.2]Table 7: Grey relational coefficients and GRG
Fig. 6 Stepwise strategy of Gray Rational Analysis Scatter Plot of GRG vs Exp no
Fig. 7 GRG for maximizing material removal rate, minimizing SR and minimizing kerf width
Exp.no GRC,
MRR GRC,
SR
GRC, KERF
Grey relational
grade
Rank
1 0.334 1 1 0.778 1
2 0.336 0.572 0.769 0.559 7
3 0.634 0.453 0.531 0.539 12
4 0.511 0.484 0.367 0.454 17
5 0.371 0.474 0.461 0.435 18
6 0.506 0.419 0.769 0.565 8
7 0.808 0.363 0.408 0.526 13
8 0.924 0.349 0.461 0.578 6
9 0.5 0.405 0.769 0.558 9
10 0.469 0.719 0.531 0.573 3
11 0.333 0.562 0.627 0.507 14
12 0.364 0.478 0.627 0.49 15
13 0.451 0.508 0.769 0.576 5
14 0.575 0.456 0.769 0.6 4
15 0.359 0.607 0.461 0.475 16
16 0.967 0.352 0.333 0.551 10
17 0.469 0.406 0.531 0.469 11
[image:8.595.318.468.559.672.2]International Journal of Innovative Technology and Exploring Engineering (IJITEE) ISSN: 2278-3075,Volume-8 Issue-11, September 2019
Fig. 8 the main effects of GRG
[image:9.595.300.530.49.189.2]Fig. 9 Response chart of mean grey relational grade Table 9: ANOVA for GRG
Table 8: Responsible table for GRG
Factors Level-1 Level-2 Level-3 Max-Min
Ton 0.574 0.518 0.551 0.056
T off 0.576 0.525 0.541 0.051
Ip 0.54 0.535 0.568 0.033
Sv 0.6 0.518 0.525 0.082
Facto
r DF
Sum of squares
Mean sum of squares
F rati
o
%contributio n
Ton 2
0.00976 6
0.00488
3 0.78 9.54%
Toff 2
0.00832
5 0.04163 0.67 8.13%
IP 2
0.00371 9
0.00185
9 0.3 3.63%
SV 2
0.02457 4
0.01228
7 1.97 24.08%
Error 9
0.05600 8
0.00622
3 ----
----Total 17
0.10239
3 --- --- ----
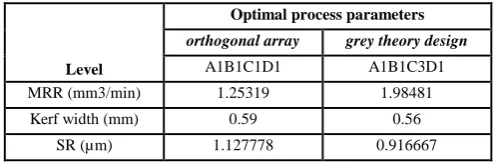
VI.CONFIRMATION TESTS
The confirmation test was performed for the optimal process parameter setting with its chosen levels to determine the quality characteristics for Wire cut EDM of Titanium grade-5 material. Experiment 1 (Table 7) represents the largest grey relational grade, specifying that the optimal process parameter set of A1B1C3D1 has the best multiple performance characteristics of the output responses among the 18 experiments, for the validation of results which can be compared with the confirmation experiment results. Tables 9 and 10 represent the comparison of the experimental results applying the orthogonal array (A1B1C1D1) and optimal grey theory design (A1B1C3D1) Wire cut EDM parameters on the Titanium grade-5 material. The response values achieved from the confirmation experiment are MRR = 1.984810 mm3/min, SR = 0.916667 µs, and kerf width = 0.56 mm. The MRR demonstrates an expanded value of 1.25319 to 1.984810 mm3/min, the SR demonstrates a decreased value of 1.127778 to 0.916667 µs, and the kerf width demonstrates a decreased value of 0.59 to 0.56 mm. The comparing development in MRR is increased by 58.38% and both surface roughness and kerf width were decreased by 23.03% and 5.08% respectively.
VII. IMPROVEMENTS OF MATHEMATICAL
MODELS
The results of experiments are utilized to achieve the mathematical connection between input procedure parameters and machining output responses. The method of multiple regressions was used to calculate the coefficients of mathematical models. In this work, Minitab 17 has been utilized for the analysis of regression. The general linear models (user-defined) were tested using Minitab 17 software.
The regression equation of MRR is
MRR = 3.795 - 1.592 Ton_1 - 0.977 Ton_2 + 2.568 Ton_3 + 0.461 Toff_1 - 0.570 Toff_2 + 0.109 Toff_3 - 1.519 Ip_1 + 0.003 Ip_2 + 1.516 Ip_3 + 0.483 SV_1 + 0.247 SV_2 - 0.730 SV_3
S= 1.28491 R-Sq = 86.65% R-sq (adj) = 74.77%
The regression equation of SR is
SR = 1.8431- 0.3260 Ton_1 - 0.1053 Ton_2 + 0.4314 Ton_3 - 0.0923 Toff_1+ 0.0047 Toff_2+ 0.0877 Toff_3- 0.1866 Ip _1+ 0.0765 Ip_2+ 0.1101 Ip_3+ 0.0371 SV_1+ 0.0302 SV_ 2- 0.0673 SV_3
S= 0.162264 R-Sq = 90.57% R-sq (adj) = 82.19% The regression equation of the kerf width is
Kerf width = 0.61833 - 0.01000 Ton_1 - 0.00000 Ton_2 + 0.01000 Ton_3+ 0.00833 Toff_1- 0.00333 Toff_2- 0.0050 0 Toff_3- 0.00167 Ip_1- 0.00167 Ip_2+ 0.00333 Ip_3- 0.00 833 SV_1 + 0.01167 SV_2 - 0.00333 SV_3
S= 0.0183081 R-sq = 51.73% R-sq (adj) = 8.83%
VIII. CONLUSIONS
In this present work, an endeavor was made to calculate the significant machining parameters for performance measures of output responses such as material removal rate (MRR), surface roughness (SR), and kerf width separately in wire cut electrical discharge machining. The corresponding factors like a pulse on time, pulse off time, peak current, and servo voltage have been identified to
[image:9.595.303.533.216.396.2]Material using Design of Experiments
maximizing of material removal rate, and minimization ofboth surface roughness and kerf width respectively. Taguchi's experimental design approach is applied to achieve the optimal parameters combination for maximize the MRR, minimize the SR, and minimize the kerf width. Increasingly, the optimal factor levels for all the goals differ extensively. To upgrade for all the three destinations, the GRA was proposed as an approach for optimizing the difficult interrelationships among multiple performance characteristics of output responses. . Therefore, this approach extremely clarifies the optimization of difficult multiple performance characteristics, and hence, it does not include difficult mathematical calculations, in the manufacturing world, this can be effectively used by the stakeholders.
1.
The optimal "process parameters" based on grey relational analysis for the Wire cut EDM of Titanium grade-5 material include like a pulse on time of 100µs, pulse off time of 50µs, the peak current of 12 Amps, and servo voltage of 10 Volts respectively.2.
While using the grey-Taguchi approach, the MRR demonstrates an expanded value of 1.25319 to 1.984810 mm3/min, the SR demonstrates a decreased value of 1.127778 to 0.916667 µs, and the kerf width demonstrates a decreased value of 0.59 to 0.56 mm, which are the positive pointers of the productivity. Hence, it tends to be reasoned that the grey-Taguchi approach is more optimal and applicable parametric development of wire cut electrical discharge machining process when applying multiple performance characteristics of output responses like material removal rate, surface roughness, and kerf width for machining the Titanium grade-5 material.3. Mathematical relations between the machining parameters such as Ton, Toff, IP, and SV and performance characteristics of the output responses such as MRR, SR, and kerf width are set up by regression analysis approach. The established mathematical models were applied in assessing the MRR, SR, and kerf width without performing the trials.
[image:10.595.39.288.594.676.2]
Table 10: Optimization results of the orthogonal array L18 vs grey theory design
Optimal process parameters
orthogonal array grey theory design
Level A1B1C1D1 A1B1C3D1
MRR (mm3/min) 1.25319 1.98481 Kerf width (mm) 0.59 0.56
SR (µm) 1.127778 0.916667
REFERENCES
1. Saravanan Ma, Vinoth Kumar A Mb and Nirmal Kannan Vc and Stephan Thangaiah I Sd, “Optimization of process parameters during wire electrical discharge machining of Ti Gr 2 for improving corner accuracy” Materials Today: Proceedings 4 (2017) 2105–2113, 5th International Conference of Materials Processing and Characterization (ICMPC 2016),
2. P.Sneha ,A.Mahamani, Ismail.Kakaravada, “Optimization of Wire Electric Discharge Machining Parameters in Machining of Ti-6Al-4V Alloy” a,b Department of Mechanical Engineering,, Sri Venkateswara College of Engineering & Technology (Autonomous), Chittoor-517127. India cResearch scholr, Sri Venkateswara College of Engineering & Technology Centre, JNTU, Anatapuramu-515001, India Materials Today: Proceedings 5 (2018) 6722–6727
3. Siva Prasad Arikatla, K.Tamil Mannan, Arkanti Krishnaiah “ Parametric Optimization in Wire Electrical Discharge Machining of Titanium Alloy Using Response Surface Methodology” Materials Today: Proceedings 4 (2017) 1434–1441, 5th International Conference of Materials Processing and Characterization (ICMPC 2016) 4. Dwaipayan De1, Titas Nandi2, Asish Bandyopadhyay3,” Analysis
of Machining Parameters for Wire Cut Electrical Discharge Machining of Pure Titanium Using Response Surface Methodology” Materials Today: Proceedings 5 (2018) 5374–5383, ICMPC 2017
5. J.B. Saedon, Norkamal Jaafar, Mohd Azman Yahaya NorHayati Saad and Mohd Shahir Kasim, “Multi-objective optimization of titanium alloy through orthogonal array and grey relational analysis in WEDM” Procedia Technology 15 (2014) 832 – 840, 2nd International Conference on System-Integrated Intelligence: Challenges for Product and Production Engineering, aFaculty of Mechanical Engineering, Universiti Teknologi MARA, Malaysia.
6. A.V.S. Ram Prasad, Koona. Ramji, G.L.Datta, “An Experimental Study of Wire EDM on Ti-6Al-4V Alloy” Procedia Materials Science 5 (2014) 2567-2576, International Conference on Advance in Manufacturing and Materials Engineering, AMME2014
7. Prathik Jain S, Ravindra H V, Ugrasen G, Naveen Prakash G V, Y S Rammohan,” Study of Surface Roughness and AE Signals while Machining Titanium Grade-2 Material using ANN in WEDM” Materials Today: Proceedings 4 (2017) 9557–9560, ICEMS 2016 8. Binoy Kumar Baroi, Siddhartha Kar, Promod Kumar Patowari,