International Journal of Innovative Technology and Exploring Engineering (IJITEE) ISSN: 2278-3075, Volume-8 Issue-10, August 2019
Abstract: The electrical activity which might be acquired by inserting the probes on the body exterior that is originated within the individual muscle cells of the heart and is summed to indicate an indication wave form referred to as the EKG (ECG). Cardiac Arrhythmia is an associate anomaly within the heart which may be diagnosed with the usage of signals generated by Electrocardiogram (ECG). For the classification of ECG signals a software application model was developed and has been investigated with the usage of the MIT-BIH database. The version is based on some existing algorithms from literature, entails the extraction of a few temporal features of an ECG signal and simulating it with a trained FFNN. The software version may be employed for the detection of coronary heart illnesses in patients. The neural network’s structure and weights are optimized using Particle Swarm Optimization (PSO). The FFNN trained with set of rules by PSO increase its accuracy. The overall accuracy and sensitivity of the algorithm is about 93.687 % and 92%.
Index Terms: Baseline wander, Electrocardiogram, Feature extraction,FFNN,PSO
I. INTRODUCTION
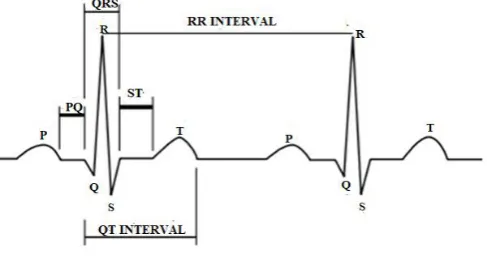
The electrical activity which might be acquired by inserting the probes on the body exterior that is originated within the individual muscle cells of the heart and is summed to indicate an indication wave form referred to as the EKG (ECG). Throughout every cycle the potential varies in complex way. Thus it becomes essential to choose a reference electrode for acquisition of the signal. The wave form is classed into the P-wave, indicating chamber contraction, the QRS representing ventricular contraction and ventricular repolarisation represents T-wave .the traditional cardiogram signal with varied intervals is shown in Fig. 1.A lot of issues in medicine engineering are solved by the appliance of soft computing. The analysis can be done using single or multi lead, where the single lead measurements are the most simple, and reliable in case of wearable and ambulatory ECG. The standard 12 leads records the signals of the heart from different deviations which contains various information. It becomes more difficult for analysis if the leads contain noise [1] but the information can be retrieved from other leads [2]. In this work single lead (V5 or MLII) are used which is collected from MIT-BIH data base. It is proposed for analysis of ECG signals. In this work a Feed
Revised Manuscript Received on August 12, 2019.
Shalini Sahay, Research scholar, RGPV Bhopal,India A.K.Wadhwani, EE Department ,MITS,Gwalior,India
Sulochana Wadhwani , EE Department ,MITS,Gwalior,India Sarita S. Bhadauria ,EC Department, MITS,Gwalior,India
Forward Neural Network (FFNN) is used as a classifier, whose internal parameters are
[image:1.595.305.549.323.453.2]optimized used PSO (Particle Swarm Optimization) rule. The input to the FFNN could be a group of temporal components extracted from recorded signals. These parameters are optimized by PSO rule which may overwhelm the variation of record signals. It shows that the trained FFNN contains a distinctive structure for every subject. The performance analysis of the network based on the MIT-BIH cardiac arrhythmia database shows high classification accuracy and sensitivity.
Fig. 1: The Normal ECG waveform
II. LITERATURE SURVEY
Since previous few years cardiogram signal process becomes a spirited analysis within the field of medical specialty in signal processing. A number of these researches have enriched our information for applying algorithms for process of cardiogram signal. The information reveals the electrical functioning of the heart, can be advanced by altering the morphology of its additives, specifically as P, QRS, and T waves. A methodical analysis of biometric recognition system based on ECG was developed by Yongjin Wang, Foteini Agrafioti, Dimitrios Hatzinakos, and Konstantinos N. Plataniotis et al. [3]. It's a primarily dependent function of extraction approach which utilizes an aggregate of temporal and amplitude features for the very first time. It makes use of 11 nearby points for classification. So it becomes very precise towards detection of fiducial detection. Shahanaz Ayub et al. [4] making the efforts for the analysis of fusion beats using Artificial Neural Networks so that the patient could be diagnosed in less time and with high accuracy.
Detection and Classification of ECG Signal
through Machine learning
They used MATLAB based Feed Forward Neural Network, with the standard MIT – BIH arrhythmia database. Biel et al. [5] that developed the set of temporal and amplitude features acquired from SIEMENS ECG equipment. The major drawback of approach was the lack of computerized recognition because of the employment of unique device for function extraction which limits the advantages. Irvine et al. [6] has modified the machine to make use of heart rate variability (HRV) for human identification. Israel et al. [7] has developed a set of descriptors to represent ECG graph; pre-processing is done by using a bandpass filter then maxima are determined through finding the neighbourhood complexes, and minimal radius curvature is used to acquire the beginning and detection of P and T waves. Hasan & mamun, et al. [8] has analysed the three essential components the sign of every heartbeat are: P wave, QRS, and T wave. Tran et al. [9], Tsipouras et al. [10], has concluded that every events its own height, morphology, amplitude, and duration for detection of cardiac arrhythmia. Their analysis determined to be important for detecting respiration disorders together with obstructive sleep apnea syndrome and for looking at the autonomic regulation of the high blood pressure occurs in hypertension and sleep. J. I. Willams et al. [11] has evolved the numerical analysis independently by group of cardiologists & AHA.
The ECG signal processing is verified mainly through single lead or the usage of the ECG which do no longer observe any widespread database. The diagnostic accuracy of e programs are accomplishing to a height, however it' is still be viable to monitor recent developments. A possibility always exists so that work can be more advantageous and changes are required for the improvements. The use of new approach primarily based on device learning and nature inspired techniques may be carried out for higher consequences. An artificial neural network represents a subdivision of soft computing which is meticulously affiliated to it. Machine learning is the revolution in an adaptive mechanism to utilize intelligent behaviour in critical situations. Artificial neural networks are developed by mapping the brain function acts as the strongest means of diagnosing the disease automatically. Pioneering work of neural network has started since 1943 by McCulloch and Pitts. Pattern recognition problem was introduced by Rosenblatt (1958).A Neural Network is a collection of techniques that can be utilized to simulate the human brain. It is a set of layers consisting input, output, and many hidden layers. Each level is an assembly of nerve cells. Each neuron (nerve cell) has some credence; this is varied with respect to the training. The output of each layer forms an input to every neuron in the succeeding layer. It is implemented by modifying its structure and internal configuration as per the variation in ECG signals. For implementing the neural network, optimization of the structure and its weights, must be considered first and is hardware implementation. The backpropagation learning algorithm trained the multilayer perceptron (MLP) structure. The Evolutionary computation follows the behaviour of biogenetics, acts as problem solver which includes optimization and multilevel optimization. The evolutionary
[12]. Whereas the weights of structure are also optimized by computational techniques based on evolutional techniques .
III. DATA BASE
MIT-BIH Arrhythmia Database, is available on-line is used as a data-set. The recordings were obtained by the Beth Israel Hospital Arrhythmia Laboratory between 1975 and 1979; approximately 60% of the recordings were obtained from patients. The 10 records (numbered from 100 to 110) were chosen from the same set. By placing the electrodes on the chest, we can obtain limb lead II (MLII) that is the upper signal in most of the records. A modified lead V1 is usually the lower signal; the recordings were digitized at 360 samples per second per channel with 11-bit resolution over a 10 mV range.
IV. PROPOSED METHODOLOGY
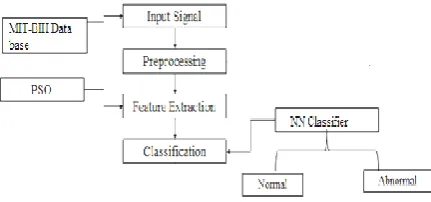
[image:2.595.310.526.530.631.2]We have proposed a feed forward Neural Network as a classifier based on Particle Swarm Optimization (PSO) for optimizing the weights of neural network. The PSO algorithm is established on birds flocking behaviour moving for finding food, as an optimal solution and food resources shows best solutions. . All members on this set of rules can have parameters; position and velocity which may be modified with random numbers. The cluster of solutions is named as particles. Each particle deploys its position and pace till they get an optimal answer, and additionally continue to be in touch with everyone. They alternate their positions according to every particle itself that is known as locally best and population best leads to globally best to locate a foremost solution. We have makes use of MIT-BIH arrhythmia database. The extracted temporal features from input signals forms the input vector of the classifier, that may reduce the changes of ECG signals not dependent on persons and time variations. The trained NN has a distinctive architecture for anyone.Fig.2 displays the Flow Diagram of the proposed work.
Fig. 2: Flow Diagram of the proposed work A. Pre-processing
International Journal of Innovative Technology and Exploring Engineering (IJITEE) ISSN: 2278-3075, Volume-8 Issue-10, August 2019
ECG record contains very high level of noise that distort the main aspects of the ECG signal. Power line interference is due to improper grounding of ECG equipment and interference from nearby equipment and usually removed using notch filter. Base line drift is a low-frequency (0.15 up to 0.3 Hz) noise. This is due to breathing of patient and causes to baseline shifting of ECG signals .Butterworth filter is used for removing noise.Fig.3shows the raw ECG signal.Fig.4 shows signal after power-line noise cancellation of record 100 and Fig.5: shows signal After base line drift cancellation of record 100.
Fig.3: The input signal of record 100
Fig.4: After power-line noise cancellation of record 100
Fig.5: After base line drift cancellation of record 100
B. Feature Extractions
A set of features are to be separated from the denoised ECG signal.
C. Detection of R-R Peaks
The high frequency content of the QRS region [5-15 Hz] the derivative of these regions of ECG has higher amplitudes. The sampling rate of digital ECG data remains constant the amplitude differences are proportional to the derivatives which can be utilized to detect the QRS regions. The positive peaks of the QRS regions are the R peaks. Fig 6 shows the R-R peaks.
Fig.6: R-R peaks of ECG signal of record 100
Pan Tompkins Algorithm
The most popularly algorithm for the extraction of QRS complexes is proposed by Pan Tompkins algorithm [13] is.Fig.6 show the block diagram of Pan Tompkins Algorithm. It measured slope, amplitude, and width of the signal using digital bandpass filter and can eliminate the false detection due to various interferences. The algorithm adjusts automatically the thresholds and parameters and adapts the changes in QRS morphology and heart rate.
Fig.6: Block diagram of Pan Tompkins Algorithm
The ECG signal is passed by a Band Pass filter which is a cascaded form of low-pass and a high-pass filter. The output of filter is noise free is passed through various stages. At last, after thresholding the QRS complex are detected. The various stages are discussed below:
Band Pass filter: Baseline Wander Noise is reduced by LPF and then passed through high Pass filter to eliminate power line interference. It uses Dirac form II.The maximum QRS energy is in pass band is 5 Hz-35 Hz range. The difference equation for filter is represented by following equation:
Low -pass filter:
y(n) = 2y(n-1)- y(n- 2)- x(n)- 2x(n- 6)- x(n-12) (1)
High-pass filter:
y(n) =y(n-1) 1/32(x(n))-x(n-16)-x(n-17)+1/32(x(n-32))
(2)
● Derivation or Differentiator: The filtered ECG signal is then differentiated to give the slope. The information is accentuating QRS complexes relative to P and T wave. The differentiator also removes baseline wandering and extracts the high QRS complex. The data is differentiated and slope is detected using the following formula:
y( n )=⅛*[2x(n )+ x( n-1)-x(n-3)-2x(n-4)] (3)
●
Squaring: The output of the differentiation is squared the higher frequency and blocks the lower frequency component, which suppress the P and Tsamples.Fig:4.8 show the ECG signal after passing through the squaring operator. It converts all data
point as positive at higher frequencies.
y (n)= [x (n)]2 (4)
● Integrator: The output of squarer is passed into the moving average filter (MAF) producing a smooth waveform. It gives the addition of the area for a desirable interval, then moves to the next, and goes on integrating the known window. The filter extracts features like slope of the R wave. It is described by the following difference equation:
y (nT) =1/N[x(nT) -(N-1)T) +……… +x(nT)] (5)
Where, N=1+2M shows the samples numbers. M is half-width of filter.Fig.7 represents the ECG signal after passing from the various stages of the algorithm.
Fig.7: QRS detection algorithm steps for MIT/BIH database of record #100 (a) raw signals. (b) Output of bandpass filter. (c) Output of differentiator. (d) Output of squarer e) output of
moving-window integration.
E. Detection of QRS Duration and Heart Rate
The QRS duration and Heart Rate is calculated by using following formula:
Time period = 1/ frequency (6)
QRS duration=mean (z)*(1/fs) (7)
International Journal of Innovative Technology and Exploring Engineering (IJITEE) ISSN: 2278-3075, Volume-8 Issue-10, August 2019
F. Detection of Heart disease based on Heart Rate
ECG information may be used as a diagnostic device to forecast the abnormalities in heart and also identifies the damage in the tissues. The abnormality in the QRS complex indicates malfunctioning of ventricles. At regular situation the T wave is positive amplitude but sometimes it may be inverted with abnormal amplitude. Some of heart disease can be diagnosis with the help of algorithm.
i )Bradycardia
It describes the heart beats more slow than normal where normal Heart Rate is 60-100 beats per minute. It occurs in athletes and during sleep relaxation the body requires less oxygen consumption. Sometime it also causes due to of any heart disease or reaction to any medicine.
ii) Tachycardia
[image:5.595.299.526.49.177.2]The extreme heart rate that is 100 beats per minute (BPM) which is created by SA node, results in sinus Tachycardia. Main causes due to shock, tension, sickness and workout. Thus is mandatory to find P for each QRS. Table 1 shows the QRS duration and Heart Rate detected by Pan Tompkins Algorithm for some cases.
Table 1 The QRS duration and Heart Rate detected by Pan Tompkins Algorithm
ECG signal QRS duration
(sec)
Heart Rate
(beats/min)
According to
Pan Tompkins
Algorithm
100 0.14444 75.0105 Healthy
101 0.099028 488.2946 Tachycardia
102 0.22454 73.032 Healthy
103 0.15303 70.1581 Healthy
104 0.22457 74.408 Healthy
105 0.15549 84.4181 Healthy
112 0.14879 85.548 Healthy
113 0.1679 56.2366 Bradycardia
200 0.14511 99.3301 Healthy
201 0.14510 86.0802 Healthy
202 0.16111 53.39 Bradycardia
203 0.13538 124.833 Tachycardia
205 0.14484 89.8877 Healthy
207 0.17944 67.5206 Healthy
208 0.16059 100.1973 Healthy
209 0.14444 94.5779 Healthy
231 0.16806 62.6185 Healthy
233 0.14134 107.0787 Tachycardia
234 0.13403 90.9181 Healthy
V. FEED FORWARD NEURAL NETWORKS
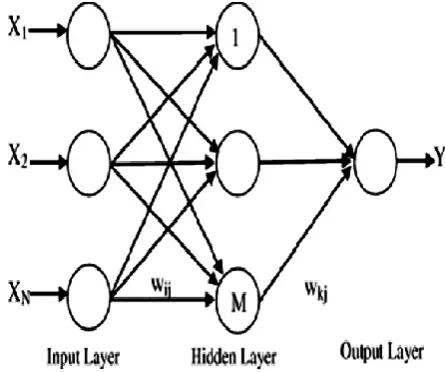
[image:5.595.313.536.287.473.2]It is most efficient structures amongst the artificial neural networks .Fig.8 represent the general structure of a FFNN [15]. This neural network has the following features: the perceptron’s of the network will be generally organized in layers, with the first layer receiving the inputs and the final layer generating the outputs. The hidden layer consists of hidden neuron lies in-between input and the output layer.
Fig.8 The structure of Feed Forward Neural Network
The Feed forward neural network works in the phases described below:
●Learning Phase
●Classification Phase
VI. PSO ALGORITHM
In this study PSO algorithm has been used for training the network and also finding the optimized solution for ECG signals classification problem [14]. Each solution for this problem is considered as a particle. Particles in this algorithm follow two laws: Data exchanging law and movement law. Each particle should know the position of optimal particle and can go towards that particle. According to the data exchanging law, each particle can be informed about the optimal particle and knows how much and in which direction should move to reach to the optimal particle. According to the movement law, each particle changes its position towards the optimal particle. These two laws are known as velocity and position operators. The various steps of algorithm in PSO are as
1. Set the values of wmin, wmax, c1 and c2.
2. Initialize the population having positions X and velocities V
3. Now start with iteration k = 1
4. Set the fitness of particles = f ( , ∀i and calculate the index of the best particle b
5. Choose = , ∀i and Gbestk =
6. Calculate W = wmax − k × (wmax − wmin)/Maxite 7. Now update the velocity and position
8. Find fitness = f ( ), ∀i and find the index of the best particle b1
9. Now change the Pbest of population ∀i
If < then = if else =
VII. PROPOSED ARTIFICIAL NEURAL NETWORKS TRAINING APPROACH USING PARTICLE SWARM OPTIMIZATION
The following steps are used to train ANN using PSO 1) Collect the ECG features as input.
2) Generate the network. 3) Now configure the network.
4) Initialize the weights and biases of the network. 5) Now train the network using PSO.
6) Simulate or validate the network.
7) Now the network is ready for testing data.
VII. RESULTS
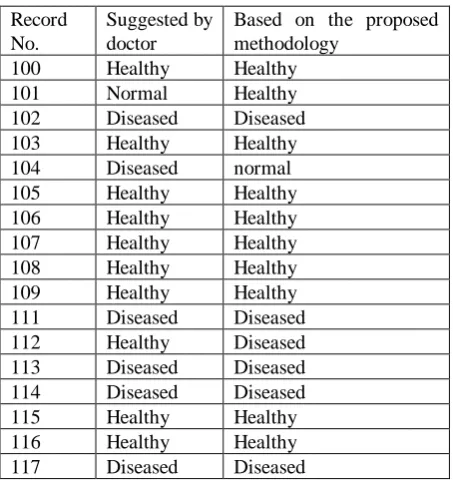
[image:6.595.61.288.551.793.2]The MIT BIH database is considered, 28 records were taken for training and 20 are assumed as testing data. The results were given to doctor for validation and concluded in the table 3. The 1000 iteration were done. The error was found to be 0.0211. The result reveals that out of 48 cases 45 cases are correctly identified. It is observed that 93% of the total records are accurately analysed. The output of the network classifies the cases as normal and abnormal subjects.
Table 3Results of the proposed work
Record No.
Suggested by doctor
Based on the proposed methodology
100 Healthy Healthy
101 Normal Healthy
102 Diseased Diseased
103 Healthy Healthy
104 Diseased normal
105 Healthy Healthy
106 Healthy Healthy
107 Healthy Healthy
108 Healthy Healthy
109 Healthy Healthy
111 Diseased Diseased
112 Healthy Diseased
113 Diseased Diseased
114 Diseased Diseased
118 Diseased Diseased
119 Diseased Diseased
121 Diseased Diseased
122 Healthy Healthy
123 Healthy Healthy
124 Healthy Healthy
200 Diseased Diseased
201 Healthy Healthy
202 Healthy Healthy
203 Diseased Diseased
205 Healthy Healthy
207 Diseased Diseased
208 Diseased Diseased
209 Healthy Healthy
210 Diseased Diseased
212 Diseased Diseased
213 Diseased Diseased
214 Diseased Diseased
215 Healthy Healthy
217 Diseased Healthy Normal
219 Healthy Healthy
220 Healthy Healthy
221 Healthy Healthy
222 Diseased Diseased
223 Healthy Healthy
228 Diseased Diseased
230 Healthy Healthy
231 Healthy Healthy
232 Healthy Healthy
233 Healthy Healthy
234 Diseased Diseased
VIII. CONCLUSION
For the classification of ECG signals a software application model was developed and has been investigated with the usage of the MIT-BIH database. The algorithm is based on the extraction of a few temporal features of an ECG signal and simulating it with a trained FFNN. The neural network’s structure and weights are optimized using particle swarm optimization (PSO). The FFNN trained with set of rules by PSO increase its accuracy. Pan Tompkins algorithm is used to detect QRS duration and heart rate. The overall accuracy and sensitivity of the algorithm is about 93.687 % and 92%.
FUTURE SCOPE
International Journal of Innovative Technology and Exploring Engineering (IJITEE) ISSN: 2278-3075, Volume-8 Issue-10, August 2019
In future, the neural network based some other classification schemes will focus with effectual swarm intelligence algorithms are in progress for implementation .The signal decomposition and feature extraction can be implemented using adaptive multiwavelet transform technique to improve the performance. More advance software techniques can be used for further enhancement.
REFERENCES
1. S. Chaudhuri, T. D. Pawar, and S. Duttagupta, “Review of ECG Analysis.” Springer, 2009
2. B. Acar and H. Koymen, “SVD-Based On-Line Exercise ECG Signal Othogonalization ,” IEEE Trans Biomed Eng, vol. 46, no. 3, pp. 311–321, 1999.
3. Yongjin Wang,Foteini Agrafioti, Dimitrios Hatzinakos, and Konstantinos N.Plataniotis, “Analysis of Human Electrocardiogram for Biometric Recognition,” Hindawi Publishing Corporation EURASIP Journal on Advances in Signal Processing Volume 2008, Article ID 148658,dol:10.1155/2008/148658 2007.
4. Shahnaz Ayub, J.P.Saini: “Fusion Beats Extraction from ECG Using Neural Networks based Soft Computing Techniques”, Advances in Applied Science Research, 2010, I(2) 76 – 83.
5. L. Biel, O. Pettersson, L. Philipson, and P. Wide, “ECG analysis: a new approach in human identification,” IEEE Transactions on Instrumentation and Measurement, vol. 50, no. 3, pp. 808– 812, 2001 6. J. M. Irvine, B. K. Wiederhold, L. W. Gavshon, et al., “Heart rate variability: a new biometric for human identification,” in Proceedings of the International Conference on Artificial Intelligence (IC-AI ’01), pp. 1106–1111, Las Vegas, Nev, USA, June 2001.
7. Hasan, M.A., & Mamun, M.D. (2012) “ Hardware approach of R-peak detection for the measurement of fetal and maternal heart rates,” Journal of Applied Research and Technology, 10, 835-844. 8. Tran, T., McNames, J., Aboy, M., & Goldstein, B. (2004) “ Prediction
of paroxysmal atrial fibrillation by analysis of atrial premature complexes,” IEEE Trans Biomed Eng., 51, 561-569.
9. Tsipouras, M.G., Fotiadis, D.I., & Sideris, D. (2002)“Arrhythmia classification using the R-R- interval duration signal,” IEEE Computers in Cardiology, 2002, 485-488.
10. J.I.Willems and CSE working party, “Recommendations for measurement standards in quantitative ECG,” European Heart Journal 1985)6,815-825.
11. 11. Shahnaz Ayub, J.P.Saini: “Fusion Beats Extraction from ECG Using Neural Networks based Soft Computing Techniques”, Advances in Applied Science Research, 2010, I(2) 76 – 83.
12. W. Jiang, S.G. Kong, “Block-based neural networks for personalized ECG signal classification,” IEEE Trans. Neural Netw. 18 (6) (2007) 1750–1761E. H. Miller, “A note on reflector arrays (Periodical style—Accepted for publication),” IEEE Trans. Antennas Propagat., to be published
13. Balambigai Subramanian, “ECG signal classification and parameter estimation using multiwavelet transform,” Biomedical Research 2017; 28 (7): 3187-3193
14. M. Clerc, “The swarm and the queen: towards a determininistic and adap-tive particle swarm optimization,” in: Congress on Evolutionary Computation(CEC99), 1999, pp. 1951–1957.[28] J.A. Swets, Measuring the accuracy.
15. Ebrahimi A, Addeh J,(2015), “Classification of ECG Arrhythmias Using Adaptive Neuro-Fuzzy Inference System and Cuckoo Optimization Algorithm,” CRPASE, ISSN 2423-4591,Vol. 01, Issue No.04,pp.134-140, November 2015
AUTHORS PROFILE
Shalini Sahay pursuing PHD from RGPV Bhopal.she has done B.E, in Electronics from Nagpur university in 1996 and M.E from M.I.T.S in 2006, lifetime member of IETE.
Dr.A. K. WADHWANI
Professor, EE Deptt. M.I.T.S,Ph.D. IIT Roorkee Area of Interest: Application of Soft Computing Techniques in Biomedical signals. A.K. Wadhwani's 37 research works with 303 citations and 2721 reads.member
of The Indian Society for Technical Education(ISTE)-Life Member (LM8485) , The Institution of Electronics & Telecommunication Engineers(IETE) ,) The Institution of Engineers (India): Fellow:F-113986-6
Dr.SULOCHANA WADHWANI
Professor, EE Deptt. M.I.T.S Ph.D. IIT Roorkee She received bachelor degree in Electrical Engineering M. E. degree in control system from GEC Jabalpur in 1991and 1993 respectively. Currently, she is faculty in the Department of Electrical Engineering, Madhav Institute of Technology and Science, Gwalior, India. Her research interests are in the area of application of artificial intelligence for condition monitoring of industrial drives. She has received many awards including best paper award from Institution of Engineers.
Dr. SARITA SINGH BHADAURIA