https://doi.org/10.5194/angeo-36-1347-2018 © Author(s) 2018. This work is distributed under the Creative Commons Attribution 4.0 License.
First joint observations of space weather events over Mexico
Victor De la Luz1,2, J. Americo Gonzalez-Esparza2, Maria A. Sergeeva1,2, Pedro Corona-Romero1,2, L Xavier González1,3, Julio C. Mejia-Ambriz1,2, Jose F. Valdés-Galicia3, Ernesto Aguilar-Rodriguez2, Mario Rodriguez-Martinez4, Esmeralda Romero-Hernandez5, Ernesto Andrade2, Pablo Villanueva2, Elizandro Huipe-Domratcheva4, Gerardo Cifuentes2, Esteban Hernandez3, and Christian Monstein6
1CONACyT – Servicio de Clima Espacial Mexico – Laboratorio Nacional de Clima Espacial, SCiESMEX – LANCE, Morelia, Mexico
2Instituto de Geofísica, Unidad Michoacan, Universidad Nacional Autonoma de Mexico, Antigua carretera a Patzcuaro no. 8701 Ex-Hda, San José de la Huerta Morelia, Michoacán, C.P. 58089, Mexico
3Instituto de Geofísica, Universidad Nacional Autónoma de México, Mexico City, Mexico 4Escuela Nacional de Estudios Superiores unidad Morelia, Universidad Nacional
Autónoma de México, Michoacán, Mexico
5Universidad Autónoma de Nuevo León, Facultad de Ciencias Físico-Matemáticas, LANCE, Monterrey, Mexico 6Institute for Astronomy, Institute for Particle Physics and Astrophysics, Zurich, Switzerland
Correspondence:Victor De la Luz ([email protected])
Received: 9 September 2017 – Revised: 15 August 2018 – Accepted: 20 September 2018 – Published: 11 October 2018
Abstract. The Mexican Space Weather Service (SCiES-MEX in Spanish) and National Space Weather Laboratory (LANCE in Spanish) were organized in 2014 and in 2016, respectively, to provide space weather monitoring and alerts, as well as scientific research in Mexico. In this work, we present the results of the first joint observations of two events (22 June and 29 September 2015) with our local network of instruments and their related products. This network in-cludes the MEXART radio telescope (solar flare and radio burst), the Compact Astronomical Low-frequency, Low-cost Instrument for Spectroscopy in Transportable Observatories (CALLISTO) at the MEXART station (solar radio burst), the Mexico City Cosmic Ray Observatory (cosmic ray fluxes), GPS receiver networks (ionospheric disturbances), and the Teoloyucan Geomagnetic Observatory (geomagnetic field). The observations show that we detected significant space weather effects over the Mexican territory: geomagnetic and ionospheric disturbances (22 June 2015), variations in cos-mic ray fluxes, and also radio communications’ interferences (29 September 2015). The effects of these perturbations were registered, for the first time, using space weather products by SCiESMEX: total electron content (TEC) maps, regional ge-omagnetic indexKmex, radio spectrographs of low frequency, and cosmic ray fluxes. These results prove the importance of
monitoring space weather phenomena in the region and the need to strengthening the instrumentation network.
Keywords. Solar physics astrophysics and astronomy (in-struments and techniques)
1 Introduction
Space weather (SW) phenomena influence the performance and reliability of different modern technological systems; see for instance (Buonsanto, 1999) and (De Nardin et al., 2016a). The country has developed a significant infrastructure that is vulnerable to SW events, such as electricity generation and a transportation grid, telecommunications, electronic banking, and long pipelines for gas and oil transportation. The effects of the Carrington geomagnetic storm in 1859 were registered in several locations, indicating that the region is vulnerable to extreme geomagnetic storms (Gonzalez and Cuevas, 2018).
multi-instrument observations of SW phenomena in Mex-ico that can provide reliable statistics for regional SW stud-ies. Mexico is situated at low latitudes (geographic latitudes 14–32◦N, geomagnetic latitudes 23–38◦N). Recent studies prove that the SW effects are far from being fully understood at these latitudes (Cid et al., 2014; Yizengaw et al., 2013; Balch et al., 2004a, b).
The southern half of Mexican territory is located between the northern tropic and the Equator. The Sun’s incident ray path, at maximum elevation, remains throughout the year be-tween 35 and 81◦in the northern region of the country (Ti-juana at 32◦N) and between 53 and 90◦in the southern re-gion (Tapachula at 14◦N). These conditions match countries with similar latitudes such as those in the north of Africa, the Arabian Peninsula, and the south of Asia (including the south of China and India). The Sun’s paths for these lati-tudes increase the exposition time of the solar projection over the ground. Consequently, this raises the probability of ra-dio interferences detected at ground level, produced directly or indirectly by a solar radio burst, solar energetic particles (SEPs), and flares (Lanzerotti, 2007). Models like D-Region Absorption Predictions (D-RAP) by NOAA show this effect (SWPC, 2015d).
Since 2014, Mexico has begun a strategy for SW aware-ness. In 2014, the Mexican Space Weather Service (SCi-ESMEX) was created; in 2016, the National Space Weather Laboratory (LANCE) and the Repository of Space Weather Data (RICE) were established (Gonzalez-Esparza et al., 2017). Some of the ground-based instruments involved in the SW observations in Mexico have been used for more than 50 years (De Nardin et al., 2016a, b, c). Currently, the instru-mental network provides the possibility of measuring local geomagnetic field variations, cosmic ray flux, solar wind pa-rameters using interplanetary scintillation data, solar radio bursts, radio interferences, and GPS signal delays, etc.
The aim of this work is to estimate the impact of SW phe-nomena over Mexico. We based our results on multilateral observations performed by the SCiESMEX instrumental net-work. In this work, we addressed two events registered over Mexico by SCiESMEX in 2015: on 22 June, and on 25– 29 September. The first event was mainly related to a M6.5 solar flare and a geomagnetic storm that caused ionospheric perturbations. The second event was related to a solar radio burst. The paper is organized as follows: Sect. 2 introduces the network of SW instruments in Mexico. Section 3 dis-cusses the results of observations during the two events, and final remarks are given in the Conclusions section.
2 Space weather instrumental network and products
This section describes the ground-based facilities for SW ob-servations in Mexico.
2.1 The Mexican Array Radio Telescope (MEXART)
The Mexican Array Radio Telescope (MEXART) is a tran-sit instrument dedicated to interplanetary scintillation (IPS) observations from compact radio sources (Gonzalez-Esparza et al., 2004). The instrument has 16 fixed latitudinal beams pointing towards different declinations and uses the Earth’s rotation to scan the whole sky. The angular width of the beams along the east–west direction is about 1◦, so a discrete radio source has a transit of about 4 min in the data series and the Sun around 8 min. The basic elements of the radio tele-scope are full wavelength dipoles (λ=2.14 m). The radiote-lescope performs observations at a frequency of 139.65 MHz with a bandwidth of 2 MHz. More details of the instrument can be found in (Mejia-Ambriz et al., 2010).
The telescope allows us to remotely infer some character-istics of solar wind streams crossing along the line of sight of the extragalactic radio sources detected by the instrument. This includes the tracking of large-scale interplanetary per-turbations. The solar wind speeds and interplanetary density fluctuations along the lines of sights are computed with the use of the methods developed by SCiESMEX. When the line of sight of a radio source passes across the solar wind elec-tronic density inhomogeneities, the radio signals are scat-tered, and a diffraction pattern is produced.
To infer some solar wind characteristics (velocity and den-sity fluctuations) from the IPS data, we apply a power spectra analysis to record the transit of the radio source. We employ a theoretical model to obtain a power spectrum of the IPS fluc-tuations. This IPS theoretical spectrum incorporates differ-ent physical parameters, including solar wind speed. We fit the theoretical model to the observed power spectra, obtain-ing the solar wind speed that best matches the observation. The solar wind speed location is assumed at the nearest point of the Sun to the line of sight. The solar wind density fluc-tuations are estimated from the area under the curve of the observed IPS spectrum; this area is equivalent to the scintilla-tion indexm. Further details about the MEXART methodol-ogy can be found in (Mejia-Ambriz et al., 2015). The results of IPS observations are published weekly in the SW reports 1.
2.2 CALLISTO station at the MEXART site
Solar radio bursts are spontaneous emissions of electromag-netic waves at low frequencies in the outer solar atmosphere produced by shock waves close to the corona or in the inter-planetary medium (Nindos et al., 2008). The signal received on Earth is interpreted as an increase of the radio noise that is analyzed continuously by many solar radio spectrum ob-servatories (Iwai et al., 2012). The global e-CALLISTO net-work is among these observatories (Benz et al., 2005).
1Reports can be found on the official web page of
In 2015, a CALLISTO (Compact Astronomical Low-frequency, Low-cost Instrument for Spectroscopy in Trans-portable Observatories) station was installed in the facili-ties of the MEXART radio telescope (CALLISTO-MEXART station). This station forms part of the e-CALLISTO net-work. Up to now, about 100 solar radio events have been de-tected, and their radio noise spectrum at the site has been categorized (Huipe-Domratcheva, 2018). The observations are only performed during daylight hours, with 200 differ-ent channels ranging from 45.7 to 344.7 MHz captured every 15 min with a resolution of 250 ms.
The product related to CALLISTO is the dynamic radio spectrograph; see the example in Sect. 3.2. Its results are published every 15 min on the web pages of RICE and the e-CALLISTO international network.
2.3 Cosmic ray observatory
The Mexico City Cosmic Ray Observatory is equipped with two instruments: a muon telescope and a neutron monitor (NM). The muon telescope detects the hard component (neg-ative and positive muons) produced by the decay of charged pions, which are produced by interactions of the primary cosmic rays with the atmospheric nucleus. It is composed of eight plates of a plastic scintillator; four plates are lo-cated above the NM and four under it. The muons crossing through the scintillators lose energy by ionization and pro-duce fluorescent radiation that travels to a photomultiplier (Alvarez-Castillo and Valdés-Galicia, 2010; Stenkin et al., 2007). The Mexico City NM type is a 6-NM64. The monitor has worked continuously since 1990. Following (Clem and Dorman, 2000), the mean energy response for the Mexico City NM is estimated as 24.5 GV; thus the instrument detects the low energy component of the galactic cosmic rays.
The cosmic ray observatory can detect flux variations caused by solar activity, for example, when a coronal mass ejection (CME) strikes the Earth and produces a sudden re-duction in galactic cosmic ray flux intensity. This kind of event is known as a Forbush decrease (FD) (Forbush, 1938). The cosmic ray intensity may have a drastic decrement up to 20 % in a few hours and the recovery is slow, typically around 7 to 10 days. It is one of the extreme manifestations of a transient modulation of galactic cosmic rays (GCRs). FDs are generally correlated with stream interaction regions, interplanetary shocks, and/or CMEs originated from the Sun (Cane et al., 1996; Cane, 2000; Richardson and Cane, 2011). The FDs are observed by ground-based particle detectors, such as an NM. The phenomenon is produced by the irreg-ularities in the interplanetary magnetic field associated with these large-scale solar wind disturbances that deflect the cos-mic ray flux, causing a reduction in the number of coscos-mic rays detected at ground level (Lockwood, 1971; González et al., 2015). The product developed by SCiESMEX com-putes the cosmic ray flux in real time. The results are in-cluded in the SW weekly report.
2.4 Geomagnetic observatory
The Teoloyucan Geomagnetic Observatory (TEO) is lo-cated near Mexico City (at latitude 19.746◦N and longitude 99.19◦W) and is managed by the Magnetic Service at the Geophysics Institute, UNAM. It performs the measurements of the geomagnetic field components (D, H, and Z) with a local magnetometer. The sampling rate is 5 s integrated by 1 min, and the baseline is continuously calibrated by the Magnetic Service’s work team.
Since 2017, SCiESMEX, in collaboration with the Mag-netic Service, has estimated the local geomagMag-netic field changes with theKmexindex.Kmexis the analog of the Kp in-dex but on a regional scale (3 h measurements of the maxi-mum absolute variations of the horizontal component (H); Corona-Romero et al., 2017). In agreement with the Kp in-dex, the values ofKmex run from 0 to 9, with 0 represent-ing a quiet state and 9 representrepresent-ing a saturated value for the most disturbed states. EachKmex level relates almost loga-rithmically toH deviations from its quiet baseline (Good-man, 2005).
The quiet baseline is calculated by statistically remov-ing the systematic diurnal and monthly variations of H. The algorithm of Kmex calculation obtains values consis-tent with those reported with its planetary counterpart (Kp). At present, for theKmex calculation, we use data from the Teoloyucan magnetic observatory only; consequently, cur-rentlyKmexvalues are only regionally representative of cen-tral Mexico. In the future, we will increase our coverage with several magnetometers in the Mexican territory. This will substantially increase theKmexcoverage as well as our space weather monitoring capabilities. It is important to re-mark thatKmex is under development, and its data sets are not definitive. Further details onKmex calculations can be found in (Corona-Romero et al., 2017) and general K-index calculations in (Mayaud, 1980) and (Menvielle and Berthe-lier, 1991).
2.5 GPS receiver stations
Figure 1.Two solar transits detected by MEXART at 139.65 MHz. Electromagnetic flux measurements on 22 June 2015, during the occurrence of a solar flare (blue curve) and regular quiet solar transit (green curve).
be constructed in quasi-real time. For the detailed method description and its benefits, readers are referred to Araujo-Pradere et al. (2007) and Minter et al. (2007). In addition, the TayAbsTEC method is also used for TEC calculations. Its advantage is that the receiver coordinates (specifics of the region) are taken into account. Detailed description and bene-fits can be found in (Yasyukevich et al., 2015) and (Sergeeva et al., 2017). Both methods proved to provide satisfactory results for TEC estimation in the region; see the references cited above.
The near-real-time TEC maps over Mexico are one of the products developed by SCiESMEX. The results of TEC es-timation by different methods and the ionosphericW index (Gulyaeva et al., 2013) as a measure of ionospheric distur-bance are published in the SW weekly reports.
2.6 Repository of Space Weather Data (RICE)
[image:4.612.308.548.66.255.2]In 2015, the National Council of Science and Technology created a network of repositories for science and technology in Mexico. SCiESMEX manages the repository of the SW data. RICE provides the capabilities for massive and high-speed storage and processing of data from the networks of lo-cal and international SW instruments. The data in RICE can be processed in quasi-real time. The results are published on the official SCiESMEX web page both in weekly SW reports and as quasi-real-time SW values. This allows us to perform the continuous quasi-real-time monitoring of SW conditions and to analyze previous events.
Figure 2.Scaled X-ray flux from the solar flare on 22 June 2015 by GOES satellite data (green curve) and a radio flux as detected by MEXART (blue curve) at 139.65 MHz.
3 Space weather observations 3.1 The event on 22 June 2015
On 19 June 2015 at 05:00 UTC, a filament eruption was de-tected in the solar southeast quadrant of the solar disk. On 21 June 2015, between 01:00 and 03:00 UTC, two solar flares erupted from the active region 2371 (M2 and M2.6), and a halo CME, associated with these flares, was also detected. On the same day, at 09:44 and 18:20 UTC, two other flares were released from the solar atmosphere, with M3 and M1 categories, respectively (SWPC, 2015b).
On 22 June 2015, two CME arrivals were detected by the ACE spacecraft at 04:51 UTC (associated with the first fila-ment eruption) and 17:59 UTC (associated with the double-peaked M2 flare from the active region 2371 on 21 June). Shortly afterward, in the same active region, an M6 X-ray solar flare with a full halo CME was detected at 17:59 UTC. This last CME arrived at Earth 2 days later on 24 June at 12:58 UTC (SWPC, 2015c).
3.1.1 Observations by MEXART
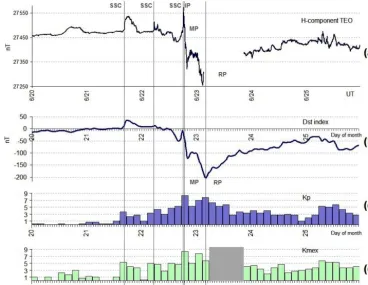
im-Figure 3.Variations of parameters during 20–25 June 2015: H component of the magnetic field by a local magnetometer in Mexico(a), Dst index(b), Kp index(c), and localKmexindex(d). Vertical lines throughout all the panels indicate the moments of SSC, IP, MP, and RP.
mediately after the occurrence of the solar flare on 22 June, showing a disrupted and saturated beam pattern (blue curve). Figure 2 shows the signal of the X-ray flux increase of the solar flare detected by GOES (blue curve normalized to max-imum MEXART flux) and the radio flux at 139.65 MHz de-tected by MEXART (green curve). The temporal difference between the maximum of the X-ray emission detected by the GOES satellite and the solar transit detected by MEXART is about 30 min. The flux in the MEXART data was saturated. MEXART detected the signature of the solar flare with a con-siderable increment in the radiation flux.
3.1.2 Observations by CALLISTO
During this event, the CALLISTO-MEXART station was still under initial configurations and did not detect the event. 3.1.3 Geomagnetic storm detected with local
magnetometer data
Figure 3 shows the development of the geomagnetic storm from 20 to 25 June 2015 (Fig. 3a). Variations of theH com-ponent of the magnetic field were measured at the Teoloyu-can Geomagnetic Observatory (TEO). According to our magnetic data, three sudden storm commencements (SSCs) provoked by the interplanetary shocks (Astafyeva et al.,
2017) of different intensities occurred during this interval: 21 June at 16:46 UTC, 22 June at 05:47 UTC, and 22 June at 18:30 UTC. An intense geomagnetic storm followed the last SSC, with its main phase (MP) between 22 and 23 June. Unfortunately, some data were lost because the energy sup-ply failed in the magnetic observatory between 03:33 and 21:13 UTC on 23 June. For this reason, we show the Dst in-dex (Fig. 3b) as the measure of geomagnetic field change on a global scale to define the beginning of the recovery (RP) of the geomagnetic field.
[image:5.612.115.483.70.355.2]Figure 4.Forbush decrease detected by the Mexico City Cosmic Ray Observatory, generated by the M-class solar flares on 21 to 22 June.
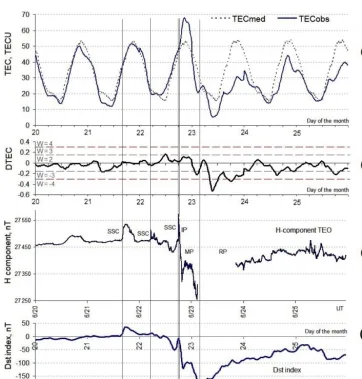
Figure 5.Ionospheric and geomagnetic parameters during 20–25 June 2015: observed (TECobs) and 27-day median (TECmed) TEC values for the UCOE station(a), ionospheric weatherW index corresponding to the logarithmic deviation DTEC for the UCOE station(b),H
[image:6.612.116.479.285.665.2]Figure 6.Regional TEC maps constructed for two time moments during the disturbance (panelsaandc) and for the same moments under quiet geomagnetic conditions (panelsbandd). The location of GPS stations whose data were used are marked by red points (for more details, we have prepared a video of a period of 38 days from 24 May to 30 June 2015 at 24 FPS at http://www.rice.unam.mx/aztec/videos/ tecmaps01.mp4, last access: 5 October 2018).
3.1.4 Cosmic ray observations
Figure 4 shows the FD observed by the Mexico City NM. From the baseline, the minimum of the FD is estimated as 6.6 %. The interval to reach the minimum was about 74 h, and the whole event lasted about 10 days. The event began on 22 June at 01:00 UTC. There was an abrupt flux decay on 22 June at 19:00 UTC, and it reached the first minimum on 23 June at 03:00 UTC, covering a decrease of at least 5 % in an interval of about 8 h. This main phase of the FD might well be associated with the arrival of the CME on 22 June at 17:59 UTC. The behavior of the cosmic ray fluxes correlated with the geomagnetic disturbances as described in Fig. 3. Other NM stations around the world also confirmed this FD event. This event shows that the Mexico City NM works properly, and it detects the variations of cosmic rays asso-ciated with SW events. Unfortunately, the muon telescope at Mexico City was off at the time of the event.
3.1.5 Ionospheric disturbances detected with the use of GPS data
The geomagnetic storm between 22 and 23 June 2015 dis-cussed here caused ionospheric disturbances over Mexico. First, let us consider the data from a single GPS receiver. Fig-ure 5a illustrates the behavior of one of the main ionospheric
Figure 7. Type III solar radio burst detected by CALLISTO-MEXART on 29 September 2015.
TECobsis the observed TEC value and TECmedis a median value calculated over 27 days prior to the day of observation (blue and gray dotted curves in Fig. 5a, respectively). The value DTEC<−0.301 corresponds toW= −4. According to the classification provided in (Gulyaeva et al., 2013), this is the intensely negative W storm.W= −4 represents the least negative storm magnitude. Such a disturbed state of the ionosphere can lead to a negative impact on different sys-tems. For example, the range of the frequencies used within the high-frequency (HF) band can narrow significantly. Such negative storms are especially dangerous during the night hours when critical frequencies of the ionosphere are lower than during the daytime. This was the case in our study: the most intense negative DTEC minimum on 23 June (Fig. 5b) occurred during the local night hours.
One of the products that SCiESMEX offers to its users is the regional TEC maps, which illustrate TEC distribu-tion over Mexico. Such maps are a useful instrument for the qualitative estimation of the ionosphere state; see for instance Hernández-Pajares et al. (2009), Rodríguez-Bouza et al. (2017), Barros et al. (2018), and Li et al. (2017). The example is provided in Fig. 6. Data from 22 GPS receivers were used to construct these TEC maps. The main diurnal TEC maximum is usually observed near 14:00 local time (LT) (20:00 UTC) throughout Mexico during all four seasons (Sergeeva et al., 2017, 2018).
The results for 14:00 LT on the day of the maximum pos-itive TEC disturbance on 22 June 2015 are compared to the results for the same hour on the quiet geomagnetic day of 3 June 2015 (Fig. 6a, b). The map for 3 June 2015 can serve as a quiet reference as it was one of the quietest days of the month (Dstmin= −4 nT, Kpmax=2−,Kmexmax=3). The moment of 14:00 LT was also a moment of the largest
differ-ence (positive disturbance) between the disturbed and quiet TEC values during the considered ionospheric disturbance2. If one compares the plots in Fig. 6a and b, we see that the picture is rather different: the electron concentration in the ionosphere was increased over the whole of Mexico on the day of the storm. TEC growth can lead to the increase of errors in the object location with signals of global position-ing systems. The difference between these two maps proves that the ionosphere structure changed significantly during the disturbance. In addition, we illustrate TEC distribution maps constructed for 05:00 LT (11:00 UTC) on 23 June 2015 (the moment of the most intensely negative TEC disturbance), and for the same moment of the quiet day on 3 June 2015 (Fig. 6c, d). Clearly, the TEC was lower on this day.
As TEC is an integral parameter that characterizes electron content in the cross unit section from the ground to a GPS satellite, it does not permit precise conclusions to be made about the variations in different ionospheric layers (their peak density and height). The ionospheric sounding data are usually used for that. There are no ionosonde measurements in Mexico at the moment. Installation is a part of our fu-ture work. To sum up, the geomagnetic storm that started on 22 June 2015 provoked the ionospheric disturbance over Mexico, which was characterized by the positive phase and then the negative phase. These phases of ionospheric distur-bance correlated with the phases of geomagnetic disturdistur-bance. The structure of the ionosphere was significantly changed during the geomagnetic storm, which could lead to negative consequences for different technological systems.
3.2 The event on 26 September 2015
The second event that we address in this study is related to the solar radio burst. It was detected by the CALLISTO-MEXART station and the CALLISTO-MEXART radio telescope at 19:22 UTC on 2 September 2015. This solar radio burst was associated with a weak M1.1 solar flare that started at 19:20 UTC, peaked at 19:24, and ended at 19:27 UTC. The closest CME related to this event was recorded by LASCO at 20:00:04 UTC. According to SWPC/NOAA this particular CME did not hit the Earth (SWPC, 2015a).
The solar radio event registered by CALLISTO-MEXART (Fig. 7) shows the characteristic dynamic solar spectrum of a radio burst type III. The type II and type III spectrums differ in their dynamics. While type III shows an emis-sion in consecutive short periods (minutes) of time and cov-ers a wide wavelength bands, the type II radio burst is de-rived from high to low frequencies for a long period of time (days) (Hillan et al., 2012). Related to this event, SWPC re-leases an ALTTP2 code where a type II burst at 19:30 UTC was reported (serial number: 1025). The type III solar radio 2For more details, we have prepared a video of a 38-day
Figure 8.Type III solar radio burst registered by e-CALLISTO station on 29 September 2015.(a)Alaska station;(b)Roswell station, New Mexico. In both records the radio burst is registered at 19:23 UTC.
burst was confirmed by two independent CALLISTO sta-tions: Roswell, New Mexico, and Alaska (Fig. 8). Figure 9 shows the light curve of the event constructed on the basis of CALLISTO data. The maximum peak of the event was characterized by a signal-to-noise ratio (SNR) of 32.
Both instruments, the MEXART radio telescope and the CALLISTO-MEXART, have a common band: approxi-mately 140 MHz. Consequently, both instruments can detect the same events.
We rescaled (y axis) the fluxes obtained by two instru-ments to compare them. The results are given in Fig. 10, where we show the event observed at the same band by both instruments. We see that the solar radio burst was detected by both instruments. This is the first record of a solar radio burst type III by the MEXART radio telescope confirmed by the CALLISTO station simultaneous observation. The flux
registered by both instruments opens the possibility of using MEXART as a solar radio monitor (not only for IPS observa-tions) with high time resolution and a better sensitivity. The SNR only for the 140 MHz channel of CALLISTO is 18, and for the MEXART, it is 224 for the closest band.
Figure 9.Light curve of the type III solar radio burst detected on 29 September 2015 with a signal-to-noise ratio of 32.
Figure 10.29 September 2015 records by MEXART (blue curve) and CALLISTO-MEXART (green curve) at approximately 140 MHz. The flux was scaled in order to compare the response of both instruments.
for oblique ionospheric sounding is planned for our future work.
4 Conclusions
We presented the results of the first joint observations of SW phenomena in Mexico. We addressed two SW events that oc-curred on 22 June and 29 September 2015. Features of the behavior of SW parameters were obtained with the use of
different local instruments installed in Mexico. The main re-sults are the following.
– A solar flare was detected by the MEXART radio tele-scope on 22 June 2015, in agreement with GOES satel-lite data. This example proves the possibility of using MEXART for solar flare detection if the flares occur during the local daylight hours.
[image:10.612.144.452.287.536.2]MEXART station. The measurements by CALLISTO-MEXART were in accord with other CALLISTO ob-servations. This proves that both ground-based local in-struments (MEXART and CALLISTO-MEXART) can be used for the monitoring of solar radio bursts which occur during local daylight hours in Mexico. The ad-vantage of the MEXART instrument is better sensitivity for such events. Note also that we report, for the first time, a radio blackout over Mexico related to SW phe-nomena.
– Local cosmic ray data indicate SW phenomena in Mex-ico. This is due to the fact that the irregularities in the in-terplanetary magnetic field, associated with large-scale solar wind disturbances, deflect the cosmic ray flux measured in the center of Mexico. For example, a For-bush decrease was recorded, associated with the passing of the CME detected during the event in June 2015. – Local geomagnetic field variations from 21 to
25 June 2015 caused an intense ionospheric disturbance over Mexico. Local magnetometer data were in accord with the variations of the Dst index. The regionalKmex index allowed us to estimate the rate of geomagnetic disturbance in Mexico. The phases of ionospheric turbance correlated with the phases of geomagnetic dis-turbance in time. The results are in agreement with other ionospheric studies of this event. It was revealed that the structure of the ionosphere was significantly changed during the geomagnetic storm, which could lead to neg-ative consequences for different technological systems. As the ionosphere state was only estimated with TEC data, no conclusions about the changes in each iono-spheric layer can be made.
Some lessons can be learned from this first study in or-der to enhance the SW monitoring and the development of a comprehensive ground-based multi-instrument data set in Mexico. We must increase the number of magnetometers, lo-cated at different sites, to have local measurements at dif-ferent regions in real time. The installation of more CAL-LISTO stations in Mexico will allow us to understand the effects of radio communications’ disruption with more ac-curacy. For the case of TEC maps computed over Mexican territory, the next step is to improve the spatial resolution of TEC maps by increasing the number of GPS stations avail-able and by bettering our TEC calibration methods. One of the future steps for improving the computations of TEC maps is to implement a homogeneous distribution of GPS stations throughout the ground territory. More detailed analysis could be done with ionospheric sounding data from ionosondes. Thus, ionosonde data are needed to complement both radio blackout studies and ionospheric radio propagation condi-tions over Mexico. The incorporation of a network of mag-netometers and ionosondes in Mexico in the next year will
significantly improve the coverage and quality of our space weather data.
Data availability. Callisto data are publicly and freely available at http://www.rice.unam.mx/callisto (CALLISTO, 2018). MEXART data are publicly and freely available at http://www.rice.unam. mx/mexart (MEXART, 2018). Cosmic ray data can be found at http://132.248.105.25/ (Cosmic Ray, 2018). Geomagnetic data in real time are available at http://132.248.6.186/TEOonline.html (Geomagnetic, 2018). Observational, navigational, and meteoro-logical RINEX files collected by the Trans-boundary, Land and Atmosphere Longterm Observational and Collaborative Network (TLALOCNet) are publicly and freely available in the TLALOCNet archive (http://tlalocnet.udg.mx; TlalocNet, 2018). Observational RINEX files from the SSN GPS network are available upon request to [email protected].
Supplement. The supplement related to this article is available on-line at: https://doi.org/10.5194/angeo-36-1347-2018-supplement.
Author contributions. EA and PV are the technicians in charge of the Callisto station and the MEXART radiotelescope. The process-ing and data analysis for Callisto MEXART station was developed by VDlL, and EHD. CM is the PI of the e-Callisto network and is taking care of data archiving, pre-processing, image-generation and quality control of CALLISTO data and CM are the people in charge of Callisto data analysis and processing. JAGE, EAR, and JMA are the people on charge of MEXART data analysis. MAS, MR, and ERH are the team focused in Ionosphere analysis. The Cosmic Ray data analysis were performed by XG and JFVG. Ge-omagnetic analysis and processing was developed by EH, GC, and PCR. The data adqusition in the RICE repository was developed by VDlL and EHD.
Competing interests. The authors declare that they have no conflict of interest.
Special issue statement. This article is part of the special issue “Space weather connections to near-Earth space and the atmo-sphere”. It is a result of the 6◦Simpósio Brasileiro de Geofísica Espacial e Aeronomia (SBGEA), Jataí, Brazil, 26–30 September 2016.
and DGAPA-PAPIIT IN106916. Ernesto Aguilar-Rodriguez acknowledges the DGAPA-PAPIIT project (grant: IN101718) and the CONACyT project (grant: 220981). Mario Rodriguez-Martinez acknowledges DGAPA-PAPIIT IA 107116 and CONACyT INFR: 253691. The authors express their gratitude to the NOAA Space Weather Prediction Center (SWPC), Boulder, Colorado, USA, for providing the analysis software used at SWPC for the operational US-TEC product to perform TEC calculations for this study. The calculations of the local TEC values are partly based on GPS data provided by the Mexican Servicio Sismológico Nacional (SSN, 2018; Pérez-Campos et al., 2018), the Trans-boundary, Land and Atmosphere Longterm Observational and Collabo-rative Network (TLALOCNet; Cabral-Cano et al., 2018), and SSN-TLALOCNet operated by the Servicio de Geodesia Satelital (SGS) and SSN at the Instituto de Geofísica, Universidad Nacional Autónoma de México (UNAM) and UNAVCO Inc. We gratefully acknowledge all the personnel from SSN, SGS, and UNAVCO Inc. for station maintenance, data acquisition, IT support, and data distribution for these networks. TLALACNet, SSN-TLALOCNet, and related SGS operations are supported by the National Sci-ence Foundation, grant number EAR-1338091, NASA-ROSES NNX12AQ08G, Consejo Nacional de Ciencia y Tecnologia (CONACyT) projects 253760, 256012, and 2017-01-5955, UNAM Programa de Apoyo a Proyectos de Investigación e Innovación Tecnológica (PAPIIT) projects IN104213, IN111509, IN109315-3, IN104813-3, and supplemental support from UNAM Instituto de Geofísica and Centro de Ciencas de la Atmosfera. Thanks are expressed to the Institute for Astronomy, ETH Zurich, and FHNW Windisch, Switzerland. Whitham Reeve and Stan Nelson are thanked for providing the observations for the stations of Alaska and Roswell, New Mexico, in the e-CALLISTO network. The authors would like to thank Ana Caccavari for providing the magnetic field data from Teoloyucan Geomagnetic Observatory. The authors also thank Ilya Zhivetiev from the Institute of Cos-mophysical Research and Radio Wave Propagation FEB RAS and Yury Yasyukevich and Anna Mylnikova from the Institute of Solar-Terrestrial Physics SB RAS for providing the TayAbsTEC software for this study (http://www.gnss-lab.org/tay-abs-tec; last access: 30 June 2018).
Edited by: Jean-Pierre Raulin Reviewed by: two anonymous referees
References
Alvarez-Castillo, J. and Valdés-Galicia, J. F.: Signatures of thun-derstorms in the variations of the secondary cosmic rays reg-istered in Mexico City, J. Atmos. Sol.-Terr. Phys., 72, 38–50, https://doi.org/10.1016/j.jastp.2009.10.006, 2010.
Araujo-Pradere, E. A., Fuller-Rowell, T. J., Spencer, P. S. J., and Minter, C. F.: Differential validation of the US-TEC model, Radio Sci., 42, RS3016, https://doi.org/10.1029/2006RS003459, 2007.
Astafyeva, E., Zakharenkova, I., Huba, J. D., Doornbos, E., and van den IJssel, J.: Global Ionospheric and Thermospheric Effects of the June 2015 Geomagnetic Disturbances: Multi-Instrumental Observations and Modeling, J. Geophys. Res.-Space, 122, 716– 742, https://doi.org/10.1002/2017JA024174, 2017.
Balch, C., Biesecker, D., Combs, L., Crown, M., Doggett, K., Kunches, J., Singer, H., and Zezula, D.: Halloween space weather storms of 2003, Tech. Rep., 1, 1–46, 2004a.
Balch, C., Murtagh, B., Zezula, D., Combs, L., Nelson, G., Tegnell, K., Crown, M., and McGehan, B.: Intense space weather storms October 19–November 07, 2003, service assessment, NOAA, US Dep. of Commerce, Silver Spring, Md, 106, 1–47, 2004b. Barros, D., Takahashi, H., Wrasse, C. M., and Figueiredo,
C. A. O. B.: Characteristics of equatorial plasma bubbles observed by TEC map based on ground-based GNSS re-ceivers over South America, Ann. Geophys., 36, 91–100, https://doi.org/10.5194/angeo-36-91-2018, 2018.
Benz, A. O., Monstein, C., and Meyer, H.: Callisto A New Con-cept for Solar Radio Spectrometers, Sol. Phys., 226, 143–151, https://doi.org/10.1007/s11207-005-5688-9, 2005.
Blagoveshchensky, D. V., Maltseva, O. A., and Sergeeva, M. A.: Impact of magnetic storms on the global TEC distribution, Ann. Geophys., 36, 1057–1071, https://doi.org/10.5194/angeo-36-1057-2018, 2018.
Buonsanto, M. J.: Ionospheric Storms – A Review, Space Sci. Rev., 88, 563–601, https://doi.org/10.1023/A:1005107532631, 1999. Cabral-Cano, E., Pérez-Campos, X., Márquez-Azúa, B., Sergeeva,
M. A., Salazar-Tlaczani, L., DeMets, C., Adams, D., Galetzka, J., K., H., Feaux, K., Serra, Y. L., Mattioli, G. S., and Miller, M. M.: TLALOCNet: A Continuous GPS-Met Array in Mexico for Seis-motectonic and Atmospheric Research, Seismol. Res. Lett., 89, 373–381, 2018.
Cabral-Cano, E., Pérez-Campos, X., Márquez-Azúa, B., Sergeeva, M. A., Salazar-Tlaczani, L., DeMets, C., Adams, D., Galetzka, J., Feaux, K., Serra, Y. L., Mattioli, G. S., and Miller, M.: TLALOC-Net: A Continuous GPS-Met Backbone in Mexico for Seismo-tectonic, and Atmospheric Research, Seismol. Res. Lett., 89, 373–381, https://doi.org/10.1785/0220170190, 2018.
CALLISTO: Callisto-MEXART database, available at: http://www. rice.unam.mx/callisto, last access: 9 October 2018.
Cane, H. V.: Coronal Mass Ejections and Forbush Decreases, Space Sci. Rev., 93, 55–77, https://doi.org/10.1023/A:1026532125747, 2000.
Cane, H. V., Richardson, I. G., and von Rosenvinge, T. T.: Cosmic ray decreases: 1964–1994, J. Geophys. Res., 101, 21561–21572, https://doi.org/10.1029/96JA01964, 1996.
Cid, C., Palacios, J., Saiz, E., Guerrero, A., and Cerrato, Y.: On extreme geomagnetic storms, J. Space Weather Spac., 4, A28, 1–10, https://doi.org/10.1051/swsc/2014026, 2014.
Clem, J. M. and Dorman, L. I.: Neutron Monitor Re-sponse Functions, Space Sci. Rev., 93, 335–359, https://doi.org/10.1023/A:1026508915269, 2000.
Corona-Romero, P., Sergeeva, M., Gonzalez-Esparza, J., Cifuentes-Nava, G., Hernandez-Quintero, E., Caccavari, A., and Sanchez-Garcia, E.: Mexican Geomagnetic K Index, in: Latinmag Letters, vol. 7 of Special Issue (2017), GEP01, 1–6, 2017.
Cosmic Ray: COSMICRAY database, available at: http://132.248. 105.25/, last access: 9 October 2018.
Dinardini, C., Dasso, S., and Gonzalez-Esparza, J. A.: Review on space weather in Latin America. 1. The beginning from the Space Science Research, Adv. Space Res., 58, 1916–1939, https://doi.org/10.1016/j.asr.2016.03.012, 2016.
Ready for Space Weather, Ad. Space Res., 58, 1940–1959, https://doi.org/10.1016/j.asr.2016.03.013, 2016b.
Dinardini, C., Dasso, S., and Gonzalez-Esparza, J. A.: Review on space weather in Latin America. 3. Development of space weather forecasting centers, Adv. Space Res., 58, 1960–1967, https://doi.org/10.1016/j.asr.2016.03.011, 2016c.
Forbush, S. E.: On cosmic-ray effects associated with magnetic storms, Terrestrial Magnetism and Atmo-spheric Electricity, J. Geophys. Res., 43, 203–218, https://doi.org/10.1029/TE043i003p00203, 1938.
Geomagnetic: TEOLOYUCAN database, available at: http://132. 248.6.186/TEOonline.html, last access: 9 October 2018. González, L. X., Valdés-Galicia, J. F., Sánchez, F., Muraki, Y., Sako,
T., Watanabe, K., Matsubara, Y., Nagai, Y., Shibata, S., Sakai, T., Musalem, O., and Hurtado, A.: Re-evaluation of the Neutron Emission from the Solar Flare of 2005 September 7, Detected by the Solar Neutron Telescope at Sierra Negra, Astrophys. J., 814, 1–7, https://doi.org/10.1088/0004-637X/814/2/136, 2015. Gonzalez-Esparza, A., Carrillo, A., Andrade, E., Perez, R., and
Kurtz, S.: The MEXART interplanetary scintillation array in Mexico, Geofis. Int., 43, 61–73, 2004.
González-Esparza, J. A., Carrillo, A., Andrade, E., Sierra, P., Vazquez, S., Rodríguez, C., Pérez-Enríquez, R., Kurtz, S., and Blanco-Cano, X.: Calibration and testing of the MEXART an-tenna using solar transits, Adv. Space Res., 38, 1824–1827, https://doi.org/10.1016/j.asr.2005.09.032, 2006.
Gonzalez-Esparza, J. A., De la Luz, V., Corona-Romero, P., Mejia-Ambriz, J. C., Gonzalez, L. X., Sergeeva, M. A., Romero-Hernandez, E., and Aguilar-Rodriguez, E.: Mexican Space Weather Service (SCiESMEX), Space Weather, 15, 3–11, https://doi.org/10.1002/2016SW001496, 2017.
Gonzalez-Esparza, J. A. and Cuevas-Cardona, Observations of Low Latitude Red Aurora in Mexico During the 1859 Carrington Ge-omagnetic Storm, Space Weather, 16, 593–600, 2018.
Goodman, J. M.: Space Weather and Telecommunications, vol. 782, Springer US, 2005.
Gulyaeva, T. L., Arikan, F., Hernandez-Pajares, M., and Stanis-lawska, I.: GIM-TEC adaptive ionospheric weather assessment and forecast system, J. Atmos. Sol.-Terr. Phys., 102, 329–340, https://doi.org/10.1016/j.jastp.2013.06.011, 2013.
Hernández-Pajares, M., Juan, J. M., Sanz, J., Orus, R., Garcia-Rigo, A., Feltens, J., Komjathy, A., Schaer, S. C., and Krankowski, A.: The IGS VTEC maps: a reliable source of ionospheric information since 1998, J. Geodesy, 83, 263–275, https://doi.org/10.1007/s00190-008-0266-1, 2009.
Hillan, D. S., Cairns, I. H., and Robinson, P. A.: Type II solar radio bursts: 2. Detailed comparison of theory with observations, J. Geophys. Res.-Space, 117, A06105, https://doi.org/10.1029/2011JA016755, 2012.
Huipe-Domratcheva, E.: Sistema de detección de eventos de ra-dioemisión solar utilizando el radioespectógrafo CALLISTO y el radiotelescopio MEXART en el Laboratorio Nacional de Clima Espacial, tesis de licenciatura, Escuela Nacional de Estudios Su-periores Unidad Morelia, Universidad Nacional Autónoma de México, 2018.
Iwai, K., Tsuchiya, F., Morioka, A., and Misawa, H.: IPRT/AMATERAS: A New Metric Spectrum Observation System for Solar Radio Bursts, Sol. Phys., 277, 447–457, https://doi.org/10.1007/s11207-011-9919-y, 2012.
Lanzerotti, L. J.: Space weather effects on communications, Springer Berlin Heidelberg, Berlin, Heidelberg, 247–268, https://doi.org/10.1007/978-3-540-34578-7_9, 2007.
Li, Z., Wang, N., Li, M., Zhou, K., Yuan, Y., and Yuan, H.: Evalua-tion and analysis of the global ionospheric TEC map in the frame of international GNSS services, 60, 3718–3729, 2017.
Lockwood, J. A.: Forbush Decreases in the Cos-mic Radiation, Space Sci. Rev., 12, 658–715, https://doi.org/10.1007/BF00173346, 1971.
López-Montes, R., Pérez-Enríquez, R., Araujo-Pradere, E. A., and López Cruz-Abeyro, J. A.: Fractal and wavelet analysis eval-uation of the mid latitude ionospheric disturbances associated with major geomagnetic storms, Adv. Space Res., 55, 586–596, https://doi.org/10.1016/j.asr.2014.10.037, 2015.
Mayaud, P. N.: Derivation, Meaning, and Use of Geo-magnetic Indices, Washington DC American Geophys-ical Union Geophysical Monograph Series, 22, 1–154, https://doi.org/10.1029/GM022, 1980.
Mejia-Ambriz, J. C., Villanueva-Hernandez, P., Gonzalez-Esparza, J. A., Aguilar-Rodriguez, E., and Jeyakumar, S.: Observations of Interplanetary Scintillation (IPS) Using the Mexican Ar-ray Radio Telescope (MEXART), Sol. Phys., 265, 309–320, https://doi.org/10.1007/s11207-010-9562-z, 2010.
Mejia-Ambriz, J. C., Jackson, B. V., Gonzalez-Esparza, J. A., Buff-ington, A., Tokumaru, M., and Aguilar-Rodriguez, E.: Remote-Sensing of Solar Wind Speeds from IPS Observations at 140 and 327 MHz Using MEXART and STEL, Sol. Phys., 290, 2539– 2552, https://doi.org/10.1007/s11207-015-0694-z, 2015. Menvielle, M. and Berthelier, A.: The K-derived planetary
in-dices – Description and availability, Rev. Geophys., 29, 415–432, https://doi.org/10.1029/91RG00994, 1991.
MEXART: MEXART database, available at: http://www.rice.unam. mx/mexart, last access: 9 October 2018.
Minter, C. F., Robertson, D. S., Spencer, P. S. J., Jacobson, A. R., Fuller-Rowell, T. J., Araujo-Pradere, E. A., and Moses, R. W.: A comparison of Magic and FORTE ionosphere measurements, Radio Sci., 42, RS3026, https://doi.org/10.1029/2006RS003460, 2007.
Nindos, A., Aurass, H., Klein, K.-L., and Trottet, G.: Radio Emis-sion of Flares and Coronal Mass Ejections, invited Review, Sol. Phys., 253, 3–41, https://doi.org/10.1007/s11207-008-9258-9, 2008.
OECD: Mexico, 216, 1–253, https://doi.org/10.1787/mei-v2016-8-table79-en, 2016.
Pérez-Campos X., Espindola, V. H., Perez, J. et al.: The Mexi-can National Seismological Service: An Overview, Seismol. Res. Lett., 89, 318–323, https://doi.org/10.1785/0220170186, 2018. Richardson, I. G. and Cane, H. V.: Galactic Cosmic Ray
Intensity Response to Interplanetary Coronal Mass Ejec-tions/Magnetic Clouds in 1995–2009, Sol. Phys., 270, 609–627, https://doi.org/10.1007/s11207-011-9774-x, 2011.
Rodríguez-Martínez, M., Pérez-Enríquez, H. R., Carrillo-Vargas, A., López-Montes, R., Araujo-Pradere, E. A., Casillas-Pérez, G. A., and Cruz-Abeyro, J. A. L.: Ionospheric Disturbances and Their Impact on IPS Using MEXART Observations, Sol. Phys., 289, 2677–2695, https://doi.org/10.1007/s11207-014-0496-8, 2014.
European ionospheric TEC maps based on Kriging technique to monitor ionosphere behavior, Adv. Space Res., 60, 1606–1616, https://doi.org/10.1016/j.asr.2017.05.008, 2017.
Romero-Hernandez, E., Gonzalez-Esparza, J., Rodriguez-Martinez, M., Sergeeva, M., Aguilar-Rodriguez, E., Mejia-Ambriz, J., and la Luz, V. D.: Study of ionospheric disturbances over Mexico associated with transient space weather events, Adv. Space Res., 60, 1–253, https://doi.org/10.1016/j.asr.2017.06.042, 2017. Sergeeva, M., Maltseva, O., Gonzalez-Esparza, J., la Luz, V. D.,
and Corona-Romero, P.: Features of TEC behaviour over the low-latitude North-American region during the period of medium solar activity, Adv. Space Res., 60, 1838–1849, https://doi.org/10.1016/j.asr.2017.06.021, 2017.
Sergeeva, M., Maltseva, O., Gonzalez-Esparza, J., Mejia-Ambriz, J., la Luz, V. D., Corona-Romero, P., Gonzalez, L., Gatica-Acevedo, V., Romero-Hernandez, E., Rodriguez-Martinez, M., and Aguilar-Rodriguez, E.: TEC behavior over the Mexican re-gion, Ann. Geophys., 60, 1594–1605, 2018.
Stenkin, Y. V., Djappuev, D. D., and Valdés-Galicia, J. F.: Neutrons in extensive air showers, Phys. Atom. Nucl., 70, 1088–1099, https://doi.org/10.1134/S1063778807060117, 2007.
SWPC: SWPC PRF 2092, Space Weather Highlights 28 September–4 October 2015, http://legacy-www.swpc.noaa.gov/ weekly/pdf/prf2092.pdf, 2015a.
SWPC: SWPC PRF 2077, Space Weather Highlights 15 June– 21 June 2015 http://legacy-www.swpc.noaa.gov/weekly/pdf/ prf2077.pdf, 2015b.
SWPC: SWPC PRF 2078, Space Weather Highlights 22 June– 28 June 2015 http://legacy-www.swpc.noaa.gov/weekly/pdf/ prf2078.pdf, 2015c.
SWPC: D Region Absorption Repors SWX DRAP20 C SWPC 20150622175800 GLOBAL, https://www.ngdc.noaa.gov/stp/ drap/data/2015/06/SWX_DRAP20_C_SWPC_20150622.tar.gz, 2015d.
SSN: Servicio Sismológico Nacional, Instituto de Geofísica, Uni-versidad Nacional Autónoma de México, Mexico, 2018. TlalocNet: TLALOCNET database, available at: http://tlalocnet.
udg.mx, last access: 9 October 2018.
Yasyukevich, Y. V., Mylnikova, A. A., Kunitsyn, V. E., and Padokhin, A. M.: Influence of GPS/GLONASS differential code biases on the determination accuracy of the absolute total elec-tron content in the ionosphere, Geomagn. Aeronomy, 55, 763– 769, https://doi.org/10.1134/S001679321506016X, 2015. Yizengaw, E., Doherty, P., and Fuller-Rowell, T.: Is Space