1-1988
Laser printer's image quality using paper substrates
Irene L. Lobo
Follow this and additional works at:
http://scholarworks.rit.edu/theses
This Thesis is brought to you for free and open access by the Thesis/Dissertation Collections at RIT Scholar Works. It has been accepted for inclusion
in Theses by an authorized administrator of RIT Scholar Works. For more information, please contact
Recommended Citation
Irene L. Lobo
A thesis submitted in partial fulfillment of the
requirements for the degree of Master of Science in the
School of Printing Management and Sciences in the College of Graphic
Arts and Photography of the Rochester Institute of Technology
May, 1988
Thesis Advisors:
Professor F. Cost
Rochester Institute of Technology
Rochester, New York
CERTIFICATE OF APPROVAL
MASTER'S THESIS
This is to certify that the Master's Thesis of
Irene L. Lobo
name of student
This is to certify that the Master's Thesis of
Irene L. Lobo
name of student
with a major
in
Printing Technology
has been approved by the Thesis Committee as
satisfactory for the thesis requirement for the
Master of Science degree at the convocation of
May,
1988
date
Thesis Committee:
Name Illegible
Thesis Advisor
I Irene
L. Lobo, hereby grant permission to the Wallace Memorial
Library
,
of Rochester Instutite of Technology, to reproduce
my thesis in
whole or in part
.
Any reproduction will not be for commercial use or
profit.
Irene L. Lobo
Date:
May,
1988
at
the
eleventh
hour
to
help
me completethis
thesis.
I
thank
Mr. William Eisner for his
constant encouragement andsupport;
and
Mr. Benkhe Purushottam for his
help
and guidance.I
also
wantto
thank
Mr. Michael Perez for his
time
and assistance withthe
micro-photography
part
ofthis study,
Mr.
Jeffrey
Pelz for his
time
and
assistance
withthe
use ofthe
Xerox Macro/Micro Densitometer
andMr. Archie Provan fot
the
use ofthe
Kodak Ektaprint Electronic
Publishing
System.
My
thanks
also
to
Mr.
Joseph
Noga
for his
overallLISTOFFIGURES
viiLIST
OF ILLUSTRATIONS
xABSTRACT
xiiChapter
1
1
Introduction
1
Purpose
1
Background
2
Footnotes
5
Chapter
11
6
Statement
ofthe
Problem
6
Footnotes
9
Specific Papers for Various
Printing
Processes
10
Footnotes
14
Chapter
111
15
Literature
Review
Part
1
15
Literature
Review
Part
11
20
Footnotes
2 5
Chapter
IV
2
7
Hypothesis
2 7
Chapter V
28
Methodology
2 8
Footnotes
5 2
Limitations
5 3
Conclusions
8 5
Bibliography
8 6
Appendix
A
100
Figures
19
to
24
indicating
the
density
measurements with
the
Xerox
Macro/Micro
Densitometer
on papersA,
B, C,
D,E
and
F
respectively
101
Appendix
B
107
One
way
analysis ofVariance
108
Table
ofdensity
means of30
samples ofthe
gray
scale reproduced on each ofpapers
A, B,
C, D,
E
andF
119
Table
of30
density
measurementsfor
eachstep
ofthe
gray
scale reproduced on30
samples of each of papers
A,
B,
C,D,
E
andF
121
Table
of30
measurements ofthe
numberof
lines
per millimeter resolved andthe
line
thickness
in
millimetreproducedfor
eachof papers
A, B, C, D,
E
andF
141
Ranking
of subjective evaluationby
12
personsof
image
quality
on each of papersA, B,
C,
D,
E
,F
...151
Appendix
C
152
Samples
ofimage
printed on papersA, B, C, D,
E
andF
printed
by
Kodak
Ektaprint
Electronic
Publishing
systemTablel.
Smoothness
of each papertype
in
Sheffield Units
as measured
by
the
Sheffield
Smoothness
Meter
4 2
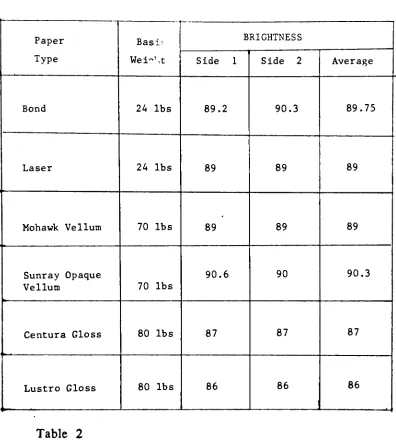
Table
2
Brightness
of each papertype
in
percentage asmeasured
by
the
Technidyne
Brightimeter
TM
4
3
Table
3
Gloss
of each papertype
in
percentage asmeasured
by
the
Multiangle
Glossmeter
4 4
Table
4
Opacity
of each papertype
in
percentageas measured
by
the
Diano/BNL-Opacimeter
4 5
Table
5
Porosity
of each papertype
in Sheffield Units
as measured
by
the
Sheffield
Porosity
Meter
4
6
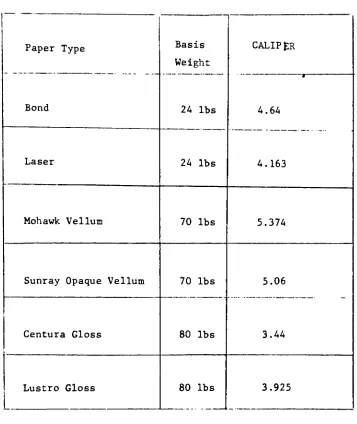
Table
6
Caliper
of each papertype
in
thousands
ofan
inch
as measuredby
the
TM
micrometer4 7
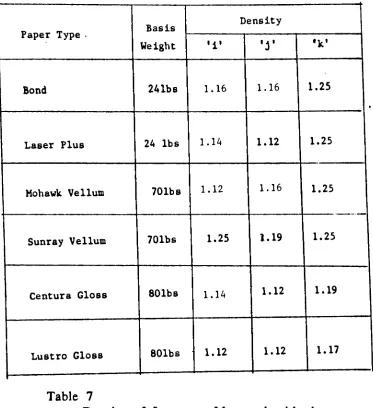
Table
7
Density
ofImage
asMeasured
withthe
Table
9
Results
of subjective evaluationof
image quality
on papersA, B, C, D,
E
andF
69
Figure
2
Rochester
Instutite
ofTechnology
Resolution
Test
Object
indicating
quadrants/display
groupsA, B,
C
andD
...3
0
Figure 3
Graph
Indicating
gray
scale reproduction onBond
5 7
Figure 4
Graph
Indicating
gray
scale reproduction onLaser Plus
....5
8
Figure 5
Graph
indicating
gray
scale reproduction onMohawk
Vellum
Text
5
9
Figure 6
Graph
indicating
gray
scale reproduction onWhite
Sunray
Opaque
Vellum
Text
6 0
Figure
7
Graph
indicating
gray
scale reproduction onWhite
Enamel
Centura
Gloss Text
61
Figure
8
Graph
indicating
gray
scale reproductionLustro Gloss
Text
62
Figure
9
Graph
indicating
comparison ofgray
scalereproduction
in figure
3
to
figure 8
63
Comparison
ofline
thickness
in
millimetersreproduced
on each ofthe papers,
A, b,
C,
D,
E
andF
6 8
Figure
12
Graph
indicating
reproductiondensities
offill-in
patterns on paperA
78
Figure
13
Graph
indicating
reproductiondensities
of
fill-in
patterns on paperB
79
Figure
14
Graph
indicating
reproductiondensities
of
fill-in
patterns on paperC
80
Figure
15
Graph
indicating
reproductiondensities
of
fill-in
patterns on paperD
81
Figure
16
Gr^ph
indicating
reproductiondensities
ct
fill-in
patterns on paperE
.82Figure
17
Graph
indicating
reproductiondensities
of
fill-in
patterns on paperF
83
Figure
18
Graph
indicating
comprison of reproductiondensities
offill-in
patternsin figure!8
to
23
8 4
[image:11.563.52.515.68.694.2]Figure
20
Densities
onPaper B
measured withXerox
Macro/Micro
Densitometer
102
Figure
21
Densities
on paperC
measured withXerox
Macro/Micro
Densitometer
103
Figure
22
Densities
on paperD
measured withXerox
Macro/Micro
Densitometer
'104
Figure
23
Densities
on paperE
measured withXerox
Macro/Micro
Densitometer
105
Figure
24
Densities
on paperF
measured withXerox
Macro/Micro
Densitometer
106
Image
onBond
Text,
magified25x
0
Illustration
2
Image
onLaser
Plus,
magnified25x
7
0
Illustration
3
Image
Mohawk
Vellum
Text,
magnified25x7 1
Illustration
4
Image
onWhite
Sunray
Opaque Vellum
Text,
magnified
25x
7
1
Illustration
5
Image
onWhite
Enamel
Centura Gloss
Text,
magnified
25x
7
2
Illustration
6
Image
onLustro
Gloss
Text,
magnified25x
7 2
Illustration
7
Image
onBond
Text,
magnified40x
7 3
Illustration
8
Image
onLaser
Plus,
magnified40x
7
3
Illustration
9
Image
onMohawk
Vellum
Text,
magnified40x
7
4
Illustration
10
Image
onWhite
Sunray
Opaque Vellum
Text,
magnified
40x
7 4
Illustration 12
Image
onLustro Gloss
Text,
Magnified
40x
75
image
produced
by
a
laser
printer.
The laser
printer used wasthe
Kodak
Ektaprint Electronic
Publishing
System,
300
dots
perinch,
resolution.It
was
found that
certain aspects
ofthe
image quality vary
withthe
paper substrate.Papers
usedin
this
experiment
variedin basis
weights andqualities
ofsmoothness,
brightness,
gloss, opacity,
porosity
and
caliper.The
papers chosen
were ofthree
basis
weights,
two
of each weight.six
papers
in
all weretested.
Quantitfication
and subjective
judgement
were usedfor
evaluation ofimage
quality.Image quality
wasevaluated
based
onthe
following
criteria:
(a)
Tonal
reproduction/tonertransfer
(b)
Resolution:
(i)
number oflines
per millimeterresolved
(ii)
Line
thickness
in
millimeters reprduced
(c)
Edge Definition
as
defined
by
edge raggedness and
blur
Some
aspects ofimage quality
wereaffected
by
paper variables.Basis
weight
alone
does
not
affectimage
quality.However,
factors
such as
smoothness,
porosity
and
caliperhad
a
significant,
althoughsubtle effect
on
tonal
reproduction.Purpose
Image quality is
the
mostimportant factor
in
any
sector ofthe
printing
industry. This
subjectis
noless
critical whendealing
with electronicprinting
and publishing.Laser
printersamong
others,
have
madeanimpact
onthe
industrial
market.The factors
resonsibilefor
their
desirability
arebasically
the
speedandquality
ofproduction,
ease ofoperation,
type
offormat
and available software.Laser
printers areincreasingly
in
usefor
high
quality
presentations.These
are classed as premiumpublishing,
business letters
andforms,
proposals and otherimportant documents. All
ofthese
warrant ahigh
quality look.
The
manufactureshave
sofar
emphasisedhardware in
relationto
image
quality.Great
carehas
been
taken
in
deriving
fonts for
the
laser
printer.
The
purpose ofthis
research wasto
study
the
effect of paper onlaser
printer
image
quality.Electronic printing is revolutionizing
Printing
andletter-press,
screenprinting,
gravure andink
-jetprinting,
(see Paper
Specifications for Various
Printing
Processes.)
Most
electronicprinters,
laser
printers
included,
use regular copierpaper.These facts
produced aninterest
in
this topic.
It
wasnecessary
to
evaluateotherpapers on
the
market.Background
Laser
printers andink
jet
printers producenon-impactprinting,
whichis
one of
the
fastest growing
areasofthe
printing
andpublishing
technology.
Non-impact
printing
causes nostress onthe
papersubstrates;
leading
the
industry
to
use oldertypes
ofregularpaper.The
majorqualifying
tests
used are
stiffness,
opacity
andbrightness.
Xerox,
a noted supplieroflaser
printers recommendsbond
papers andxerographic papers.
Both
these
papers aresmoother,
than
for
example,
most
finishes
ofoffsetpaper.They
alsoprovide a range of stiffnessnecessary for
goodrunability.Xerographic
papersprovidethe
surfacestrength',
smoothness anddesigned for
optimum performancein
offsetand xerographic use.Paper
to
be
run oncopiers shouldhave
amoisture content of5.5
to
6.5
percent,
andbe
suitedto
an environment of40
to
50
percentRelative
Humidity. This is
necessary
to
avoid static.Stiffness is
a criticalfactor.
Limp
sheets ofpaper will causefeeding
difficulties. For
this
reason,
newsprintis
consideredunsuitablefor
non-impact printing.Smoothness
of paperaffectsimage quality
for
both,
traditional and electronic printing.In
the
case ofelectronicprinting,
if
the
paperis
too
rough,
problems offusing
may
result,
causing
excessiveconsumption oftoner
in
the
fusing
system,
or excessive use ofink in
the
case ofink
jet
printing,
as well asloss
of resolution.Porosity
affectspaperfeeding
in
vacumfed
printers.Opacity,
brightness
and whiteness ofpaper relates
to the
appearance of paperandreadabibty
ratherthan
to
its
performance.High
opacity
will reduce see-through/showthrough
in
case ofprinting
onboth
sides ofthe
paper.quality
ofThe
density
ofthe
image/toner
printedletter
is
affectedby
how
eventhe
'blackness'of
the
image/letter
appears.Sharpness
canbe
evaluatedby
observing
the
clustering
oftoner particles at strategic points ofacharacter;
asthe
point wherethe
'limbs'of aletter
meet , asin Y
orthe
'tail'
in
'e', 'a',
'j',
'g'. Toner
particleslying
outsidethe
definite black
andwhiteedge ofaletter
orline
give araggedline
appearance andin
doing
soreduceprintcontrast and affect
image
quality.In
conclusionjust
asin lithographic
reproduction,
the
quality
ofthe
1.
Spence,
W. P.
andVequist,
D.
C.
"Graphic
reproduction"
ppl
62 defines
strenght as properties
including
tensile
andtearing
strenght.2.
Borch,
J.
andSvendsen,
R. G.
"Paper Material Consideration
for
System
Printers"IBM
Research Development Vol.
28,
33,
1984
pp
284,
defines
stiffness as properities
in
paperthat
preventjams
in
cut sheetsduring
transportation through the
printer.3.
Hamerly, James,
"An Analysis
ofEdge
Raggedness
andBlur"
STATEMENT OF
THE PROBLEM
Printing
overthe
centurieshas been
the
art ofmaking
animpression
onthe
substrate.The
resolution ofthe
printedtext
does influence
the
legibility
andreadability
ofthe
subject matter.Resolution is
relatedto the
image
quality
ofthe
finished
product.its
effecct onlegibility
may be
comparedto the
audibility
of ahuman
voice;
in
a manner similarto
Beatrice Warde's
comparison oftypeface to the
audibility
of ahuman
voice.Beatrice Warde has
comparedtype
face
legibility
to the
audibility
of ahuman
voice: shetells
us:"Set
a pagein Foumier
against anotherin Caslon
and anotherin
Plantin,
andit is
asif
youheard
three
different
peopledelivering
the
samediscourse
each withimpeccable
pronounciation andclearity,
yet eachthrough the
medium ofadifferent
personality."
The
nature ofthe
mechanismsthat
makesthese
impressions has
even
blackness;
resolutionin
terms
oflines
per millimeter resolved andedge acuity.
The
electronicprinting device is
aconstant; that
is;
the
Kodak
Ektaprint
Electronic
Publishing
System
with a300
dots
perinch
resolution.The
purposewasto
assessthe
quality
ofthe
printedimage
in
terms
ofdensity,
revolution andedgeacuity
as afunction
of paper variables.Edge
acuity
was consideredin
this
study
as a criteriafor assessing
edgedefinition
and subsequent
image
quality.The
positional error shouldbe
a constantbecause only
one printeris
used and asthere
is only
one eventsize/It has
alsobeen
establishedthat
quality
of paperbears
adirect
relationship
to
the
finished
printedproduct-'.Color
printis
atits best
oncoated papers.
Gloss
on coated papersgivesthe
ink
a gloss andthe
effectis
pleasing
to
the
eye.Also,
glossy
paper gives a morepleasing
appearance,
closer
to
a photographicprint productthan
do
othertypes
of paper.Some
pigmentsadherebetter
to
the
coated paperthan
to
uncoated paper.Newsprint is
the
least
attractive ofprinting
substrates and was not consideredfor
this
study.In
fact,
paper manufacturershave already
researched and come
up
withideal
papersfor
web-offsetprinting,
Processes"). Since
the
advent ofelectronicnon-impactprinting,
few
suchstudies
have been
carried out.However,
Hammermill Paper
Company
does
market a
type
ofpapersthey
call "Laser
Plus" and"Hammermill
Laser."
It
wasnecessary
to
evaluatethe
Hamermill
papers againstquality
paperofother manufacturers
in
orderto
identify
specific papersfor
laser
printers.Such
a paper willhave
goodportability,
(meaning
its
ability
to
endurehigh
temperatures
during
the
printing
process)
andhigh
image quality
among
otherattributes.
The
purpose ofthis
study
wasto
select specific paperfor laser
printersusing
dry
toners.
The
toner
will needto transfer to the
paperto
give gooddensity
to the
image
and atthe
sametime
there
shouldbe
no noticeableedge raggedness or
blur
causedby
toner
dispersation/splattering. The
usecfcoatedgloss papersuch as
White Enamel
Centura Gloss Text
andLustro
Gloss Text
was usedto
indicate
whethercoated paperwill give good printninety
and refrainfrom
blistering
during
the
image
transfer
process.So far
coated papers
have
notbeen
usedas regularpapersfor laser
printers^.The
papers chosenfor
this
study vary
by
basis
weight and surface2.
Hamerly,
J.
"An
analysis ofedge raggedness and blur"Society
ofPhotographic
Science
andEngineering,
Vol.
7.
1981
ppl483.
Venn,
R.
A.
"Buy
the
Best
Supplies"Electronic Publishing.
February
1987
pp73.4. Information
obtainedby
telephone
conversation with salesperson atAlly
CHAPTER II
SPECIFIC
PAPERS
FOR
PRINTING PROCESSES
Papers
are manufacturedto
meet various specificprinting
processes,
the
operations
subsequent andthe
end use ofthe
finished
product.Some
papers are suited
to
only
onepurpose,
while others are suitedto
morethan
one purpose.
White Enamel
papers produce good printquality
with avariety
of processes*
.Papers
are availablefor:
Flexography:
FlexogTaphic printing
requiresfew
special paper requirements.Rolls
ofpaper need
to
feed
witheventension
andbe free from defects.
Flexographic printing
useslow
tack
inks
whichdry by
evaporation.For
this
reason paper
picking is
notaproblem anddryer
temperatures
arenot asGravure:
Sheedfed
gravure and rotogravureprinting
have
specific paperrequirements.
Papers
needto
have
pinpoint smoothness atthe
surface withabsence of voids and pits.
Uncoated
paper requires smoothness andcompressibility.
High
pick resistanceis
notrequired.Rotogravure
printing
needs rollsthat
unwind with an even tension andflatness
through
outthe
web.
Letterpress:
Letterpress
requires pinpoint smoothnessin
paperfor
completeimage
transfer.
Incomplete
smoothnes willresultin incomplete
transfer
ofhalf
tone
dots
andimage
transfer.
Letterpress
prefers papers with goodimpression
tolerance.
Papers for
letterpress do
not needto
be
waterresistant,
but
need adequate pick resistance.Letterpress is
being
replacedhv
rravure and offsetlithography.
Screen Printing:
The
screenprinting
processis
capable ofprinting
ondiffeerent kinds
ofpaper.
Paper
needsto
be
flat,
have
regular undistorted edges and stability.Paper
shouldhave
adequatebasis
weight andrigidity
to
preventcurling
andSheetfed Offset Lithography:
Sheetfed
offsetlithographic
papermusthave higher
surface andinternal
bonding
strengththan that
for
otherprinting
purposes.This
is
so,
because
paper
for
offsetlithographic printing
mustwithstandhigher
tackinks.
The
paperalso needs
to
be
water resistantto
preventpicking from
the
papersurface and
to
resist waterfrom
the
dampening
solution^.On
the
otherhand
excessivewaterresistance,
asin
plasticcoatedpapers,
also causesproblems
for
the
lithographer.
Long
grainpaperis
usedin
multicolorprinting
while short grainis generally
usedfor
single-color workand somemulticolor
jobs.
For
goodrunability,
papermustwithstand repeated separationfrom
aninked
and moistenedblanket
withoutstretching, curling,
becoming
distorted
or
releasing
paper materialto
the
blanket
undernormaloperating
conditions-*.
Web Offset Lithography:
Generally
papersfor
web ofsetlithography
are similiarto
those
for
sheetfed offset
lithography.
However,
weboffset papercantolerate
papersof
lower basis
weights(20
to
80 lbs), lower
moistureresistance andlower
Internal
strengthis
requiredto
resistthe
delamination
forces
ofblanket-to-blanket
orperfecting
presses.Ink
Jet Printing:
Paper
requiredfor ink jet printing
requiresto
have
a surfacethat
is
readily
stained orwettedby
ink
for
maximumdensity
of printedimage,
yet,
it
should not causethe
ink
to
producefeathered images^.
It
is
the
purpose ofthisstudy
to
select specific paperfor laser
printersusing
dry
toners.
The
toner
will needto transfer to the
paperto
give gooddensity
to the
image
and atthe
sametime
there
shouldbe
nonoticeableedgeraggedness or
blur
causedby
toner
dispersion/splattering. The
useofcoated gloss paper such as
the
white enamel Centuragloss andthe
lustro
glosswill
indicate
whethercoated paperwill givegoodprintquality
andrefrain
from
blistering during
the
printing
process.So far
coatedpapersuchas
the two
above mentioned coated papershave
notbeen
used as regularlaser
printer paper.4
These
paperswherecutto
the
size81/2x11 inches
FOOTNOTES
1
.Bureau,
W. "What
the
Printer
Should
Know About
Paper"
Published
by
Graphic Arts
Technical Foundation. 1983
ppl392.
William,
Roger
L. "Paper
andInk
Relationships"
Manhattan,
Kansas 1985
ppl43. Ibidppl43
CHAPTER
III
LITERATURE
REVIEW
PARTI
Electronic printing has
to
alarge
extent revolutionizedthe
printing
industry. In
this
complex andintriguing
system,
laser printing is described
as
"the
most radical andfar reaching
revolutionin hard copy
production ofwords,
numbers and graphicsin four hundred
years."*Much time,
effort,
attention andmoney has been
contributedtoward
developing
laser
printersthat
competein
speedofimage
production.The basic
technology
usedin laser
printersis
the
same asthat
usedin
xerographic copiers.
The only difference is
that
alaser beam is
usedinstead
of reflected
light
to
form
animage. The
central component ofthe
laser
printing
processis
anelectrically
chargeddrum. When
the
drum is
exposedto the
laser
beam,
dots
oftoner
(ink)
aredischarged
onto the
drum
to
from
images
or character patterns.These dots
oftoner
arepositively
charged andadhere
to the
image
positions onthe
drum. This positively
chargedimage is
permanent when
fused
to the
paperby
heat
or pressure.The
resolution ofthe
image formation
on paperis
measuredin dots
perinch (dpi). The image
must reproduce on paperin
a1:1
transfer.
The
paper-surface
characteristics
influence
this transfer.
A
matte paper surfaceis
likely
to
causebroken
print orirregular
toner
adherence.Considering
this
factor,
one method ofachieving
a1
:1transfer,
is
to
usethe
smoothestpossible uncoated paper.
Coated
papercould'blister'or'bubble'
as aresult
of
heat in
this
xerographic process^.Papers
are used attemperatures
sometimes
exceeding 400 degrees farenheit.^(204.4degrees
centigrade)
Software in
the
form
ofinterfaces is constantly
being
designed
andredesigned
to
improve
image quality
oftext,
bne
art,
numbers andhalftones
at
300 dpi(dots
perinch)
resolution.David
Saunders,
Typeface
Acquistion
Manager,
Monotype,
in
his
addressto the
1985
Electronic printing Systems/Directions in
Digital
imaging
Conference
stated :"As
electronic mediacontinueto
improve
in
outputquality
so expectations willarise,
and notleast in
the
typographical
aspects. "*Complex
mechanicalequipmentis
neededto
maintain
quality
onlaser
printer photoconductorsbecause
photoconductorcoating
wearsquickly
and scratcheseasily.5Hard
and soft edges oftypefaces
was one ofthe
areasfocused
on.The
serifs oncharacters
posed a problemin
that
one part of acharactermay look
heavier
than the
other part.The
size andtherefore
appearence ofthe
face
was another area ofattention.It
was acknowledgedthat
ideally
round characters should
be
alittle larger
than
square characters.^
Yet
anotherimage
problem was alsocausedby
outputdevices.
The
charge and
toner
do
not alwaysfunction
as required.This
causes problemsioi
example;
in
the
lower
caseis
'e',
'g'and 'a.'
These
problems ofimage quality have
sofar been
addressedfrom
the
softwarepoint of view.
For
instance,
system variableshave been
addressedby
laser
printermanufacturers.Among
the
variables responsiblefor
image
quality
are: spot sizeor variables of opticalcomponentsinfluencing
it,
modulator rise
time, laser
power and material anddevelopment
variables.**Discussions
dealing
withlaser
printershave
touched
onimage quality
asnitnuoned
above,
"but
a unifiedformulation
ofquality,
especially from
the
point ofviewof print
quality is lacking.
"'Lloyd
L. Chambers in
his
article,
"Paper
Industry
becomes High Tech
asit
provides paper
for Electronic
Printers,
"stated
that
electronic printers andthe
copier markethad
nurturedthe
utilizing
ofcut sizeuncoated paper sold
in
1970,
andby
1984
this
figure had
risento
43
percent.
The
total
markethad
grownby
four
milliontons.
The
sales ofLaser
Printers
up
to
1986 may be
attributedto the
poorerimage quality from
other electronic printers.In his
article,
"Users high
onlaser
printers,
printquality
number oneconcern,
newDatek
userstudy
finds,
"M.
A.
Walham
statesthat
in
additionto
confirming
the
laser
printer'sappeal,
office printer users reportthat
printquality is
of paramount concernin
the
decision
to
purchase aparticularprinter.When
asked whetherquality,
speed orprice wasthe
primary
reasonfor
buying
aprinter,
41
percent ofall users selected print
quality,
including
afull
74
percent oflaser
printerusers".
Concluding
from
the
above,
it is
apparentthat
electronicprinting
quality,
though
good,
leaves
roomfor improvement. This
thesis
investigates
the
possibility
ofimproving
the
image quality
by
proper selection of papersubstrates.
Only
recently,
paper companieshave begun
to
produce paperspecifically for laser printing in
orderto
improve
printquality.Paper
manufacturers are
beginning
to
produce paperwith characteristicsthat
relate
to the
latest
technology
in
electronic printing.The
papersurfaceis designed
to
help
the toner
fuse
to the
paper withoutconsiderations
for
systemprinters"
state
that
increased
smoothnessmay
affecttoner-paper
contact.10The study
also concludesthat
tonertransfer,
as measured
by
printreflectance,
decreased because
ofhigh
humidity
whenmeasured on similar paper sheets.
For
their
experimentthe
sheets ofpaperwhere conditionedat various
humidity
levels
andprintedin
ahumid
environment.
The
paper surface should produce animage
that
is sharp
andgive good contrast
for better
readability.The
paper weightinfluences
handling,
feeding
andtransporting
performance.This is
adjustedfor
electronic printing.
Moisture
contenthas
to
be
controlledto
avoidcurling
and
jamming.
Electronic
printershave
made animpact
ontwo
key
areasin
printing;
prepress/typesetting
and premium publishing.The latter includes
workthat
wasconventionally done
by
sheetfed and offsetlithography,
such asprinted
books,
manuals,
reports and proposals.This
aspect oflaser printing
requirespapermade
for
premiumpublishing;
paper withthe
right
moisture
content, stiffness,
curl andthickness to
ensureit
will runthrough
laser
printers atany
speedwithoutcausing
problems.The
recommendedsub weight
for
such paperis 24
lbs**.More
attention shouldbe
givento
laser
printerimage quality
as afunction
of paper substrates.For
this reason, this
study
will attemptto
LITERATURE
REVIEW
PART
II
Resolution is
perceivedby
customers of printas"tight
registration,
black
density
and extraclearimages."'^In
the
conventional,
(meaning
printing
processes other than electronicprinting)
printing
system animage is
createdon metal orplasticplate.This
plate carries
the
ink
to the
paper.Since
the
ink is
ahomogeneous
substance,
and as an uniform
ink film
thickness
is
carriedto the
papersurface,
the
same amount of
blackness is deposited
onthe
paperthroughout the
body
ofa
letter/character.
In
electronicprinting,
the
dry
toner
particles,
the
pigmentsubstances,
arecarried
to
the
paperby
particlecomponentsthat
carry
a static electrical ormagnetic charge.
In
electronicprinting
the toner
is
than
fixed
to the
paperin
the
pattern ofthe
electrical or magnetic charge particles.The
electrical ormagnetic chargeparticles stick
to the
statically
charged areas onthe
drum
or
belt. The
patternin
whichthe toner
particles attachthemselves to the
transferred,
differ
from
the
perfect'
original
transferred
by
the
carrierin
conventional printing.
The
toner printedimage has
two
characteristics not commonin
non-elecronic
printing using liquid ink. These
two
characteristics aredensity
and edge acuity.Edge acuity is
ameasure ofedge raggedness oredge
definition.
Density
and edgeacuity
aregenerally
more consistentin
allproperly
printed non-electronicprinting
than
they
arein
dry
toner
electronic
printing
processes.The
resolution ofelectronic printersincluding
laser
printersis
measuredin dots
perinch. This is
the
measure ofthe
numberandspacing
of chargereceiving
elements onthe transfer
mechanism;
be
it
adrum
orbelt
wherethe
image is formed
by
electronic meanseachtime.
This
resolutiondetermines
the
image
quality.A
toner
printedimage is
distinguished
by
the
'eveness
ofdensity' or
'blackness'
of an image.*-'
The
amount oftoner
lying
outsidethe
edge ofthe
letter/character is
a measure of edge raggedness or edge acuity.This
characteristic gives an
ill defined
edgeora ragged edge.Edges
areimportant
components ofnearly
allimages,
from
those
ofhalf
tones to
printeddocuments. Much
study has
been
done
onedgesin
the
field
of
image
quality14.Previous
studieshave
assesseddensity
andline acuity
James
Hamerly,
in his study
of"Analysis
ofEdge Raggedness
andBlur"
determined
the
physcialquality
of edgesthat
lead
to
less-than-ideal
images
in
animage quality
sense*5.
He determined
that the
event sizeis
relatedto
image
quality,
althoughthis
might not alwaysbe
the
case,(see
figure
1
page
24
)
A factor known
as'positional
error'
is
alsoimportant
to the
quality
ofthe
edge.Positional
erroris
the
measure ofthe
variationin
the
placement oroccurence of an
imaging
event aboutits intended
position.Therefore,
as a generalcase,
decreasing
the
positional error willimprove
thequality
ofthe
image. The
physics ofthe
imaging
process can controlthe
positional error.
The
natureby
which events arecontrolled,
aswellas,
the
number of possible event sites
does
effectimage
quahty.To
produceany
reasonable
level
ofquality
by
digital
imaging
systems,
the
positionalerrorcannot
be larger
than the
eventsize;
andis
oftenmuchless**\
Manufacturers
of electronic printershave designed
modern printers with aconfiguration and
easy
to
change assembliesthat
providedirect
control ofprint quality.
In laser
printers,
toner
is
the
mostimportant factor in
printquality.
Among
the
manufacturers'
recommendations
for best
resultsfrom
laser
printers,
is
that the
choice ofpaperis
significant.Richard Venn in his
article,
"Buy
the
best
supplies"suggests
that the
userexperimentwithdifferent
papers*^.
He
also
identifies basis
weight,
electricalproperties,
ofpaper18.
Some
ofthese characteristics
affectthe
paper/printerrelationship.
It
wasthe
purpose ofthis
study
to
relate papercharacteristics
suchas,
brightness,
gloss, opacity, porosity,
smoothness and caliperto
image
quality.The
selected papers are ofbasis
weight compatible withlaser
printers.Coated
paperis
notgenerally
usedfor
electronicprinting*^In
non-elecronic
printing,
coated paperhas
alesser diffusuion
effectthan
uncoated paper20.
This bght diffusion is
the
cause of opticaldot
gain and aresult of
the
light scattering
properties of paper.Randal Akers in his
article,
"Laser Paper is
Here"states
that the
heat from
alaser
printer wouldcause acoatedpaper sheet
to
"bubble
orblister."2*Laser
paper,
for
example,
Laser
Plus'(a
type
ofpaperproducedby
Hammermill
Paper
Company
for laser
printers)
is designed
to
help
toner
fuse
to the
paper so asto
producehigh
contrast andsharp images
with goodedge
definition.
A high brightness factor
also contributesto
giving
goodcontrast and a
sharp image22. Laser
paperalso requires a precise moisturecontent,
stiffness andthickness
to
ensureit
will runproperly
through
S
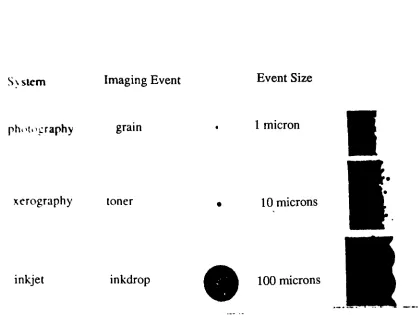
\stemImaging
Event
Event
Size
photography
grainxerography
tonerinkjet
inkdrop
1
micron10
microns100
micronsFigure
1
Simulated
edgeimages
similarto
those
producedby
^photographic, xerographicand
ink jet
imaging
systems.
(
notto
scale)
[image:39.564.71.489.95.410.2]FOOTNOTES
1.
Subject
Editor,
"Critical
trends
for
the
secondhalf
ofthe
Decade
ofthe
80's."A
reportto the
Graphic
Arts,
January
1, 1985,
p.62. Akers
Randall,
"Laser Paper is Here",In-Plant
printer,
October
1987,
p723. Circle
Reader
Service "Paper for
Lasers"Instant
Printer,
November
1986,
pp.36.4.
David Saunders:
'Monotype',
Electronic
Printing
System
Conference,
vol.
1,1985,
p.37.
5.
White,
Dr.
William,
"Conceived
10
years agoion printing
technology
has
come ofage:it may
givelaser printing
some stiffcompetition."
Technology
andTrends,
June
1985,
pp.43-44.
6.
Typeworld First
January
1987 issue
p.1.
7. Touvienen P. "Output
Imaging
For
Digital
Reproduction,"Graphic Arts
in
Finland, 13,
(1984)1.
p.26.
8. Llyod L.
Chambers,"Paper
Industry
Becomes High
Tech
asit
providespaper
for Electronic
Printers."
Paper Trade
Journal
Vol. 169
#6,
June 1985 pp 66
9.
Touvienen
P. "Output
Imaging
For Digital
Reproduction,"Graphic Arts
in
Finland,
vol.13,
(1984)
1.
p.26.
System
Printers"1 1
.Randall
Akers,
"Laser Paper
is
Here",
In Plant
Printer,
Octoberl987,
p.73.
12.
White,
William Dr. Jr. "What Do
All
Those Numbers
Mean?
Translating
the
ubiquitous'dpi. "Trends
andTechnology
Vol.
1
#5,
1986
pp 56-57
13.
Hamerly,
J. R.
"Analysis
ofedge raggedness andblur"
Journal
ofApphed Photographic
Engineering
Vol.7,
#6,
198ppl48-151
14. Ibidppl51
15. Event in
this
contextis
the toner
particle16.
Venn,
R. A.
"Buy
the
best
supplies"Electronic
Publishing,
February
1987
pp 83
17.
Ibid pp 83
18.
Information
obtainedby
telephone
conversation with salesperson atAlly
andCory
Paper
Company,
Rochester
New
York.
Feburary
9th,
1988
19.
Akers,
R. "Laser Paper is
Here"In-Plant
Printer
Oct. 1987 pp 72-73
20. Ibid pp 72
21. Ibid pp 72
22. Ibid pp 73
23.
Hamerly,
J. "Analysis
ofEdge Raggedness
andBlur",
Journal
ofApplied
CHAPTER
rV
HYPOTHESIS
The quality
ofimage
on paper producedby
a300 dots
perinch laser
printer,
variesin
relationto
papersubstrates.Quality
is defined
as:1.
Density/blackness
ofimage.
2. Resolution: Resolution for
this
study is defined in
terms
oflines
permillimeter resolved and
line
thickness
in
millimeters reproduced.3. Good Edge Definition: Edge definition is determined in
terms
of edgeraggedness and edge
blur.
Both
these
factors
are affectedby
toner
transfer
and size oftoner
particle.This study is designed
to
establish whether or notdensity,
resolution andedge
definition vary according
to
basis
weight,
as well asbrightness,
gloss,
CHAPTER
V
METHODOLOGY
For
the
purppose ofthis
study
the
paper selected wasthe
paperalready
in
circulationfor printing in
general.Much
ofthis
regular paperis
usedfor
electrostatic printing.
The
selection wasbased
onbasis
weight.The
reasonis
the
fact
that
paper needsto
be firm
and stablefor
electrostatic purpses.Newsprint is
notusedfor
electrostaticprinting
andtherefore
was notconsidered
in
this
study.Paper Selected
1
Basis
Weight
24 lbs
(17x22,
500)
a.
Hammermill
Bond
(Bond/A)
b.
Hammermill
Laser
Plus (Laser
Plus/B)
2 Basis Weight 70 lbs
(25x28,
500)
a.
Mohwk
Vellum
Text
(Mohwak/C)
b.
White
Sunray
Opaque Vellum Text
(Sunray/D)
3
Basis Weight 80 lbs
(25x35,
500)
b. Warrens Lustro Gloss Text
(Lustro/F)
This study
wasconducted
using
instrumentation
to
quantify
the
difference
between
the
image
quality
among
the
papers selectedfor
this
study.A
subjectivestudy
was used as acompliment
to
instrumentation
in
the
study
ofedge
definition. The
print sample analysised was composed ofthe
following
features.
(a)
A
scannedGray
scale, thirty-two
steps.The
density
was measuredusing
the
Gretag
Reflection Densitometer
D-142
(b)
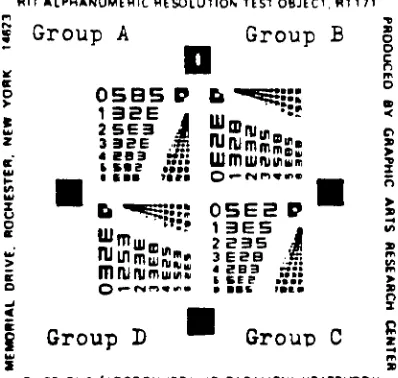
The Rochester Institute
ofTechnology
Resolution Test
Object,
density
1.9.
The Rochester Institute
ofTechnology
Alpha Numeric Resolution Test
Object1
is designed
as a meansto
measure resolution.It is
usedto
measureresolution
in
two
ways;
(i)
numberoflines
per millimeter resolved(ii)
line
thickness
in
millimeters reproducedThe Test Object is
composed offour displays
of alphanumeric characterswhich are similar
but different, (see
figure
2,
page30
)
Two
ofthe
displays
contain characterswith
the
bars
ofthe
elements at90 degrees
to
each other.BITALPHANUMERIC RESOLUTIONTESTOBJECT.RT171
5
Group
A
Group
B
g
n
g
|
osbs p
b "-"sgi::
I
132E .
r
5
5
25E3J
^miNir-
p5
tSK
J
jumuiSS::
|
HI
HI
6
ft
^5>:::05E3P
g
m_ ":? 13E5 .3
m^UJlDu, 2535
J
s = mninim.,,!SS *epa s:: Jmnjfumuiw!
g
Group
D
Group
C
|
Z x
MOI 3NO'AOOtONHDJl iO3J.fUI.LSNI H31S3KDOb
B
Figure
2
Rochester Instutite
ofTechnology
Resolution
Test
[image:45.563.183.382.169.358.2]in
sizefrom
oneline
per millimeterfor
the
'0'gToup
to18
lines
per millimeterfor
the
'25'
group.
The
progressive changein
sizeis
by
the
sixth root oftwo.
The
charactersrandomly vary from
display
to
display
andgroup
to
group.Each
ofthese
characters containthree
elements;
'E',
'2',
'3'.
'5'.
'8'. All
the
charactersin
this
Test Object
areapproximately
recognizable atthe threshold
of perception.This Test
Object is
producedin densities
of1.9, 1.3,
0.7
and0.3.
Tables
that
accompany
this
Test
Object
were usedto
computethe
resultsfor
the
lines
per millimeter andfor line
thickness
in
millimeters.The Rochester Institute
ofTechnology
Alpha Numeric
Resolution
Test
Object
was scannedby
the
Kodak Ektaprint Electronic
Publishing
System's
scanning
device,
and printed onthe
papersamplesthat
werestudied.(seeAppendix
C)
The
resolution wasobservedusing
a15x magnifying
glass.The
limit
of resolution wasdetermined
whenthe
observer wasableto
fully
recognizethe
components2within
the
elements^.That
is,
the
observer was ableto
fully
distinguish
and rcognizethe
elements atthe
critcial resolutionlevel.
The
resolution wasdetermined
asdescribed
above at each ofthe
four
display
groups,
A, B,
C,
D;
in
terms
oflines
per millimetersresolvedandline
thickness
in
millimeters reproduced.the thinner the
lines
in
millimeterreproduced, the
better
the
result.The
results recorded representthe
mean of30
samplesfor both
measures,
that
is,
lines
permillimeter resolved andline
thickness
in
millimeters(c)
The
United States Air Force Three-Bar Target.
This
target
is
madeup
ofa setofbars
that
progressively
decrease in
sizeand spacing.
This
target
wasprintedfor
usein
resolutiontesting
in
the
same
way
asthe
Rochester Institute
ofTechnology
Test
Object.
When using
this target the
observeris
requiredto
identify
the
elementorset ofelements
in
the
series,
that
arein his/her
opinion,
barely
distinguishable.
In
this
case,
identification
ofthe
limit
of resolutionis
indefinite
andis
a matterof opinion.This factor involves
the
subjectivejudgement.
The United
States
airForce
Three-Bar
Target
was also scannedusing
the
Kodak Ektaprint Electronic
Publishing
System's scanning device.
After
printing
this target
it
wasfound
that the
numeralsidentifing
the
groups ofelements were
indistinguisable.
This
causeddifficulty
in
identification
ofthe
elements.Due
to
inaccuracies arising from
this
factor it
was
decided
to
disqualify
the
United
States Air Force
Three-Bar
Target from
this
experiment.This
density
scaleis
createdusing
the
patternsfor fill-in
as programmedin
the
softwarefor
the
Kodak Ektaprint Electronic
Publishing
System.
The
software produced
five different fill-in
patterns.These
patternsarereproducedon each of
the
paper samples.The
density
is
measured at each patchusing
the
Gretag
Reflection
Densitometer
D-142. Each
patch was measuredin
three
places andthe
averagerecorded.
This
experiment wasdone
to
find
if
there
wasany
difference in
the
density
ofeach patchbased
ondifferent
papertype.
The gray
scaledensity
wascalculated asthe
average of30
measuremments
for
each ofthe
32
steps.This
wasrepeatedfor
the
sixpaper
types
A, B,
C, D,
E
andF. This study
ofthe
gray
scaledensity
wasdirected
to tone
reproduction.The
density
is
alsoanindication
oftoner
transfer
in
this
experiment.The
Resolution
Test
Object
was measured at each ofthe
four
points.Thirty
measurements weremade ofthe
four
points andthe
averagecalculated.
This
was repeatedfor
each ofthe
six papertypes
A, B, C, D,
E
and
F. The
measurements ateach ofthe
four
pointsgave a measure ofthe
resolution
in lines
per millimeter.Line
thickness
in
milimetersis
calculatedusing
the tables that
accompany
the
Resolution
Test Object. Line
sharpness.
The
print samples were printedusing
the
Kodak Ektaprint Electronic
Publishing
System.
All
the
samples were printed atthe
sametime.
The
papers were marked
for
identification,
then
mixed andprinted;
so noparticular paper
type
was printed as a complete set.This
wasdone
to
minimise
the
effects on paper causedby
roomtemperature
andhumidity
aswell as
to
distribute any
discrepancies
resulting from
the
printing
process.The
temperature
in
the
room atthe time
was77F
(
degrees
fahrenheit)
andthe
relativehumidity
was32 % (percent).
Each
ofthe
papers:A, B, C, D,
E
andF
wheretested
for
the
following
characteristics
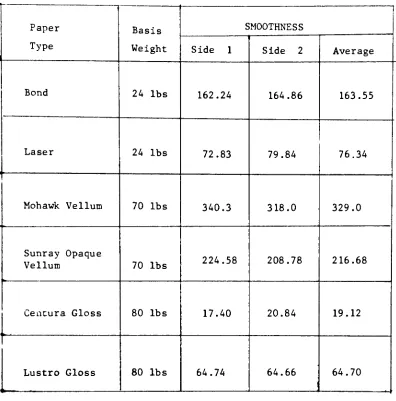
.Smoothness:
Smoothness
as afeature
ofpaperinfluences
the
functional
and appearanceproperties of paper.
It is
the
condition of paper surfacethat
comparesto
the
surface of glass.The levelness
orsmoothness of a paperdepends
uponthe
nature offibers
usedto
makethe
paper.Short fibers
give a smoothersurface
than
long
fibers. Stock
preparation andthe
mannerin
whichfibers
are
dispersed
during
paperformation
on papermachine wires alsohas
andistribution
andby
increased basis
weight.Other factors
controlling
smoothness
arethe
extent of wetpressing,
the
use ofsmoothing
presses,
the
amount of
filler in
the
paper andthe
degree
ofcalendering.Coating
andcalandering increase
smoothness.Use
ofcoated paperin
regularprinting is
increasing
because
the
coated sheetslook better
and printbetter^Smoothness
was measuredby
an air-leaktester.
There
aretwo
waysto
measure smoothness.
a.
One way is
to
measure smoothness asthe time
it
takes
in
secondsfor
agiven volume of air
to
leak
between
a smooth glasstest
plate andthe
papersurface,
undera specified air pressure.The
Gurley
Smoothness Tester
functions
underthis
method.b.
An instantaneous
and more accurate methodis
that
using
the
Sheffield
Smoothness
Meter. This
measuresthe
rate ofairflow between
the
annulargrove
in
the
uppergaugehead
andthe
paper's surface.Filtered
air,
underafixed low
pressureflows
upwardinto
atappered
glasscolumn,
andthen to
the
gauging head. From
the
gauging head it leaks
acrossthe
paper's surface.The
rateatwhichthe
airleaks
acrossthe
paper's surfaceis indicated
by
the
air-suspended
metering float in
the tappered
glasscolumn.The
rateatwhich
the
airleaks depends
onthe
smoothness ofthe
paper.This
methodreadily
measures smoothness asthe
rate of airleakage
overthe
paperis
theSheffield
Smoothness
Meter.
The
smoothnessis
recordedin
Sheffield
units.
A
decrease in
unitsindicates
anincrease
in
smoothness.(see
table
1,
page42)
Coated
papers werethe
smoothest.The
results were asfollows;
papersE,
19.12;
F, 64.70; B, 76.34; A, 163.55; D,
216.68
andC,
329.0
Sheffield units.Brightness:
Brightness is described
asbeing
the
percentage of reflectance at astandard
wavelenght;
457
nanometersin
the
standardtest.
This
is
ablue
wavelenght
that
mostreadily
detects
the
yellowing
of paper.Bleaching
contributes
to the
pulp
becoming
brighter
andwhiterdue
to
increased light
reflectance.
Fillers
arecommonly
usedto
increase
brightness.
Substances
n^d
to
givebrightness
to
paperarefor
example,
titanium
oxide andcalciumcarbonate
among
others.The
latter is in
the
form
ofgroundlimestone
mixedwith clay.
These
substancesnotonly impart
brightness,
but
alsoopacity
to
papers.**
Titanium
and caliciumcarbonate are alsoused
in
papercoating
materials
for
coated papers.Brightness is
aquality
that
affects printcontrast.
Brightness
is
measuredby
comparing
the
amount oflight
reflectedby
astandard.
The
instrument
usedwasthe
Technidyne
Brightimeter TM.
Model
S-4.
Brightness/Color/Fluorescence
Tester.
The
measureis
given as apercentage,
(see
table
2,
page43)
The
study
showed
paperD,
brightness
90.30
to
be
the
brightest. Papers
A,
89.75,
B
andC, 80.0,
E,
87
andF,
86
percent.Gloss:
Gloss is
an attribute of paper surfacethat
causesit
to
be shiny
orlustrous.
A
smooth paper surface reflectsthe
light
as parallelrays;
like
amirror
does,
causing
specular reflection.A
matte papersurface will causediffused
reflectionofthe
incident
light,
indicating
low
gloss.Gloss
ofpaperis
measured asthe
ratioofits
reflectedlighted
to
its incident light.
For
coatedprinting
papers,
glossis
measured at75 degrees from
the
prependicular.
Glossy
enamel papershave
gloss of morethan
40
units asdo
the
Centura
gloss andthe
Lustro
gloss.Gloss,
though
relatedto
smoothness,
is
anoptica] quality.Gloss
of a paper affectsthe
color ofprintbecause it
affects
the
way light is
reflectedfrom
the
ink. Gloss
variationin
paper mustbe kept
to
a minimumby
papermakersif
colorprinting is
to
be
uniformthrough
out ajob.
Gloss
was measuredusing
the
Gardner Multiangle
Glossmeter. United
percentage.
(see Table
3,
page44
)
Paper
E
wasfound
to
have
the
highest
gloss,
75.01
.Papers
F, 64.89,
B.
14.20, A, 9.90, D,
8.95
andC,
7.13
percent.Opacity:
Opacity
is
the
extentto
whichlight
transmissionis
obstructed.It is
animportant
considerationfor printing
papersas well as papersfor
otheruses.
Lack
ofopacity
will causeshow-through andin
doing
soreduceprintcontrast and print quality.'
Opacity
of a paperis determined
by
the total
light
transmittance,
that
is,
parallel anddiffused light
transmittance.
A
papercomponent
that
givesopacity
andbrightness
is
titaniumm
oxide.Blue-white
papershave
better
opacity
than
yellow -whitepapers.Laser
Plus
paperhas
this
blue-white
color.The
morelight absorbng
apaper,
the
better its
opacity.Paper opacity is
critical whenheavy
ink
coverageis
involved.
Opacity
is
measuredby
the
contrast and ratio method.It is
the
ratio ofthe
diffuse
reflectance ofa single sheet of paperbacked
by
ablack
light-absorbing
surface;
to
its
reflectancewhenbacked
by
ahighly
reflectivewhite surface.
Opacity
of papers rangefrom
afew
percentfor
transparent
papers
to
100
percentfor
paquepapers.page
45)
Papers
B,
Eand Fare
the
mostopaque,
95.0
percent.Papers
C,
94.0;
D,
93.5
andA,
90.0
percent.Porosity:
Porosity
is
the
volumn of airin
the
composition ofpaper.This
airvolumn
from 50
to
70
percentfor
bulky
papersto
15
to
35
percentfor