Int. J. Electrochem. Sci., 9 (2014) 7693 - 7711
International Journal of
ELECTROCHEMICAL
SCIENCE
www.electrochemsci.org
Synthesis of Some Novel Cationic Surfactants and Evaluation of
Their Performance as Corrosion Inhibitors for X-65 type
Carbon Steel under H
2S Environment
M. A. Migahed1 , A. M. Al-Sabagh1, E. G. Zaki1,*, H. A. Mostafa2, A.S. Fouda2
1
Egyptian petroleum Research Institute, Nasr City, Cairo (11727), Egypt
2
Chemistry Department, Faculty of Science, Mansoura University, Egypt
*
E-mail: [email protected]
Received: 20 July 2014 / Accepted: 10 October 2014 / Published: 28 October 2014
The inhibition efficiency of an sulphonamide derivative for X-65 type carbon steel in oil wells formation water under H2S environment has been studied by using potentiodynamic polarization and
electrochemical impedance spectroscopy (EIS) measurements. This sulphonamide derivative acts as a mixed-type inhibitor, which suppresses both cathodic and anodic processes by its adsorption on the electrode surface according to Langmuir adsorption isotherm, together with a slight positive shift in corrosion potential (Ecorr). The surface properties such as the critical micelle concentration (CMC), the
effectiveness of surface tension reduction (∏CMC), surface excess concentration (Ѓmax) and surface area
per molecule (Amin) have been determined by means of surface tension measurements.The obtained
results showed that the percentage inhibition efficiency (η%) was increased by increasing the inhibitor concentration until the critical micelle concentration (CMC) reached. Also, it was found that inhibition efficiency was increased by increasing both molecular size of the surfactant and introducing ethylene oxide units in the surfactant molecule. Potentiodynamic polarization curves indicated that the compounds under investigation act as mixed type inhibitors. The data obtained from electrochemical impedance spectroscopy (EIS) was analyzed to model the corrosion inhibition process through equivalent circuit. Finally, the nature of the protective film formed on carbon steel surface was analyzed by SEM and EDX techniques.
Keywords: Synthesis of chemical compounds, Corrosion inhibition, carbon steel , H2S Environment ,
Surface tension, Adsorption, Acid gases.
1. INTRODUCTION
the oil field appears as leak in tanks, casing, tubing, pipe line and other equipment. This process changes the base metal to another type of material. The most corrosive environment in oil field operations is caused by trace amounts of oxygen entering into a sour brine system, as well as the large amounts of carbon dioxide (CO2) and hydrogen sulfide (H2S) present in a deep oil well formation
water [2]. This type of corrosion forms a scale which varies from dense and adherent to loose porous and thick [3,4]. Inhibitors are widely used to prevent metal dissolution [5,6].
In the study of corrosion inhibition by surfactant, the critical micelle concentration (CMC) is the most important parameter. When the concentration of surfactant adsorbed on the solid surface is high enough, organized structures (hemi-micelles such as bi- or multilayer) are formed which decrease the corrosion reaction by blocking the metallic surface [7-12].
The organic inhibitors are generally adsorbed on the metal surface through physical adsorption or chemical adsorption, which reduce the reaction area susceptible to corrosive attack [13,14].
The efficiency of the inhibition film depends on inhibitor concentration and contact time with metal surface. In fact, introducing of ethylene oxides into surfactant molecule (i.e. ethoxylation) increases the inhibitive effect of surfactant [15]. The presence of these groups increases the solubility of surfactant and hence the extent of its adsorption on the metal surface increases, consequently its inhibitive action improves. Many studies on inhibition of the corrosion of carbon steel by some ethoxylated surfactants have been carried out in different corrosive environment [16–20]. Most literatures report that halide ions improve the inhibition performance of organic compounds through synergistic effect [21-24]. This synergistic effect is due to the improved surface coverage as a result of ion-pair interactions between organic cation and halide anion [21,24].
Human and industrial activities increase the generation of CO2, H2S and NH3. The sulphide ion
(S2-) has a tremendous affinity for many heavy metals.
H2S is a colorless gas with an offensive odor suggestive of bad eggs. It is a weak reducing
acid, readily soluble in water with the following ionic dissociation
H
2S = 2H
++S
2- (1)In acidic waters H2S is formed again and this process is repeated, enhancing corrosion [25].
FeS + 2H
+
=Fe
2 +
+H
2
S
(2)The formation of black metallic sulphide suspensions and/or deposits is characteristic of H2S
induced corrosion. H2S penetrates the lattice of some steels, makes them brittle and causes stress
corrosion cracking (SCC) failure in particular of high strength steel.
This work is aimed to examine corrosion inhibition efficiency of new synthesized surfactants on the corrosion rate of carbon steel in deep oil wells formation water under H2S environment. It is an
onset of a series of works currently under investigation in our labs.
2. EXPERIMENTAL
2.1. Chemical composition of X-65 type carbon steel alloy
Table 1. Chemical composition of carbon steel alloy.
Element C Si Mn P S Ni Cr Mo V Cu Al Fe
Content ( wt %)
0.09 0.22 1.52 0.01 0.05 0.04 0.02 0.004 0.002 0.02 0.04 reset
2.2. Deep oil well formation water
Deep oil wells formation water naturally exists in the reservoir rocks before drilling. Most oil field water contains a variety of dissolved organic and inorganic compounds. The major elements usually present are sodium, calcium, magnesium, chloride, bicarbonate and sulfate. The chemical composition of the oil wells formation water used in this investigation and its physical properties are shown in Table 2.
Table 2. Chemical composition and physical properties of deep oil well formation water used in this investigation.
Physical properties Unit Value
Density g/cm3 1.044
Turbidity FAU 263
PH 6.38
Salinity NaCl mg/l 12029
Conductivity μs/cm 29220
Total hardness mg/l 2910
Ionic species Value
Sulfate (mg/l) 6.5
Phosphate (mg/l) 0.771
Bi-carbonte (mg/l) 143
Chloride (mg/l) 7300
Sulfide (mg/l) 450
Iron ferrous (mg/l) 23
Iron, total (mg/l) 42
Calcium (mg/l) 800
Magnesium (mg/l) 364
Barium (mg/l) 105
Potassium (mg/l) 250
ZINC (mg/l) 1.359
[image:3.596.117.480.350.732.2]
reflux ( 140 0C)
4 h , 2 % ZnO cat.
2.3. Synthesis of the inhibitors 2.3.1. Preparation of sulfonamide
Into 500 ml three-necked flask equipped with mechanical stirrer, condenser, Den-Stark Trap and Dropping funnel, 2 moles of Linear alkyl benzene sulphonic acid (LABS) was reacted with 1 mole pentaethylene hexamine ( PEHA) in the presence of (100 ml) xylene as a solvent and 2% ZnO as a catalyst for 4 h reflux at 140 °C. Then, after complete removal of the theoretical amount of water of the reaction (36 ml), the solvent was stripped out using a rotary evaporator. The product dissolved in (30ml) isopropanol.
2.3.2. Ethoxylation of amide
In a 250 ml four-neck flask equipped with a condenser, magnetic stirrer, thermometer, ethylene oxide gas inlet and outlet nozzles as illustrated in , 2–3 droplets of triethylamine were added to 1 mole sulphonamide derivative (848 g) with stirring at 80–90 0C for about 15 min., then ethylene oxide gas was allowed to pass over the sulphonamide derivatives melt under a controlled pressure of around 86– 88 cm Hg with stirring [26-29].
The temperature was raised gradually up to reflux temperature and then the reaction mixture was refluxed for about 3 h. After that it was cooled and flashed off every 0.5 h. The progress of the reaction was evaluated by monitoring the gained weight as a result of insertion of ethylene oxide units till reaching to the weight equivalent to insertion of ten ethylene oxide units to the sulphonamide derivative.
2.3.3. Qaternarization
The preparation of some quaternary ammonium bromide by refluxing four mole of alkyl bromides, namely: chloro dodecane with one mole of ethoxylated compounds in acetone as a solvent for 18h. The produced quaternary ammonium chloride was recrystallized three times in ethanol then washed with diethyl ether. Then 1 mole of potassium hydroxide in ethanol was refluxed with 1 mole of the produced quaternary ammonium bromide salts. The mixture was then cooled for 1h and filtered. The filtrate then was concentrated to yield quaternary ammonium chloride.
The steps of synthesis process are summarized in Scheme 1.
S
O OH
C12H25
O
2 NH2CH2CH2NHCH2CH2NHCH2CH2NHCH2CH2NHCH2CH2NH2
LABS
S O
O
C12H25
NHCH2CH2NHCH2CH2NHCH2CH2NHCH2CH2NHCH2CH2NH S
O
O
C12H25
N
-[2-(2-{2-[2-(2-Benzenesulfonylamino-ethylamino)-ethylamino]-ethylamino}-ethylamino)-ethyl]-4-dodecyl-benzenesulfonamide (I)
O n
0.3g Na 1600C
Ethylene oxide
S O O
C12H25
NHCH2CH2NHCH2CH2NHCH2CH2NHCH2CH2NHCH2CH2NH S
O O
C12H25
S O O
C12H25
NHCH2CH2NCH2CH2NCH2CH2NCH2CH2NCH2CH2NH S
O O
C12H25
CH2
CH2O
H
)n
( CH2CH 2O
H
)n
( CH2CH2
O
H
)n (
CH2 CH2O
H )n ( (II) S O O
C12H25
NHCH2CH2NCH2CH2NCH2CH2NCH2CH2NCH2CH2NH S
O
O
C12H25
CH2 CH2
O
H
)
n( CH2CH
2O
H
)
n( CH2CH2
O H )n ( CH2 CH2 O H
)
n (C12H25
C12H25 C12H25 C12H25
Cl 4
(III)
Scheme1
2.3.4. FTIR spectroscopic analysis
FTIR spectrum of sulphonamide shows bands at 2922.25 and 2857.57 cm-1 corresponds to the asymmetric and symmetric (–CH2 ), respectively; N–H stretching at (3255.97, 3472.98) cm-1; N–H
appeared at 1008.35 cm-1 for the (S–N) bond . All the above absorption bands confirm the sulphonamide was successfully prepared. The appearance of new characteristic absorption band for compound II at 3434.23 cm-1 assigned to the primary alcohol (–OH) of ethylene oxide units. The ethereal band (C–O–C) appeared at 1123.82 cm-1 which confirms that the ethoxylated derivatives were successfully prepared.
3 7 8 8 .3 6
Wavenumbers( cm-1)
500 1000 1500 2000 2500 3000 3500 4000%
tr
a
ns
m
itt
a
nc
e
0 20 40 60 80 100 3 3 5 4 .1 3 2 9 2 8 .1 4 1 4 5 3 .80 10
8 8 .9 8 6 7 1 .6 9 1 6 6 5 .0
9 138
[image:6.596.132.447.195.449.2]1 .2 6 8 8 2 .18
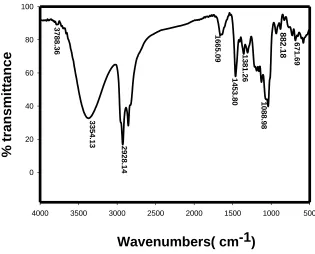
Figure 1. FTIR spectrum of compound III.
Fig. 1 shows the appearance of new characteristic absorption bands for compound III at 2922.25 and 2857.57 cm-1 for the asymmetric and symmetric (–CH2), 727 cm-1 for (CH2)n,2900, 1303
cm-1 for CH3, 1072, 655 cm-1 for the asymmetric and symmetric stretching N+- C4
2.3.5. 1H NMR spectrum spectroscopic analysis
The chemical shift at б (0.762) for 1H proton (a) –CH3, the chemical shift б (1.203) for 1H
protons (b) –CH2 of alkyl chain, the chemical shift at б (1.62) for 1H protons (c) –CH2 of alkyl chain
near benzene ring. The chemical shift at б (2.26) for 1
H proton (d) –CH2 adjacent to benzene ring, the
chemical shift at б (2.52) and (2.85) for 1
H protons (e) and (f) –HN–CH2–CH2–NH– of amine part
respectively. The chemical shifts between б (6.9 – 7.6) for 1
H protons (g) and (h) of benzene ring. All the above chemical shifts confirm the ethoxylated sulphonamide compound II was successfully prepared.
The chemical shifts at б (2.7) for 1
H proton (a) of the –CH2 group in the first ethylene oxide
unit attached to 3°rd N, the chemical shift б (3.8) for 1
and the chemical shift at б (3.96) for 1
H protons (c) –CH2 group of E.O unit near terminal (–OH). The
above chemical shifts confirm that the ethoxylated derivatives were successfully prepared.
All the above chemical shifts confirm the cationic compound III was successfully prepared . The chemical shifts at б (2.7) for 1
H proton (a) of the –CH2 group in the first ethylene oxide unit
attached to 3°rd N, the chemical shift б (3.8) for 1
H protons (b) –CH2 group of repeated ethylene oxide
units and the chemical shift at б (3.96) for 1
H protons (c) –CH2 group of ethylene oxide unit near
terminal (–OH). The chemical shifts at б (3.24) for 1H proton of the –CH2 group in the aliphatic group
dodecyl.
The above chemical shifts confirm that the cationic derivatives were successfully prepared. The data of 1H NMR spectra confirmed the expected hydrogen proton distribution in the synthesized cationic surfactants.
2.4. Testing solution
The testing solution of this study is an oil wells formation water with the above mentioned chemical composition. H2S was produced by reaction of 3.53 mgL-1 sodium sulfide Na2S with 1.7
mgL-1 acetic acid.
2.5. Potentiodynamic polarization measurements
Electrochemical measurements were carried out using Volta lab80 (Tacussel-radiometer PGZ402) controlled by Tacussel corrosion analysis software model (Volta master 4). Platinum electrode was used as auxiliary electrode. All potentials were measured against saturated calomel electrode (SCE) as a reference electrode. All measurements were carried out in air saturated solutions and at ambient temperature (298 K). Polarization curves were recorded at a constant sweep rate of 2mVs-1. The values of corrosion current densities were calculated using Tafel extrapolation method by taking the extrapolation interval of 250 mV with respect to Ecorr.
2.6. Electrochemical impedance spectroscopy (EIS)
2.7. Surface tension measurements
The surface tension ( γ) was measured using Kruss K6 Tensiometer type, a direct surface tension measurement, using ring method for various concentrations of the investigated surfactants.
2.8. Scanning electron microscopy
Immersion corrosion analysis of carbon steel samples in oil wells formation water with and without the optimal concentration of the inhibitor (III) was performed using SEM. In order to study the surface morphology, the samples were subjected to SEM immediately after the corrosion tests using Joel JSM-5410 SEM
2.9. Energy dispersive analysis of X-rays (EDX)
EDX system attached with a JEOL JSM-5410 scanning electron microscope was used for elemental analysis or chemical characterization of the film formed on carbon steel surface before and after applying the synthesized compound III.
3. RESULTS AND DISCUSSION
3.1. Potentiodynamic polarization measurements
A conventional three-electrode glass cell, consisting of steel working electrode (WE), a platinum counter electrode (CE), and a saturated calomel electrode (SCE) as a reference electrode, was used for electrochemical measurements. All electrochemical measurements were carried out using Voltalab 80 (Tacussel-radiometer PGZ 402) and controlled by Tacussel corrosion analysis software model Voltamaster 4. The working electrode was first immersed into the test solution for 1 h to establish a steady state open circuit potential (Eocp). After determination the open circuit potential,
potentiodynamic polarization curves were obtained with a scan rate of 1mVs−1 in both cathodic and anodic potentials to investigate the polarization behavior..
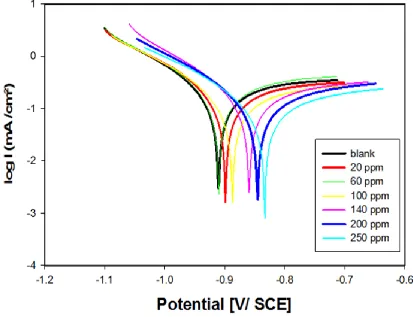
Fig. 2 show the cathodic and anodic polarization curves of carbon steel immersed in deep oil wells formation water under H2S environment in the absence and presence of different concentrations
of compound III as a representative sample.It is well known that during the corrosion of carbon steel in H2S environment .corrosion product film will formed on the steel surface .the formation of corrosion
product film following reactions: The two partial reactions are Anodic reaction:
Fe Fe 2 2e (3) Cathodic reaction:
H2S (aq) H2
Fe FeS
(5)
Thus in the presence of H2S, iron dissolution occurs forming ferrous sulfide as first corrosion
product. This protective layer will be destroyed if high concentration of H2S gas is present as
indicated in equation 2.
Electrochemical parameters such as corrosion potential (Ecorr.), corrosion current density (icorr.),
cathodic and anodic Tafel slopes (bc and ba) and polarization resistance (Rp) were calculated [31].
Figure 2. Potentiodynamic polarization curves (E – log I relationship) of carbon steel in formation water in the absence and presence of different concentrations of compound III.
From the obtained polarization curves, it is clear that the corrosion current densities (icorr.) were
decreased with increasing concentration of compound III with respect to the blank (inhibitor free solution). The degree of surface coverage (θ) and the percentage inhibition efficiency (η%) were calculated using the following equations:
(6) (7)
where i0 and i are the corrosion current densities in the absence and presence of the inhibitor,
[image:9.596.90.503.196.513.2]
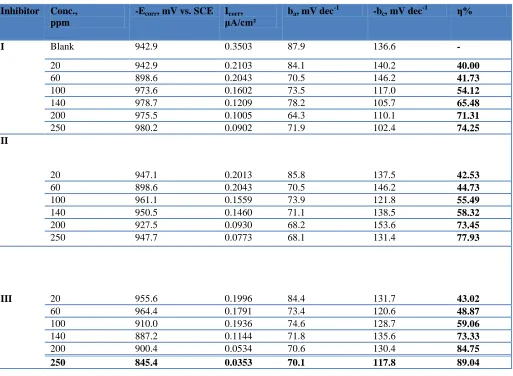
Table 3. data obtained from potentiodynamic polarization measurements of carbon steel in formation water solution in the absence and presence of various concentrations of compounds I, II and III at 298 K.
Inhibitor Conc., ppm
-Ecorr, mV vs. SCE Icorr,
μA/cm²
ba, mV dec-1 -bc, mV dec-1 η%
I Blank 942.9 0.3503 87.9 136.6 -
20 942.9 0.2103 84.1 140.2 40.00
60 898.6 0.2043 70.5 146.2 41.73
100 973.6 0.1602 73.5 117.0 54.12
140 978.7 0.1209 78.2 105.7 65.48
200 975.5 0.1005 64.3 110.1 71.31
250 980.2 0.0902 71.9 102.4 74.25
II
20 947.1 0.2013 85.8 137.5 42.53
60 898.6 0.2043 70.5 146.2 44.73
100 961.1 0.1559 73.9 121.8 55.49
140 950.5 0.1460 71.1 138.5 58.32
200 927.5 0.0930 68.2 153.6 73.45
250 947.7 0.0773 68.1 131.4 77.93
III 20 955.6 0.1996 84.4 131.7 43.02
60 964.4 0.1791 73.4 120.6 48.87
100 910.0 0.1936 74.6 128.7 59.06
140 887.2 0.1144 71.8 135.6 73.33
200 900.4 0.0534 70.6 130.4 84.75
250 845.4 0.0353 70.1 117.8 89.04
A careful inspection of the polarization curves indicated that Tafel lines are shifted to more negative and more positive potentials for the anodic and cathodic processes, respectively relative to the blank curve. This means that the selected compound acts as mixed type inhibitor, i.e., promoting retardation of both anodic and cathodic discharge reactions. Also, the slopes of the cathodic and anodic Tafel lines are approximately constant and independent on the inhibitor concentration. This means that, the selected inhibitor has no effect on the metal dissolution mechanism. Complete data obtained from polarization measurements are summarized and listed in Table 3. The results indicate that the percentage inhibition efficiency (η%) of compound III is greater than that of compounds I and II. This could be attributed to the application of along chain alkyl halide which promotes stronger adsorption film and hence more protective layer and higher inhibition efficiency.
3.2. Electrochemical impedance spectroscopy (EIS)
presence of various concentrations of compound III as a representative sample was investigated by EIS technique. Nyquist plot is shown in Fig. 3.
Figure 3. Nyquist plots for carbon steel in oil wells formation water in the absence and presence of different concentrations of compound III.
Table 4. data obtained from electrochemical impedance spectroscopy (EIS) measurements of carbon steel in formation water solution in the absence and presence of various concentrations of compounds I, II ,III
Inhi bitor
Conc., ppm coefficient Rf,
Kohm.cm2
Cf,
µF/cm2
Rt, kΩcm2 Cdl, μFcm-2 η %
I Blank 0.98 --- --- 3.40 124. ---
20 0.99 0.28 50.1 5.50 93.58 38.18
60 0.98 0.35 45.2 6.94 89.92 50.7
100 0.96 0.42 39.6 9.31 85.38 63.44
140 0.97 0.45 33.5 10.47 68.01 67.52
200 0.99 0.48 25.6 12.0 59.71 71.66
250 0.98 0.50 23.7 13.1 39.91 74.04
II 20 0.99 0.33 52.2 5.6 46.13 39.28
60 0.96 0.37 46.2 7.15 46.13 52.44
100 0.97 0.44 40.5 9.7 39.93 64.95
140 0.99 0.47 34.5 11.1 37.59 69.36
200 0.98 0.49 28.2 13.0 29.01 73.85
250 0.96 0.52 26.8 14.5 15.34 76.55
[image:11.596.138.468.136.408.2] [image:11.596.41.558.532.766.2]
60 0.97 0.38 47.3 8.19 43.36 58.48
100 0.96 0.45 41.7 9.74 39.90 64.94
140 0.98 0.48 35.6 11.7 36.18 70.9
200 0.99 0.51 28.4 13.63 31.93 75.05
250 0.98 0.53 27.2 17.9 28.35 81.00
It is clear from plots that the impedance response of carbon steel in formation water was significantly changed after the addition of the inhibitor molecules. Various parameters such as the charge transfer resistance Rt, double layer capacitance Cdl and percentage inhibition efficiency η%
were calculated according to the following equations and listed in Table 4. The values of Rt were given
by subtracting the high frequency impedance from the low frequency one as follows [32]: (8)
The values of Cdl were obtained at the frequency fmax ,at which the imaginary component of the
impedance is maximal-Zmax using the following equation:
(9)
and percentage inhibition efficiency η% were calculated from the values of Rt using the
following equation:
(10)
where Rt and Rt(inh.) are the charge transfer resistance values in the absence and presence of
inhibitor, respectively. Increasing the value of charge transfer resistance (Rt) and decreasing the value
of double layer capacitance (Cdl) by increasing the inhibitor concentration indicate that the surfactant
molecules inhibit corrosion rate of carbon steel in deep oil wells formation water by adsorption mechanism [33]. For analysis of the obtained impedance spectra, the equivalent circuit (EC) was obtained using Boukamp program as shown in Fig. 4, where RS is the solution resistance , Rt is the
charge transfer resistance ,Cdl is the electrochemical double layer capacitance , Rf is the film resistance
and Cf is the film capacitance. From EIS data it was found that the percentage inhibition efficiency of
[image:12.596.176.433.597.717.2]compound III is greater than that of compounds I and II. Thereby, agreeing with aforementioned results potentiodynamic polarization measurements.
3.3. Surface tension measurements
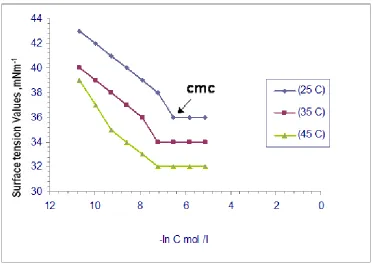
[image:13.596.113.486.182.450.2]The CMC values of the synthesized surfactants were determined at various temperatures from the change in the slope of the plotted data of surface tension () versus the natural logarithm of the solute molar concentration; ln C, as shown in Fig. 5. The data obtained from surface tension are summarized and listed in table 5.
Figure 5. Surface tension vs. log C of compound III at different temperatures.
Table 5. Surface active properties of the synthesized compounds I, II.III
Corrosion Inhibitor
Temp CMC
mole/dm3
cmc
mN/m
max x10
-7
,
mol/m2
Amin,n
m2
CMC Gomic
kJmol-1
Goads
kJ mol-1
I 25C 7.47x10⁻⁴ 36 9.48x10⁻¹¹ 175 36.3 -18.13 -21.96
35C 4.63x10⁻⁵ 34 8.49x10⁻¹¹ 195.4 38.3 -25.14 -29.64
45C 2.49x10⁻⁵ 33 9.72x10⁻¹¹ 170.7 37.3 -26.7 30.73-
Corrosion Inhibitor
Temp CMC
mole/dm3
cmc
mN/m
max x10-7,
mol/m2
Amin,n
m2
CMC Gomic
kJmol-1
Goads
kJ mol-1
II 25C 1.01x10⁻³ 35 1.34x10⁻¹⁰ 123 39.3 -17.38 -20.29
35C 2.49x10⁻⁴ 33 1.38x10⁻¹⁰ 119.5 39.3 -20.9 -23.7
45C 6.13x10⁻⁵ 31 1.2x10⁻¹⁰ 136.7 40.3 -24.43 27.8-
Corrosion Inhibitor
Temp CMC
mole/dm3
cmc
mN/m
max x10-7,
mol/m2
Amin,n
m2
CMC Gomic
kJmol-1
Goads
kJ mol-1
III 25C 1.49x10⁻³ 36 7.8x10⁻¹¹ 300 36.3 -16.13 -22.70
35C 7.47x10⁻⁴ 34 6.9x10⁻¹¹ 348 38.3 -18.43 -26.47
[image:14.596.172.426.241.642.2]
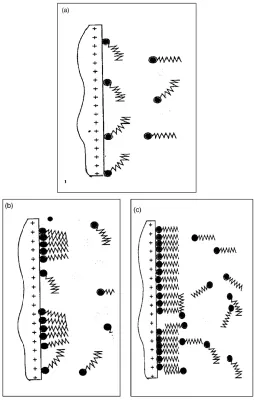
The critical micelle concentration (CMC) is the point in concentration at which it becomes thermodynamically favorable for surfactant molecules in solution to form aggregates (micelles) in order to minimize interaction of either their head groups or their tail groups with the solvent equation [34]. For the under investigation poly ethoxylated nonionic surfactant and cationic molecules in water, micellization is due to entropic considerations. Water molecules in close proximity to the hydrophobic group of the surfactant molecules take on a certain ordered configuration which is entropically unfavorable. Once the surfactant concentration reaches a certain level (CMC), the water structure forces aggregation of the hydrophobic tail groups forming surfactant micelles as illustrated in the schematic diagram Fig. 6.
Figure 6. Schematic representation of the inhibitor adsorption on carbon steel surface. (a) Adsorption as single molecule at low concentration. (b) Hemimicelle formation at higher concentration. (c) Formation of multi-layers at very high concentration.
3.4.Standard free energy of micellization vs. free energy of adsorption
Standard Free energy of micellization (∆G0mic) for the investigated surfactants was calculated
from the following equation [35]:
0
(11)
While standard free energy of adsorption (∆G0ads) for the synthesized surfactants were
calculated from the equation: ᵒ
(12)
where Kads is the adsorption equilibrium constant.
Table 6. Standard free energy of micellization (Gomic) and standard free energy of adsorption
(Goads) as obtained from surface tension measurements and the Langmuir adsorption isotherm
model respectively.
Corrosion Inhibitor Temp. Free energy of micellization
Gomic (kJ mol-1)
Free energy of adsorption
Goads(kJ mol-1)
I 25C -18.13 -21.96
35C -25.14 -29.64
45C -26.7 -30.73
II 25C -17.38 -20.29
35C -20.9 -23.7
45C -24.43 -27.8
III 25C -16.13 -22.70
35C -18.43 -26.47
45C -20.88 -29.34
The obtained values of standard free energy of micellization (∆G0
mic) and standard free energy
of adsorption (∆G0
ads), as summarized in Table 6, indicated that compound I with the lowest molecular
[image:15.596.36.562.360.577.2]
3.5. Scanning electron microscopy (SEM)
A
B
[image:16.596.180.419.100.614.2]C
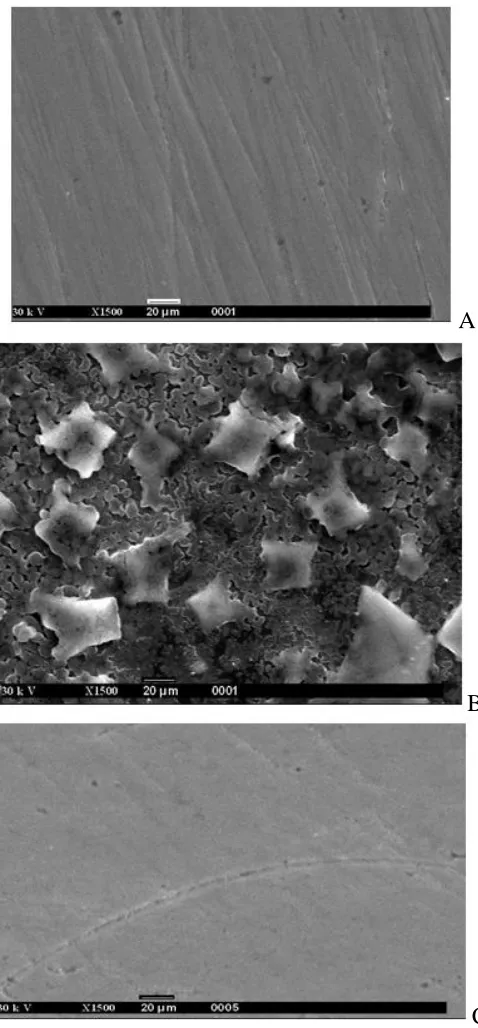
Figure 7. SEM of the carbon steel surface: (a) polished sample, (b) after immersion in the formation water and (c) after immersion in the formation water in the presence of 250 ppm of compound III
resulting scanning electron micrographs reveal that, the surface was strongly damaged in the absence of the inhibitor, but in the presence of 250 ppm of the compound III, there is less damage in the surface. This confirms the observed high inhibition efficiency of compound III at this concentration.
3.6. Energy dispersive analysis of X-rays (EDX)
A
B
[image:17.596.173.425.176.619.2]C
Figure 8. EDX of the carbon steel surface: (a) polished sample, (b) after immersion in the formation water and (c) after immersion in the formation water in the presence of 250 ppm of compound III.
samples in Figs. 8a and 8b. This decreasing of the Fe band is indicated that strongly adherent protective film of compound III formed on the polished carbon steel surface, which leads to a high degree of inhibition efficiency [37]. The oxygen signal apparent in Fig. 8b is due to the carbon steel surface exposed to the formation water in the absence of compound III. Therefore, EDX and SEM examinations of carbon steel surface support the results obtained from chemical and electrochemical methods that the synthesized surfactant inhibitors are a good inhibitors for carbon steel in oil wells formation water.
The results of both SEM and EDX techniques confirm the formation of a good protective layer on the surface of carbon steel in the presence of 250 ppm of the inhibitor (III) .
4. CONCLUSIONS
The main conclusions of this paper can be summarized in the following items:
1- All the investigated surfactants act as effective corrosion inhibitors for carbon steel in oil well formation water under H2S environment.
2- The percentage inhibition efficiency (η%) of surfactants increases by introducing number of ethylene oxide units into inhibitor molecule.
3- EIS data indicated that the value of charge transfer resistance (Rt) increased by increasing
the inhibitor concentration while, the value of electrochemical capacitance (Cdl) decreased.
4- The potentiodynamic polarization curves indicated that the inhibitor molecules inhibit both anodic metal dissolution and also cathodic oxygen reduction, so that the undertaken surfactants classified as mixed type inhibitors.
5- The critical micelle concentration considers a key factor in determining the effectiveness of surfactants as corrosion inhibitors.
6- The inhibition mechanism is attributed to the strong adsorption ability of the selected surfactants on carbon steel surface, forming a good protective layer, which isolates the surface from the aggressive environment as confirmed by SEM and EDX techniques..
ACKNOWLEDGMENTS
This work has been financially supported by Egyptian Petroleum Research Institute (EPRI) fund. The authors are greatly thanked to EPRI fund and support.
References
1. B. Ridd, T.J. Blakset, D. Queen, Corrosion, NACE, Paper No (78), Houston, Texas(1998). 2. F.N. Speller, Corrosion Causes and Prevention, McGraw-Hill, New York,(1951).
3. O.A. Tomas, P.R. Alan,Production Operations, vol. 2, Oil and Gas Consultants International, Inc., Tulsa,(1985).
6. M. ElAzhar, B. Mernari, M. Traisnel, F. Bentiss, M. Lagrene´ e, Corros. Sci., 43 (2001) 2229. 7. M. Houyi, C. Shenhao, Y. Bingsheng, Z. Shiyong, L. Xiangqian, Corros. Sci. 45 (2003) 867. 8. M.L. Free, Corros. Sci. 44 (2002) 2865.
9. M.L. Free, Corrosion 58 (2002) 1025.
10.R.F.V. Villamil, P. Corio, J.C. Rubim, S.M.L. Agostinho, J. Electroanal. Chem. 472 (1999) 112. 11.R.F.V. Villamil, G.G. Cordeiro, J. Matos, E. D’Elia, S.M.L. Agostinho, Mater. Chem. Phys. 78
(2002) 448.
12.R.F.V. Villamil, P. Corio, J.C. Rubim, S.M.L. Agostinho, J. Electroanal. Chem. 535(2002)75. 13.I.B. Obot, N.O. Obi-Egbedi, S.A. Umoren, Corros. Sci. 51 (2009) 1868–1875.
14.L. Fragoza-Mar, O. O.Xometl, M.A. Aguilar, E.A. Flores, P. A.Lozada, F. J.Cruz, ,Corros. Sci. 61 (2012) 171–184.
15.M.M. Osman, A.M.A. Omar, A.M. Sabagh Mater. Chem. Phys., 50 ,(1997) 271. 16.F. Hanna, G.M. Sherbini, Y. Brakat, Corros. J., 24(1989) 269.
17.M.M. Osman, M.N. Shalaby, Mater. Chem. Phys. ,77 (2002) 261.
18.A.M. Alsabagh, M.A. Migahed, H. S. Awad,Corros. Sci., 48 ,(2006):813.
19.M.A. Migahed, M. Abd-El-Raouf, A.M. Al-Sabagh, H.M. Abd-El-Bary, Electrochim. Acta, 50 (2005) 4683.
20.M.A. Migahed, H.M. Mohamed, A.M. Al-Sabagh, Mater. Chem. Phys. ,80 (2003)169. 21.X. Wang, H.Yang, F. Wang, Corros. Sci. 55 (2012) 145–152.
22.M.A. Ameer, A.M. Fekry, Prog. Org. Coat. 71 (2011) 343–349.
23.M.K. Pavithra, T.V. Venkatesha, K. Vathsala, K.O. Nayana, Corros. Sci. 52 (2010) 3811–3819. 24.A. Y. Musa, A. B. Mohamad, A. A. H. Kadhum, M. S. Takriff, L. T. Tien, Corros. Sci. 53 (2011)
3672–3677.
25.M. S. Wiener, B. V. Salas, M. Quintero-Nu´n˜ez and R. Zlatev, Corr. Eng., Sci. and Techn. 41 (2006)( 3) 221.
26.W. Hreczuch, A. KozlekTens. Surf. Det. ,38 (2) ,(1996) 621. 27.W. HrecZuch, A. Kozlek, Tens. Surf. Det. ,38 (1996)621.
28.N.M. Van Os,Non-Ionic Surfactant ‘‘Organic Chemistry’’, Surfactant Science Series, vol. 72, Marcel Dekker, New York. (1998).
29.R.F. Lang, P.D. Diaz, D. Jocobs, J. Surf. Det. ,7 (1999)503.
30. J. Tang, Y. Shao ,J. Guo c, Tao Zhang, G. Meng, F. Wang , Corrosion Science 52 (2010) 2050–2058
31.Q.B. Zhang, Y.X. Hua ,Electrochim. Acta ,54 ,(2009) 1881. 32.A.P. Yadav, A. Nishikata, T. Tsuru,Corros. Sci. ,46 ,(2004) 169. 33.K.F. Khaled,Appl. Surf. Sci., 252 (2006) 4120.
34.M.A. Migahed, Prog. Org. Coat., 54 (2005) 91–98
35.J. Rosen, Milton Surfactants and Interfacial Phenomena, third ed., John Wiley & Sons Inc,(2004). 36.ASTM E 45-87, vol. 11,(1980) ASTM, Philadelphia, PA, 125.
37.M.A. Amin, J. Appl. Electrochem. ,36 (2006)215.