Int. J. Electrochem. Sci., 10 (2015) 10093 - 10103
International Journal of
ELECTROCHEMICAL
SCIENCE
www.electrochemsci.org
Electrochemical Detection of Dopamine in the Presence of
Ascorbic Acid Using GS@Mn
3O
4/Nafion Film Modified
Electrode at a Low Working Potential
Guowen He1,2, *, Dan Wu1,2, Guqing Xiao1,2 1
College of Chemical and Enviromental Engineering, Hunan City University, Yiyang, 413000, PR China
2
Institute of Polymer Materials and Engineering, Hunan City University, Yiyang, 413000, PR China *
E-mail: [email protected]
Received: 10 December 2014 / Accepted: 7 September 2015 / Published: 4 November 2015
Graphene sheets (GS)@manganic manganous oxide (Mn3O4) nanocomposites were prepared via a simple solvothermal process. GS@Mn3O4/nafion (Nf) film modified glassy carbon electrode (GCE) was fabricated and applied for the detection of dopamine (DA) without the interference of ascorbic acid (AA) at the low working potential. The prepared nanocomposites (GS@Mn3O4) were characterized by X-ray diffraction (XRD) and fourier transform infrared spectroscopy (FT-IR), and the morphology of different electrodes was characterized by scanning electron microscopy (SEM). The electrochemical properties of the modified electrode (GCE│GS@Mn3O4/Nf) were investigated by electrochemical impedance spectroscopy (EIS), cyclic voltammetry (CV) and current-time method (i-t curve). Under the optimized experimental conditions, the i-t curve showed a linear dependence on DA concentrations ranging from 1.0×10⁻⁶ to 1.3×10⁻³ M (R=0.9985) with a detection limit of 8.0×10⁻⁸ M (S/N=3). The proposed method was used to detect DA in real pharmaceutical samples using the standard addition method without additional sample pre-treatment with satisfactory results, which showed great promise for screen-determination of DA in real samples.
Keywords:GS@ Mn3O4; Dopamine; Low working potential
1. INTRODUCTION
Various analytical methods including fluorometry [3, 4], chromatography [5], electrochemiluminescence [6] and electrochemical technique (ET) [7-9] have been reported for DA detection. Among those methods, ET is considered as a useful approach owing to its high sensitivity, cost-effectiveness, ease of operation and capability of in situ detection. From the molecular structure, it is apparent that DA is an easily oxidizable compound. Thus, ET based on its anodic oxidation has attracted growing interests [10, 11]. Unfortunately, DA often encounter interferences from other common co-existing protocols such as ascorbic acid (AA), which is readily oxidized on the working electrode. Furthermore, AA and DA are oxidized at nearly the same working potential. Hence an overlapping voltammetric response for the oxidation of a mixture of AA and DA is usually obtained in the bare electrode [12, 13]. Therefore, the selective detection of DA is other major goal in this research field. As such, bare electrodes modified with various materials and approaches have been developed to solve these problems, in order to decrease the overpotential, enrich the substance and promote the electron transfer rate, including sodium dodecyl sulfate-modified carbon paste electrodes [14], MnOOH nanobelt modified electrode [15], cibacron blue/poly-1,5-diaminonaphthalene composite film [16], carbon nanotubes-ionic liquid gel modified electrode [17] and MnO2 nanowires/chitosan modified gold electrode [18]. Although all the mentioned materials and approaches showed good signals and performance, novel materials, especially novel nanocomposites are still needed to develop highly selective and sensitive DA sensing platform. For the nanocomposites have some synergistic effects (eg. high surface area, increased electron transport, low detection limit and better signal-to-noise ratio) compared with single nanoparticle [19-21].
Graphene sheets (GS) has been considered as a ‘‘rising-star’’ and drawn considerable attention for its fascinating properties and wide applications [22]. In more recently, GS-based nanocomposites has been developed as an advanced nano-material for constructing various electrochemical DA sensors [22-25]. Manganic manganous oxide (Mn3O4) is a very useful transition metal oxide, has been widely used in various fields such as lithium-ion batteries [26], supercapacitors [27, 28] and catalyst [29], attributing to its low toxicity, low cost, good electrochemical activity and large abundance. However, up to date, there is no report on the electroanalysis performance of Mn3O4 modified electrode towards DA determination. Nafion (Nf) is a large biopolymer and has been applied to disperse different nanomaterials on the surface of solid substrates. The interference of AA can be partly avoided by coating the electrode surface with Nf film, but the use of Nf alone obviously can not solve the sensitivity [30].
2. EXPERIMENTAL
2.1. Reagents
Graphite powder was purchased from green battery material limited company (Changsha, China). Nf solution, Mn(Ac)2·4H2O and other chemicals were of analytical-reagent grade and used without further purification were obtained from sinopharm medicine holding co., ltd (Shanghai, China). L-Ascorbic acid (AA) and Dopamine hydrochloride (DA) were obtained from Sigma-Aldrich and used as received without further purification. The 0.1 M phosphate buffer solution (PBS) at various pH values was prepared by mixing the stock solutions of 0.1 M Na2HPO4 and 0.1 M NaH2PO4 with different proportion. Doubly distilled water (18.2 MΩ) was used throughout.
2.2. Apparatus
Electrochemical measurements were performed on a CHI 660D electrochemical workstation (CHI Instruments, Shanghai, China) using a classical three electrode configuration of a GS@Mn3O4/Nf modified GCE (3 mm diameter) as the working electrode, a platinum wire as the auxiliary electrode and a saturated calomel electrode (SCE) as the reference electrode. The morphology of different electrodes was characterized by the scanning electron microscopy (SEM, Hitachi S-4800N). The fourier transform infrared (FT-IR) spectroscopy of the products was recorded with a KBr pellet on the IR prestige-21 (Shimadzu) spectrometer. The x-ray powder diffractometer (XRD, Rigaku Ultima IV, Cu Kα radiation) was used to determine the phase purity and crystallization degree of nanoparticles.
2.3. Preparation of the GS@Mn3O4 nanocomposites
In the first step, graphite oxide was obtained from natural graphite by a modified Hummers method [31]. Then, exfoliation of graphite oxide to graphene oxide (GO) was achieved by ultrasonication of the dispersion for 30 min. The 0.5 mg/mL homogeneous GO suspension was prepared by ultrasonication of 13.5 mg GO in 27 mL 9:1 ethanol/H2O mixed solvent for 3 h. Then 2.7 mM of Mn(AC)2·4H2O was dissolved in the GO suspension by stirring. Finally, the resulting solution was transferred into a 30 mL Teflonlined stainless steel autoclave, and treated at 180 ℃ for 10 h. After the reaction, the autoclave was allowed to cool to room temperature. The precipitate was washed with alcohol and water several times, then freeze dried for 24 h, and the final product was denoted as GS@Mn3O4 nanocomposites.
2.4. Fabrication of the GS-Mn3O4/Nf modified GCE
distilled water in turn. After being cleaned, 5.0 μL of the resulting GS@Mn3O4/Nf dispersion was dropped onto the surface of the GCE and dried under the infrared lamp till dry (labeled as GCE│GS@Mn3O4/Nf). After modification, the modified electrode was thoroughly rinsed with water and kept at room temperature for further use. For comparison, a Nf solution (0.2 wt%) without GS@Mn3O4 nanocomposites was deposited onto other GCE to fabricate the Nf film modified GCE (labeled as GCE│Nf).
3. RESULTS AND DISCUSSION
3.1. Characterization of the synthesised GS@Mn3O4 nanocomposites
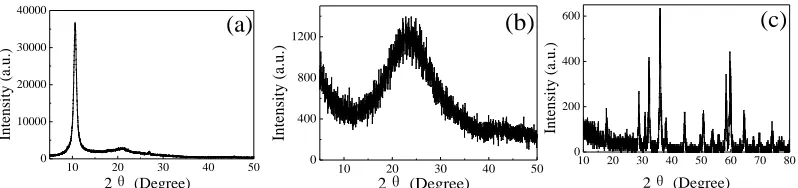
The crystal structures of GO, GS and GS@Mn3O4 were determined by XRD. In Fig.1-a, the typical diffraction peak (002) of graphite shifts to 2θ=10.6°, which is ascribed to the introduction of various oxygenic functional groups (carboxyl, hydroxyl, epoxy and carbonyl) attached on both edges and sides of the graphite sheets [32]. The XRD of GS was shown in Fig.1-b. Due to the partial removal of the oxygen-containing functional groups during reduction process, the weak diffraction peak of GS shifts to 2θ=23° and is in good agreement with graphite. That means the partially reduction of GO to GS and restacked into a disordered crystalline structure [33]. As seen in Fig.1-c, the peak at 23° is indexed to the graphitic plane (002) of GS, all other peaks of GS@Mn3O4 nanocomposites can be indexed to Mn3O4 based on their good agreement with JCPDS card (No. 24-0734). The sharpness of the diffraction peaks also indicates the high crystallinity of Mn3O4 in GS@Mn3O4 nanocomposites [27].
10 20 30 40 50
0 10000 20000 30000 40000
In
te
n
si
ty
(
a.
u
.)
2θ (Degree) (a)
10 20 30 40 50 0
400 800 1200
In
te
n
si
ty
(
a.
u
.)
2θ (Degree) (b)
10 20 30 40 50 60 70 80
0 200 400 600
In
te
n
si
ty
(
a.
u
.)
[image:4.596.99.498.484.578.2]2θ (Degree) (c)
Figure 1. XRD patterns of the GO (a), GS (b) and GS@Mn3O4 (c).
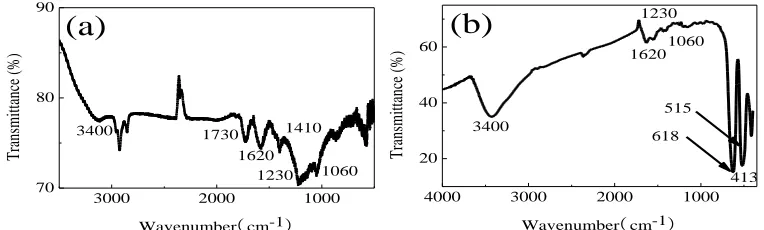
tetrahedral and octahedral sites. The peak at 413 cm-1 is due to the bandstretching mode of the octahedral sites [26]. Thus, the FT-IR results further confirm the formation of GS@Mn3O4 nanocomposites.
3000 2000 1000
70 80 90
T
ra
ns
m
itt
an
ce
(
%
)
Wavenumber(cm-1)
(a)
3400 1730
1620 1410
1230 1060
4000 3000 2000 1000
20 40 60
(b)
T
ra
ns
m
itt
an
ce
(
%
)
Wavenumber(cm-1) 3400
1620 1230
1060
618 515
413
Figure 2. FT-IR spectroscopy of the GO (a) and GS@Mn3O4 (b).
[image:5.596.105.487.152.267.2]Fig.3-a appears the smooth surface morphology of the GCE. While the Nf solution was deposited onto the GCE to fabricate the GCE│Nf electrode, uniform Nf film was formed on the GCE (Fig.3-b). As indicated in the magnified SEM image, the surface of GCE│GS@Mn3O4/Nf electrode exhibits a few thin wrinkles of GS and Mn3O4 nanoparticles are densely dispersed on the GS (Fig.3-c). The diameter of individual Mn3O4 nanoparticles is about 50 nm, which is advantageous to enhance the sensitivity and selectivity for electrochemical detection of DA.
Figure 3. SEM images of the GCE (a), GCE│Nf (b) and GCE│GS@Mn3O4/Nf (c) electrodes.
3.2. Electrochemical behaviors of the different electrodes
[image:5.596.100.499.447.548.2]
[Fe(CN)6]3-/4-(1:1) solution were shown in Fig.4-B. The linear part at the lower frequency region and the distinct semicircular at the higher frequency region correspond to the diffusion limited process of the electrochemical reaction and the electron transfer, respectively. The inset of Fig.4-B shows a standard Randle’s equivalent circuit model, including a charge transfer resistance (Rct), warburgh impedance (Zw), constant phase element (Q) and the uncompensated solution resistance (Rs) were used to fit the impedance data. Rct, which is equivalent to the diameter of the semicircular, could be used to express the conduction capacity of the electrode indirectly. The Rct values of the GCE (a), GCE│Nf (b) and GCE│GS@Mn3O4/Nf (c) electrodes are found to be 120, 2980 and 1450 Ω, respectively from the Nyquist plots, indicating that the conductivity of the GCE│GS@Mn3O4/Nf electrode is better than that of the GCE│Nf electrode.
-0.2 0.0 0.2 0.4 0.6 -100
-50 0 50 100
C
u
rr
en
t
(
μA
)
Potential(V) vs.SCE
a
b
c
(A)
0 1000 2000 3000 4000 0
300 600 900 1200
-Z''
(
Ω
)
Z'
(
Ω
)
a
b
c
Rs
Rct Zw
Q
(B)
[image:6.596.112.480.269.409.2]
Figure 4. CVs (A) and EIS (B) of the GCE (a), GCE│Nf (b) and GCE│GS@Mn3O4/Nf (c) electrodes in 0.1 M KCl solution containing 5.0 mM K3[Fe(CN)6] and 10.0 mM [Fe(CN)6]3-/4-(1:1).
3.3. Electrochemical behaviors of DA at different electrodes
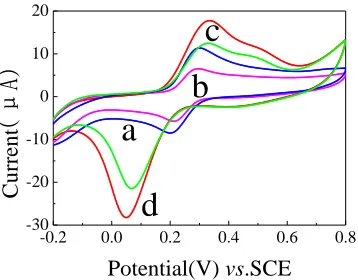
0.1 V/s) were also investigated. Both the oxidation and reduction currents increase with the v and there is a good linear relationship between current and v, indicating that the electrochemical reaction of DA on the modified electrode should be controlled by a typical adsorption process [35].
-0.2 0.0 0.2 0.4 0.6 0.8 -30
-20 -10 0 10 20
C
u
rr
en
t
(
μA
)
Potential(V) vs.SCE
a
b
c
d
Figure 5. CVs of the GCE (a), GCE│Nf (b) and GCE│GS@Mn3O4/Nf (c) electrodes in 0.1 M PBS containing 0.1 mM DA and GCE│GS@Mn3O4/Nf electrode in 0.1 M PBS containing 0.2 mM DA (d).
3.4. Optimization conditions of the electrochemical sensor
The effects of some electrolytes, such as 0.1 M PBS, NH3·H2O-NH4Cl and NaAc-HAc on stripping peak currents of 0.1 mM DA was studied. The best shape of peak, the lowest background current and the largest stripping peak current were obtained in 0.1 M PBS. The influence of pH on the determination of DA was also investigated. At first, the peak currents of 0.1 M DA increase gradually as the pH from 4.0 to 4.5, achieve a maximum value at about pH 4.5 and then continuous increase of pH led to a decrease of the peak current. Thus, 0.1 M PBS (pH 4.5) was choosn as the optimal supporting electrolyte, which in agreement with the previous report [36].
The effect of the GS@Mn3O4/Nf suspension loading on the GCE on the performance of the GCE│GS@Mn3O4/Nf electrode to 0.1 mM DA was investigated. The response currents to 0.1 mM DA increase when the added volume of GS@Mn3O4/Nf suspension increase from 3.0 to 5.0 μL, then gradually decreased after exceeded to 5.0 μL. The results infers that appropriate amount of GS@Mn3O4/Nf suspension is favorable to enhance the sensitivity of the modified electrode. However, excess amount would make the modified film too thick and block the electrons transfer [37]. Therefore, 5.0 μL of GS@Mn3O4/Nf suspension was selected as the amount of modification.
[image:7.596.208.387.157.297.2]
The effect of the operating potential on the amperometric response of the GCE│GS@Mn3O4/Nf electrode to 0.1 mM DA was also studied. The maximum response current was obtained at + 0.02 V.
3.5. The detection of DA on the GCE│GS@Mn3O4/Nf electrode
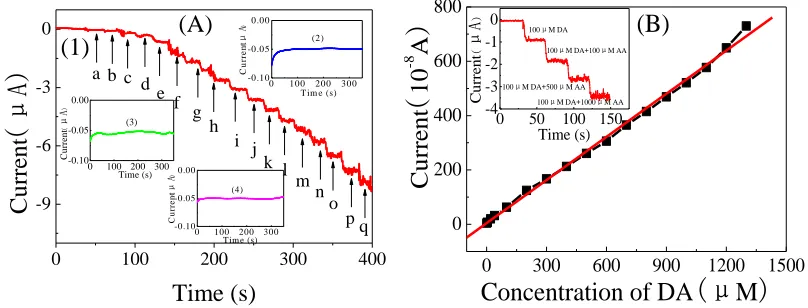
Under the optimal experimental conditions, the typical amperometric response of the GCE│GS@Mn3O4/Nf electrode with successive injection of DA in 0.1 M PBS at +0.02 V was given in Fig.6-A. The modified electrode responded rapidly when DA was added and reached a steady state (95% of the maximum value) within 3 s (curve 1), indicating a fast diffusion of the substrate in the hybrid film modified on the electrode and the high sensitivity of the modified electrode. Fig.6-B shows the response current at the GCE│GS@Mn3O4/Nf electrode is linearly related to the concentration of DA in the range from 1.0×10⁻⁶ to 1.3×10⁻³ M with the linearization equations i (10-8 A)= 4.2201 + 0.5294 CDA (C:μM) (R=0.9985). The detection limit was estimated to be 8.0×10⁻⁸ M based on signal-noise ratio equal to 3 (S/N=3). For comparison, similar experiments were conducted both on GCE│Nf (curve 2 in Fig.6-A) and GCE electrodes (curve 3 in Fig. 6-A) electrodes. No distinct response current to DA is observed in both cases. These results suggest that GS@Mn3O4 nanocomposites play a crucial role in enhancing the current of DA at the surface of the modified electrode.
0 100 200 300 400
-9 -6 -3 0
0 100 200 300 -0.10 -0.05 0.00 C u rr e n t ( μA )
Tim e (s) (4)
0 100 200 300
-0.10 -0.05 0.00 C u rr e n t ( μA ) Time (s) (3)
0 100 200 300 -0.10 -0.05 0.00 C u rr e n t ( μA )
T im e (s) (2) C u rr en t
(
μA
)
Time (s)a b c d e f g h i j k l m n o p q (1) (A)
0 300 600 900 1200 1500
0 200 400 600 800
0 50 100 150 -4
-3 -2 -1 0
100μM DA+100μM AA
C u rr e n t ( μA ) Time (s)
100μM DA
100μM DA+500μM AA
100μM DA+1000μM AA
C u rr e n t
(
10 -8 A)
Concentration of DA
(μ
M)
(B)
[image:8.596.96.500.402.556.2]
0.02 V is immune to AA interference and thus overcomes this common problem in real sample DA analysis.
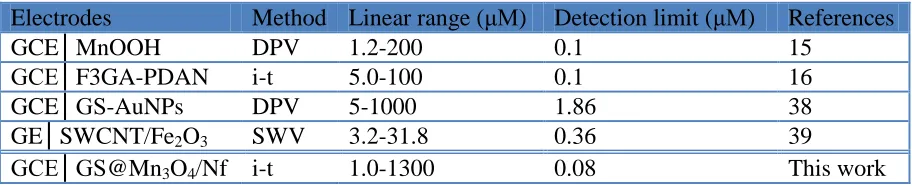
[image:9.596.71.527.261.354.2]The analytical performance for the electrochemical detection of DA on different modified electrodes were summarized in Table 1. It can be seen that the GCE│GS@Mn3O4/Nf electrode exhibited broader detection range and lower detection limit. It may be due to the good electrochemical activities and high surface-to-volume ratio of GS@Mn3O4 nanocomposites with a lot of electroactive sites and large surface area for DA to react and absorb. Therefore, the GCE│GS@Mn3O4/Nf electrode could be used for the preparation of a DA electrochemical sensor.
Table 1. Comparison of different DA electrochemical sensors.
Electrodes Method Linear range (μM) Detection limit (μM) References
GCE│MnOOH DPV 1.2-200 0.1 15
GCE│F3GA-PDAN i-t 5.0-100 0.1 16
GCE│GS-AuNPs DPV 5-1000 1.86 38
GE│SWCNT/Fe2O3 SWV 3.2-31.8 0.36 39
GCE│GS@Mn3O4/Nf i-t 1.0-1300 0.08 This work
3.6. Reproducibility, stability and selectivity of the GCE│GS@Mn3O4/Nf electrode
Reproducibility, stability and selectivity are three important characteristics for the modified electrode, which should be investigated.
The reproducibility of the modified electrode was valued at a DA concentration of 1.0 mM with the same GCE│GS@Mn3O4/Nf electrode. The relative standard deviation (RSD) was found to be 2.0% for five repeat measurements. The electrode-to-electrode reproducibility was determined in the presence of same concentration DA with five GCE│GS@Mn3O4/Nf electrodes fabricated in the same way and it showed an acceptable reproducibility with RSD of 3.8%.
The stability of the GCE│GS@Mn3O4/Nf electrode was also examined by assessing its amperometric response to 1.0 mM DA during storage in ambient conditions over one month. It was found that the proposed electrochemical sensor could retain 90.2% of its initial response current after one month storage, indicating its good long-term stability.
The selectivity of the electrochemical sensor was examined in presence of 1.0 mM DA when the relative error less than ± 5%. The addition of 10-fold concentration of uric acid, glutamic acid, glycine, lysine and tryptophane, 50-fold concentration of glucose, sodium chloride, acetaminophen and calcium chloride did not cause observable interference, indicating that these common interferents do not cause observable interference.
3.7. Analysis of real sample
directly diluted 100 times with 0.1 M PBS electrolyte and without any other pretreatment. Recovery tests was used to examine the reliability and accuracy of this method. The concentration of DA in the injection solution was found to be 52.2 ± 0.8 mM (n=5) and the recoveries was 102.3%, 99.6% and 103.4%, respectively. The results are in good agreement with the labeled value (52.7 mM) and summarized in Tab.2, confirming that the GCE│GS@Mn3O4/Nf electrode is feasible to determine the DA concentration in real samples.
Table 2. Determination of DA in injection solution (n=5, mM)
Sample Concentration This method Added Found Recovery/% RSD/%
1 52.7 52.2 100.0 154.5 102.3 4.73
2 52.7 53.0 100.0 152.6 99.6 3.65
3 52.7 51.4 100.0 154.8 103.4 2.48
4. CONCLUSIONS
In summary, an electrochemical sensor based on GS@Mn3O4 nanocomposites/Nf film modified GCE was successfully fabricated for selective and sensitive amperometric detection of DA at a low working potential. The proposed modified electrode (GCE│GS@Mn3O4/Nf) showed significantly improved selectivity due to being modified with nanocomposites, which could amplify the response current and decrease the working potential. It has been successfully applied to analyze DA in real DA injection solution samples with good accuracy and recovery. It may open up a new approach to explore GS@Mn3O4-based composite materials for food or drug residues analysis.
ACKNOWLEDGEMENTS
The authors appreciate the support of the Natural Science Foundation of Hunan Province (No.13JJ4102), the Project of Science and Technology Foundation of Hunan Province (No. 2012KW3066) and the Foundation of Hunan Educational Committee (No.14A025).
References
1. M. Moreno, A.S. Arribas, E. Bermejo, M. Chicharro, A. Zapardiel, M.C. Rodriguez, Y. Jalit and G.A. Rivas, Talanta, 80 (2010) 2149.
2. H.S. Wang, T.H. Li, W.L. Jia and H.Y. Xu, Biosens. Bioelectron., 22 (2006) 664. 3. H.Y. Wang, Y. Sun and B. Tang. Talanta, 57 (2002) 899.
4. H.P. Wu, T.L. Cheng and W.L. Tseng, Langmuir, 23 (2007) 7880.
5. V. Carrera, E. Sabater, E. Vilanova, and M.A. Sogorb, J. Chromatogr. B, 847(2007) 88. 6. L.L. Li, H.Y. Liu, Y.Y. Shen, J.R. Zhang and J.J. Zhu, Anal. Chem., 83(2011) 661.
7. X.Q. Tian, C.M. Cheng, H.Y. Yuan J. Du, D. Xiao, S.P. Xie and M.M.F. Choi, Talanta, 93 (2012) 79.
8. C.X. Xu, K.J. Huang, Y. Fan, Z.W. Wu, J. Li and T. Gan, Mater. Sci. Engin., C, 32 (2012) 969. 9. Y.R. Kim, S. Bong, Y.J. Kang, Y. Yang, R.K. Mahajan, J.S. Kim and H. Kim, Biosens.
Bioelectron., 25 (2010) 2366.
Biointerfaces, 88 (2011) 764.
13. T. Thomas, R.J. Mascarenhas, P. Martis, Z. Mekhalif and B.E.K. Swamy, Mater. Sci. Engin. C, 33 (2013) 3294.
14. J.B. Zheng and X.L. Zhou. Bioelectrochem., 70 (2007) 408.
15. X. Cao, X.L. Cai and N. Wang. Sens. Actuators B, 160 (2011) 771.
16. A.A. Abdelwahab, H.M. Lee and Y.B. Shim. Anal. Chim. Acta, 650 (2009) 247.
17. Y.F. Zhao, Y.Q. Gao, D.P. Zhan, H. Liu, Q. Zhao, Y. Kou, Y.H. Shao, M.X. Li, Q.K. Zhuang and Z.W. Zhu, Talanta, 66 (2005) 51.
18. Y. Huang, C.M. Cheng, X.Q. Tian, B.Z. Zheng, Y. Li, H.Y. Yuan, D. Xiao and M.M.F. Choi, Electrochim. Acta, 89 (2013) 832.
19. S.J. Li, D.H. Deng, Q. Shi and S.R. Liu, Microchim. Acta, 177 (2012) 325.
20. B. Kaur, T. Pandiyan, B. Satpati and R. Srivastava, Colloids Surf., B: Biointerfaces, 111 (2013) 97.
21. P. He, W. Wang, L.C. Du, F.Q. Dong, Y.Q. Deng and T.H. Zhang, Anal. Chim. Acta, 739 (2012) 25.
22. C.L. Sun, H.H. Lee, J.M. Yang and C.C. Wu, Biosens. Bioelectron., 26 (2011) 3450.
23. Y.J. Guo, S.J. Guo, J.T. Ren, Y.M. Zhai, S.J. Dong and E.K. Wang, ACS Nano, 4 (2010) 4001. 24. L. Tan, K.G. Zhou, Y.H. Zhang, H.X. Wang, X.D. Wang, Y.F. Guo and H.L. Zhang, Electrochem.
Commun., 12 (2010) 557.
25. Q. Liu, X. Zhu, Z.H. Huo, X.L. He, Y. Liang and M.T. Xu, Talanta, 97 (2012) 557.
26. N. Lavoie, P.R.L. Malenfant, F.M. Courtel, Y.Abu-Lebdeh and I.J. Davidson, J. Power Sources, 213 (2012) 249
27. Y.F. Fan, X.D. Zhang, Y.S. Liu, Q. Cai and J.M. Zhang, Mater. Lett., 95 (2013) 153.
28. Y.Z. Wu, S.Q. Liu, H.Y. Wang, X.W. Wang, X. Zhang and G.H. Jin, Electrochim. Acta, 90 (2013) 210.
29. N. Li, Z.F. Geng, M.H. Cao, L. Ren, X.Y. Zhao, B. Liu, Y. Tian and C.W. Hu, Carbon, 54 (2013) 124.
30. A. Salimi, K. Abdi and G.R. Khayatian. Microchim. Acta, 144 (2004) 161.
31. H. Bai, Y.X. Xu, L. Zhao, C. Li and G.Q. Shi, Electrochem. Commun., 13 (2009) 1667. 32. F. Wu, H.W. Lin, X. Yang and D.Z. Chen, Int. J. Electrochem. Sci., 8 (2013) 7702. 33. X. Yang, F. Wu, D.Z. Chen and H.W. Lin, Sens. Actuators. B, 192 (2014) 529.
34. X.Yang, F. Zhang, Y.J. Hu, D.Z. Chen, Z.Q He and L.Z. Xiong, Int. J. Electrochem. Sci., 9 (2014) 5061.
35. A.H. Liu, M.D. Wei, I. Honma and H.S. Zhou, Adv. Funct. Mater. 16 (2006) 371.
36. Y. Tong, Z.C. Li, X.F. Lu, L. Yang, W.N. Sun, G.D. Nie, Z.J. Wang and C. Wang, Electrochim. Acta, 95 (2013) 12.
37. X. Yang, F.B. Xiao, H.W. Lin, F. Wu, D.Z. Chen and Z.Y. Wu, Electrochim. Acta, 109 (2013) 750.
![Figure 4. CVs (A) and EIS (B) of the GCE (a), GCE│Nf (b) and GCE│GS@Mn3O4/Nf (c) electrodes in 0.1 M KCl solution containing 5.0 mM K3[Fe(CN)6] and 10.0 mM [Fe(CN)6]3-/4-(1:1)](https://thumb-us.123doks.com/thumbv2/123dok_us/1894141.147142/6.596.112.480.269.409/figure-cvs-eis-gce-gce-electrodes-solution-containing.webp)