doi: 10.20964/110369
Int. J. Electrochem. Sci., 11 (2016) 3738 - 3754
International Journal of
ELECTROCHEMICAL
SCIENCE
www.electrochemsci.org
Comparative Study of Different Potentiometric Ion-Selective
Electrodes for Determination of Certain Polyionic Drugs
A. M. El-Kosasy, Omar Abdel-Aziz, N. Magdy*, N. M. El Zahar
Pharmaceutical Analytical Chemistry Department, Faculty of Pharmacy, Ain Shams University, Organization of African Unity Street, Abassia, Cairo (11566), Egypt.
*
E-mail: [email protected]
Received: 14November 2016 / Accepted: 8 March 2016 / Published: 1April 2016
Selective polyionic electrodes were investigated; using precipitation based technique forming ion-pair complexes between the polycation Polymyxin B (Poly B) and tetrakis (4-chlorophenyl) borate (TpClPB) (sensor 1) and phosphotungstic acid (sensor 2) and ionophore based technique with 2-hydroxy propyl beta cyclodextrin (HP β-CD) (sensors 3 and 4) for determination of Poly B and Cromolyn sodium (CS), respectively. Also an aqueous dispersion of iron oxide magnetic nanoparticles (NPs) was applied with (HP β-CD) for CS determination (sensor 5). Linear responses within concentration ranges of 10−6 to 10−2, 10−6 to 10−3, 10−7 to 10−4 and 10−6 to 10−3 mol L−1 were achieved, using sensors 1, 2, 3 and 4, respectively. On the other hand the sensitivity was increased up to 10−8 mol L−1 on using sensor 5. Near nernstian slopes of 12.68, 53.55, 58.93 and 55.11 mV/decade were observed for sensors 1, 2, 3 and 4, respectively, and an ideal nernstian slope of 59.60 mV/decade was obtained for sensor 5. The developed sensors 1, 2, 3 and 4 showed a reasonable selectivity, whereas the selectivity of sensor 5 was the greatest one. The proposed sensors showed successful application for determination of the investigated drugs in pharmaceutical formulations and biological fluids without pretreatment.
Keywords: Ion exchangers, Ionophores, Iron oxide nanoparticles, Ion selective electrodes, Polyions.
1. INTRODUCTION
Polyionic drugs are hydrophilic substances that their solubility depends on ionic strength and pH. Their charge density plays a fundamental role in their conformation and viscosity and also has a great impact on their activities [1-2].
[image:2.596.50.542.143.392.2]
Poly B is an antibiotic that is active against gram negative bacteria. It is derived from the bacterium Bacillus polymyxa. Polymyxins acts by binding to the cell membrane and changing its structure. It consists of one fatty acid residue attached through an amide bond to a linear tripeptide linked to a heptapeptide ring [3] (Fig.1 a).
Figure 1. Chemical structure of (a) Polymyxin B and (b) Cromolyn sodium
Several methods have been recorded for the analysis of Poly B as thin-layer chromatography [4-5], high-performance liquid chromatography with UV [6-7], fluorescence [8], mass spectrometric detection [9-10], gas chromatography [11], spectrophotometry [12-13], capillary electrophoresis [14-15] and microbiological assays [16].
CS prevents the release of inflammatory chemicals such as histamine from mast cells. CS blocks early and late asthmatic responses induced by allergen inhalation and exercise. It also blocks the increase in bronchial hyperreactivity induced by chronic allergen exposure [17-18]. It is a chromone derivative containing two carboxylic groups (Fig.1 b).
Several methods have been reported for the determination of CS in pharmaceutical formulations and biological fluids. These methods include: spectroscopy [19-20], radioimmunoassay [21], thin layer chromatography [22], high-performance liquid chromatography using UV [23-24], fluorescence [25] and tandem mass detectors [26-27], and capillary electrophoresis [28]. Polarographic and voltammetric procedures have also been described [29-30].
Ion-selective electrodes (ISEs) are widely used in pharmaceutical analysis [31]. ISEs are based on either precipitation or ionophore based technique. Their response changes rapidly with the change in concentration. Furthermore, they have simple design, low cost, adequate accuracy, high selectivity and low detection limit. They can be used for determination of analytes in colored, turbid and viscous samples and they prove a great advantage over other techniques [32].
a
The literature review revealed that no ISEs were constructed for Poly B and CS determination. Therefore novel potentiometric detection strategies have been developed.
The present work defines the use of precipitation-based technique of Poly B with tetrakis (4-chlorophenyl) borate (TpClPB) and phosphotunstic acid, forming ion association complexes. Moreover, the use of based technique by means of HP β-CD and the use of ionophore-based technique with iron oxide nanoparticles (NPs) for the development of selective and sensitive sensors for determination of Poly B and CS in bulk powder and different pharmaceutical formulations as well as in biological fluids (plasma and urine).
TpClPB and phosphotungstic acid were reported as well-known ion exchangers used in the development of many sensors. It has been found that Poly B react with them to form water insoluble ion association complexes. The high lipophilicity and stability of these complexes recommended their use as electroactive materials in polyvinyl chloride (PVC) matrix membrane sensors for determination of Poly B selectively, in the presence of other interferents [33-34].
Cyclodextrins (CDs) are sensor ionophores in potentiometric ISEs famous to accommodate an extensive variety of inorganic, organic and biologic guest molecules, forming stable host–guest inclusion complexes hydrophobic cavity, while demonstrating high molecular selectivity and enantioselectivity [35].
Iron oxide NPs are particles with diameters between about 1 and 100 nanometers can be exploited in a variety of applications based on their interesting magnetic properties. They can be used in catalysis, biomolecular magnetic resonance imaging (MRI) for medical diagnosis and therapeutics [36-37] and potentiometric detection of pharmaceutical substances [38-39]
2. EXPERIMENTAL
2.1. Apparatus
A Jenway pH meter 3310 pH /mV /◦C meter with Orion, reference electrode (Ag/AgCl, double junction) model 63178 USA 314-771-5750, A Jenco digital ion analyzer model 6209 and JEOL JEM-2100 Transmission Electron Microscope (München, Germany) were used. Jenway pH glass electrode (UK) and Bandelin Sonorox, Rx 510 S, magnetic stirrer (Budapest, Hungary) were used for pH adjustment.
2.2. Chemicals and Reagents
CS was kindly supplied by Sigma Pharmaceutical Industries (Egypt, SAE) and certified to contain 99.61%. Nazocrom® nasal spray (Batch number: 23888), labeled to contain 20 mg of CS and 0.25 mg of Oxymetazoline HCl per 1 mL, was manufactured by Sigma Pharmaceutical Industries (Egypt, SAE). Epicrom® eye drop (Batch number: 1203205), labeled to contain 40 mg of CS per 1 mL, was manufactured by (EIPICO), Cairo, Egypt.
Oxymetazoline HCl was kindly provided by Sigma Pharmaceutical Industries (Egypt, SAE). Dexamethasone was obtained from (EIPICO), Cairo, Egypt. Oxyteracycline HCl and salbutamol sulphate were obtained from The Arab Drug Company, ADCO.
All chemicals and reagents used were of analytical reagent grade. PVC, HP β-CD and phosphotungstic acid were obtained from Fluka Chemie Gmbh (Steinheim, Germany), (TpClPB) and dioctyl phthalate (DOP) were purchased from Aldrich (Steinheim, Germany). Tetrahydrofuran (THF) was obtained from Merck (Dermstadt, Germany). Iron oxide NPs (5nm) were purchased from Nanotech Egypt for photo electronics Co. (Dreamland, 6th October City, Egypt). Potassium chloride, ammonium chloride, sodium chloride, sodium lauryl sulphate (SLS), sodium hydroxide and hydrochloric acid were obtained from Prolabo (Pennsylvania, USA). Plasma and urine were supplied by VACSERA (Giza, Egypt) and used within 24 h.
2.3. Procedure
2.3.1. Fabrication of membrane sensors
2.3.1.1. Precipitation-based technique for preparation of PVC-membrane sensors (sensors 1 and 2)
5 mL of saturated aqueous solution of the ion exchanger was mixed with 5 mL of 10−2 M aqueous Poly B solution. Both solutions were shaken together for 5 minutes then the formed precipitate was filtered and washed with cold water. The resultant precipitate was left to dry at room temperature and finally grounded to fine powder. Elemental analysis of the complexes confirmed the formation of drug: ion exchanger in a ratio of 1:5 with TpClPB and a ratio of 1:1 with phosphotungstic acid.
The PVC- membrane was prepared in a glass Petri dish (5 cm diameter) by mixing 10 mg of Poly B-ion exchanger complex with 0.19 g of PVC and 0.35 mL of DOP. 6 mL of THF was added. The Petri dish was covered with a filter paper and allowed to stand overnight to permit evaporation of the solvent at room temperature, where a master membrane of 0.1 mm in thickness was obtained.
2.3.1.2. β-CD-based technique for the preparation of PVC-membrane sensors
2.3.1.2.1. β-CD-based technique (sensors 3 and 4)
For Poly B, sensor 3 was formed by mixing 0.04 g of HP β-CD with 0.35 mL DOP and 0.19 g PVC in a 5-cm Petri dish. The mixture was dissolved in 6 mL THF and the procedure mentioned under Section 2.3.1.1 starting from “The Petri dish was covered with a filter paper and allowed to stand overnight ...” was adopted.
For CS, sensor 4 was formed by mixing 0.04 g of HP β-CD with 0.35 mL DOP and 0.19 g PVC in a 5-cm Petri dish and then the mixture was dissolved in 6 mL THF. The Petri dish was covered with filter paper and left to stand overnight at room temperature to allow evaporation of the solvent, where a master membrane of 0.1 mm thickness was obtained.
The coated graphite electrode was constructed using a graphite bar which was 2.5 cm in length and 3mm in diameter. One end of the bar was used for connection while the other was dipped in the electro active membrane mixture for about 1 cm in length. The process was repeated several times, until the end of the graphite bar was covered with a layer of proper thickness. The electrode was allowed to stand at room temperature overnight till complete drying. The uncoated end of the graphite rod was sealed in a poly tetra ethylene tube. The tube was filled with metallic mercury. A copper wire of about 1 mm in diameter was dipped in the metallic mercury. The electrode was conditioned by soaking in 10−2 M aqueous CS solution for 24 h, and was stored in the same solution, when not in used.
2.3.1.2.2. β-CD-based technique and iron oxide NPs (sensors 5)
For CS, sensor 5 was fabricated by the same procedure mentioned under Section 2.3.1.2.1. except that the poly tetra ethylene tube was filled with metallic mercury and 0.5 mL of iron oxide NPs into which a copper wire (about 1 mm in diameter) was dipped.
2.3.2. Sensors calibration
For sensors calibration, 50 mL aliquots of solutions (10−8 to 10−2 M) of Poly B and (10−9 to 10−2 M) of CS were transferred seperately into a series of 100 mL beakers. The membrane sensors, in conjunction with Aldrich reference electrode, were immersed in the above test solutions and allowed to equilibrate while stirring. The potential was recorded after stabilizing to ± 1 mV and the electromotive force was plotted as a function of the negative logarithm of Poly B or CS concentration. The sensors were washed in distilled water between the measurements.
2.3.3. Effect of pH
2.3.4. Sensors selectivity
The potentiometric selectivity coefficients (KpotA.B) of sensors 2, 3, 4, and 5 towards different substances were determined by the separate solution method (SSM), using the following equation [40]:
−log Kpot
A.B = E1 − E2 / (2.303 RT / ZAF) + (1− ZA / ZB) log αA (1)
where; KpotA.B is the potentiometric selectivity coefficient, E1 is the potential measured in 10−4 M CS or Poly B solution, E2 is the potential measured in 10−4 M interferent solution, ZA and ZB are the charges of CS or Poly B and interfering ion; respectively, αA is the activity of the drug and 2.303RT / ZAF represents the slope of the investigated sensors (mV/concentration decade).
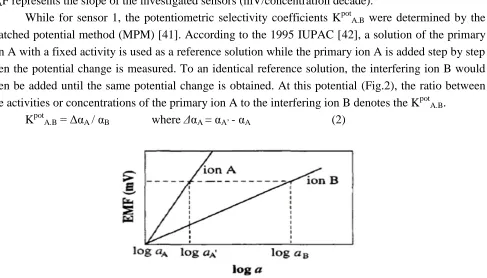
While for sensor 1, the potentiometric selectivity coefficients KpotA.B were determined by the matched potential method (MPM) [41]. According to the 1995 IUPAC [42], a solution of the primary ion A with a fixed activity is used as a reference solution while the primary ion A is added step by step then the potential change is measured. To an identical reference solution, the interfering ion B would then be added until the same potential change is obtained. At this potential (Fig.2), the ratio between the activities or concentrations of the primary ion A to the interfering ion B denotes the KpotA.B.
KpotA.B = ΔαA / αB where ΔαA =αA’ - αA (2)
Figure 2. Determination of selectivity coefficients by the matched potential method, ion A is the primary ion, ion B is the interfering ion and αA is the initial background activity of ion A.
2.3.5. Assay of Poly B in pharmaceutical formulations
Poly B in Terramycin® ointment could be extracted as follows: The ointment was dissolved in 20 mL chloroform in a 50 mL beaker then 10 mL water was added. It was stirred at 1500 rpm using a magnetic stirrer for 5 minutes, where water was dispersed in the chloroform. The mixture was then left for one minute to separate into two layers. The upper aqueous layer was withdrawn using a conventional 5 mL syringe and the procedure was repeated for 3 times to prepare 1.30 x 10⁻⁴ M stock solution.
[image:6.596.61.548.210.488.2]
From the stock solutions, serial dilutions were made to obtain solutions of concentrations 1.0 x 10⁻⁵ and 1.0 x 10⁻⁶ M. The potentiometric measurements of the prepared samples were performed, using the proposed sensors in conjunction with Aldrich reference electrode, and the potential readings were compared to the calibration plots.
2.3.6. Assay of Poly B in urine and plasma [43]
One milliliter of each of 1.0 x10⁻⁴ and 1.0 x10⁻⁵ M standard Poly B solution were added separately into two 20 mL stoppered shaking tubes each containing 9 mL of urine. They were similarly added into another two 20 mL stoppered shaking tubes each containing 9 mL of plasma. Then the tubes were shaken for 1 min. The membrane sensors 1, 2 and 3 were immersed in conjunction with the reference electrode in the solutions (containing urine and plasma) and then washed with water between the measurements. The potential produced for each solution was measured by the proposed sensors and the concentration of Poly B was then obtained from the corresponding regression equation.
2.3.7. Assay of CS in pharmaceutical formulations
5 and 10 mL were accurately transferred from Epicrom® eye drop and Nazocrom® nasal spray, respectively, into two 100 mL volumetric flasks and filled to the mark with water to prepare 3.9 x 10⁻³ M stock solution of each. Then a serial dilution was made from the prepared stocks to obtain 3.9 x 10⁻⁴ to 3.9 x 10⁻⁶ M. The potentiometric measurements of the prepared samples were performed using the proposed sensors in conjunction with Aldrich reference electrode, and the potential readings were compared to the calibration plots.
2.3.8. Assay of CS in urine and plasma [44]
One milliliter of each of 1.0 x 10⁻⁴ and 1.0 x 10⁻⁵ M standard CS solution were added separately into two 20 mL stoppered shaking tubes, each containing 9 mL of urine. Similarly one milliliter of each of 1.0 x 10⁻⁶ and 1.0 x 10⁻⁷ M standard drug solution were added separately into another two 20 mL stoppered shaking tubes, each containing 9 mL of plasma. Then the tubes were shaken for 1 min. The membrane sensors 4 and 5 were immersed in conjunction with the reference electrode in the solutions (containing urine), while sensor 5 only was immersed in conjunction with the reference electrode in the solutions (containing plasma) and then washed with water between the measurements. The produced potential for each solution was measured by the proposed sensors, and the concentration of CS was then obtained from the corresponding regression equation.
3. RESULTS AND DISCUSSION
3.1. Sensors Fabrication
In the precipitation based technique, the polycation Poly B reacts with the anionic type of ion exchangers TpClPB and phosphotungstic acid, which are good anionic exchangers, due to their low solubility product and suitable grain size to produce a hydrophobic ion association complexes in a ratio 1:5 of Poly B to TpClPB and 1:1 of Poly B to phosphotungstic acid as demonstrated by elemental analysis.
The fact that; Poly B is a pentavalent polycation, having hydrophobic fatty acid moiety and a polar moiety of five unmasked amino groups which are ionized under physiological pH conditions forming a positively charged (theoretically fivefold positive charged) polypeptide [45] leads to a change the EMF of about 12 mV, according to the near nernst equation for the Poly B:TpClPB complex. However for the Poly B: phosphotungstic acid complex, that’s not the case due to the presence of steric hindrance between the Poly B and the phosphotungstic acid, owing to the high molecular weight of both and that was proved by the elemental analysis.
[image:8.596.176.425.330.606.2].
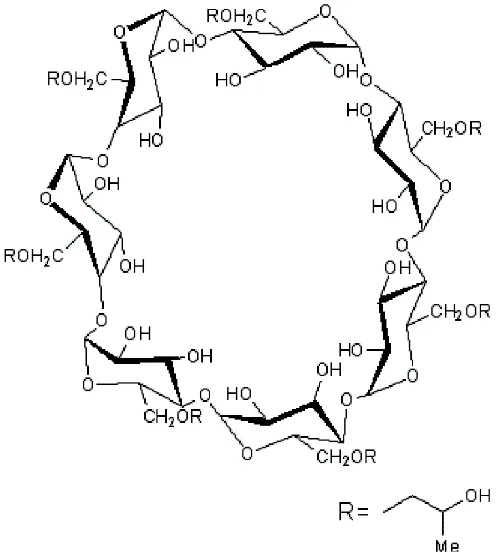
Figure 3. Chemical structure of the 2-hydroxy propyl β-cyclodextrin molecule
In the ionophore based technique, the molecular recognition and inclusion complexation are very important for host–guest interactions [46]. Cyclodextrins (Fig.3) are optically active oligosaccharides that form inclusion compounds with organic molecules. CDs based sensors showed accurate results in both response and selectivity [47].
formation was 1:1 stoichiometry [48]. CDs selectively include the fatty acyl portion of Poly B into their hydrophobic cavity [49].
For CS, the chromone moiety is incorporated into the hydrophobic cavity of the CDs. The complexation reaction between CS and CDs was quantitatively studied by laser flash photolysis where CS:β-CD inclusion complex formation was 1:1 stoichiometry [50].
Moreover; the use of iron oxide NPs was reported to play a crucial role in the electronic conductivity [51, 52]. Remarkably, when materials become “nano”, their physical properties as the mechanical, electric and electronic properties will be improved [53]. The electrical conductivity may drastically change yielding enhanced and/or controlled ionic conduction with good durability, stability and surface quality, very low distortion tendency, and high thermal resistance [54-55]. The iron oxide NPs were used in the fabrication of sensor 5 that showed the best response with the maximum sensitivity, selectivity, accuracy and precision. Although sensor 5 didn’t give the fastest response, but its stability and durability were the greatest.
[image:9.596.75.517.395.684.2]3.2. Sensors calibration and response time
Table 1. Electrochemical response characteristics of the investigated sensors.
Parameter Sensor 1 Sensor 2 Sensor 3 Sensor 4 Sensor 5
Slope (mV/decade)a 12.68 53.55 58.93 55.11 59.60
Intercept (mV) 206.43 444.60 546.13 507.51 590.13 LOD (M)b 8.93×10⁻⁷ 9.21×10⁻⁷ 9.43×10⁻⁸ 9.36×10⁻⁷ 9.91 ×10⁻⁹
Response time (sec.) 5 45 30 30 45
Working pH range 2-7 2-7 2-7 4-9 4-9
Concentration range (M)
1×10⁻⁶ to 1×10⁻²
1×10⁻⁶ to 1×10⁻³
1×10⁻⁷to 1×10⁻⁴
1×10⁻⁶ to 1×10⁻³
1×10⁻⁸ to 1×10⁻³
Stability (days) 60 60 60 30 30
Average recovery (%) ± SDa
99.90 ± 1.55 100.26 ± 1.15 100.20 ± 0.61 99.94 ± 0.59 100.20 ± 0.61
Repeatability (SDr) 1.41 0.81 0.63 0.67 0.42
Intermediate
Precision (SDint) 2.65 1.32 0.93 1.18 0.74
Correlation
coefficient 0.9996 0.9995 0.9996 0.9997 0.9999
a
Average of three determinations b
Limit of detection
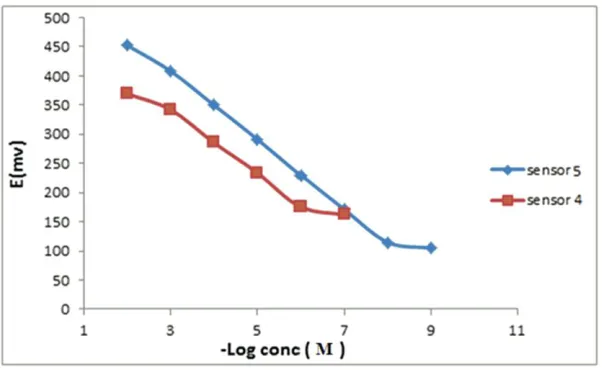
The sensors displayed constant potential readings within ± 1 mV from day to day measurements, and the calibration slopes did not change by more than ± 1 mV/decade concentration over a period of 2 months for sensors 1, 2 and 3 and 1 month for sensors 4 and 5. The slopes of the calibration plots (Fig. 4 and 5) are 12.68, 53.55, 58.93, 55.11 and 59.60 mV/concentration decade for the investigated sensors, respectively.
The investigated electrodes exhibit fast response time. The required time for the electrodes to reach values ± 1 mV of the final equilibrium potential after increasing Poly B and CS concentration 10-folds to be 5, 45, 30, 30 and 45 s for sensors 1, 2, 3, 4 and 5, respectively. The proposed sensors also exhibit fair stability.
The detection limits of the sensors were determined according to the IUPAC definition. Table 1 shows that sensor 3 is more sensitive than sensors 1 and 2 and can detect Poly B in dilute solutions down to 9.43 × 10⁻⁸
M. For CS sensor 5 is the most sensitive electrode and can detect dilute solutions down to 9.91 × 10⁻⁹
[image:10.596.153.444.313.477.2]M.
Figure 4. Profile of the potential in mV versus - log concentration of Poly B in (M) obtained by using the sensors 1, 2 & 3.
[image:10.596.150.451.540.725.2]
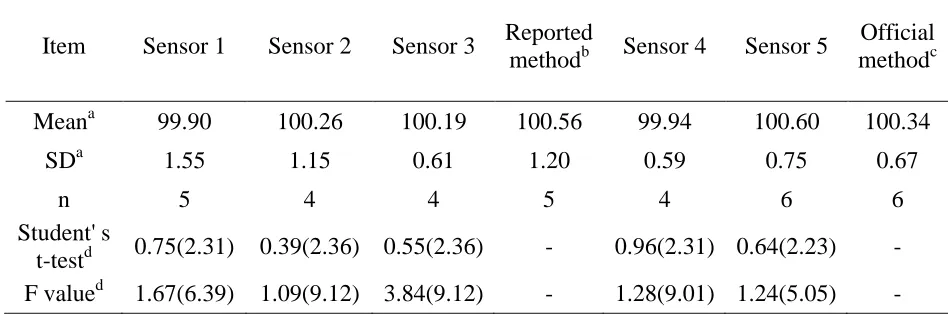
The proposed sensors were compared with a reported method [13] for Poly B and the official one [56] for CS, no significant difference was observed, as shown in Table 2.
Table 2. Statistical comparison for the results obtained by the proposed electrodes and the reported and the official methods for the analysis of Poly B and CS in pure powder form.
a
Average of three determinations b
Multivariate partial least square (PLS-1) chemometric approach using direct spectra signal for Polymyxin B determination.
c
Direct spectrophotometric determination of Cromolyn sodium using pH 7.4 sodium phosphate buffer at the wavelength of maximum absorbance (326 nm).
d
The values in parentheses are the corresponding theoretical values for t and F at P=0.05
3.3. Effect of pH and temperature
For quantitative measurements with ISEs, studies were carried out to reach the optimum experimental conditions. The sensors constructed for Poly B potentials are fairly constant over the pH range of 2.0–7.0, therefore, this range was assumed to be the working pH range for the electrode assembly. Below pH 2.0 variable electrode response was observed, this may be explained by the increase of dissociation of the formed ion association complex and/or the membrane may extract H+, leading to noisy responses. Also above pH 7.0, the potential showed a sharp decrease due to the formation of non-protonated primary amino groups. The sensors constructed for CS potentials are fairly constant over the pH range of 4.0–9.0, therefore, this range was assumed to be the working pH range for the electrode assembly. Outside this range a noisy response occurred may be due to the precipitation of the active ion.
Although the suggested sensors exhibit a slight increase in their potentials as the temperature increases in the range 25 – 45ºC, the limit of detection and response time do not significantly change due to the change in temperature, indicating reasonable thermal stability of the PVC membrane up to 45ºC.
Item Sensor 1 Sensor 2 Sensor 3 Reported
methodb Sensor 4 Sensor 5
Official methodc
Meana 99.90 100.26 100.19 100.56 99.94 100.60 100.34
SDa 1.55 1.15 0.61 1.20 0.59 0.75 0.67
n 5 4 4 5 4 6 6
Student' s
[image:11.596.60.536.178.335.2]
3.4. Sensors selectivity
Table 3. Potentiometric selectivity coefficients (KpotPoly B,interferent) of the sensors 1, 2 and 3 in the presence of other interferents.
Interferentb
Selectivity coefficienta
Sensor 1 Sensor 2 Sensor 3 Oxytetracycline HCl 2.99 x 10⁻² 7.62 x 10⁻³ 5.82 x 10⁻⁴
Dexamethasone 1.85 x 10⁻² 7.05 x 10⁻³ 1.12 x 10⁻⁵ KCl 9.79 x 10⁻⁴ 2.38 x 10⁻⁴ 3.88 x 10⁻⁴ NaCl 1.61 x 10⁻³ 3.55 x 10⁻⁴ 4.36 x 10⁻⁵ NH4Cl 3.22 x 10⁻² 1.23 x 10⁻⁴ 3.20 x 10⁻⁴ SLS 6.27 x 10⁻³ 5.99 x 10⁻⁴ 6.97 x 10⁻⁵ a
Each value is the average of three determinations b
[image:12.596.127.468.145.312.2]All interferents are in the form of 1x10⁻⁴ M solution
Table 4. Potentiometric selectivity coefficients (KpotCS,interferent) of the sensors 4 and 5 in the presence of other interferents.
Interferentb
Selectivity coefficienta
Sensor 4 Sensor 5 Oxymetazoline HCl 4.58 x 10⁻⁴ 8.99 x 10⁻⁵
Dexamethasone 3.56 x 10⁻⁴ 9.31 x 10⁻⁵ Salbutamol sulfate 1.75 x 10⁻³ 1.55 x 10⁻⁵
KCl 1.35 x 10⁻³ 1.18 x 10⁻⁴
NaCl 1.06 x 10⁻⁴ 1.72 x 10⁻⁴
NH4Cl 3.15 x 10⁻⁴ 7.98 x 10⁻⁵
SLS 3.56 x 10⁻⁴ 8.97 x 10⁻⁴
a
Each value is the average of three determinations b
All interferents are in the form of 1x10⁻⁴ M solution
[image:12.596.143.454.429.610.2]
interfering substances. The IUPAC recommended MPM when ions of unequal charges are involved as SSM gives inaccurate results [41-42]. Therefore, only in case of sensor 1 the MPM was used to accurately describe the sensor selectivity.
Tables 3 and 4 show the potentiometric selectivity coefficients of the proposed sensors in the presence of some interfering substances and some inorganic cations (K+, Na+ and NH4+) which are usually found in biological fluids. The results reveal that; the proposed membrane sensors exhibit reasonable selectivity except for sensor 5, which shows the greatest selectivity and the lowest response for the possibly interfering species. So sensor 5 is considered to be the one of choice to detect the drug in presence of any other interferents.
[image:13.596.75.516.313.489.2]3.5. Potentiometric determination of Poly B and CS in pharmaceutical formulations
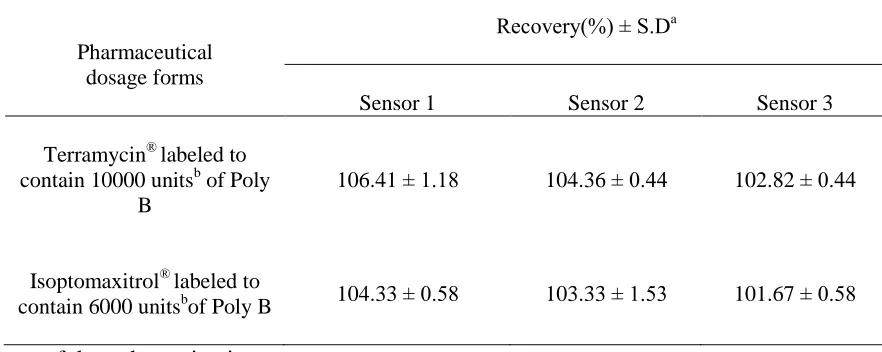
Table 5. Determination of Poly B in pharmaceutical formulations by the sensors 1, 2 and 3.
Pharmaceutical dosage forms
Recovery(%) ± S.Da
Sensor 1 Sensor 2 Sensor 3
Terramycin® labeled to contain 10000 unitsb of Poly
B
106.41 ± 1.18 104.36 ± 0.44 102.82 ± 0.44
Isoptomaxitrol® labeled to
contain 6000 unitsbof Poly B 104.33 ± 0.58 103.33 ± 1.53 101.67 ± 0.58
a
Average of three determinations. b
1 unit of Poly B is equivalent to 0.000127 mg [57].
Table 6. Determination of CS in pharmaceutical formulations by the sensors 4 and 5.
Pharmaceutical dosage forms
Recovery(%) ± S.D.a
Sensor 4 Sensor 5
Nazocrom® labeled to contain
20 mg of CS per 1 mL 103.59 ± 0.26 102.31 ± 0.26
Epicrom® labeled to contain
40 mg of CS per 1 mL 102.56 ± 0.26 101.62 ± 0.39
a
The proposed sensors were applied for the analysis of Poly B and CS in pharmaceutical formulations in aqueous solution. The results indicate that sensors 1, 2 and 3 can be applied for determination of pharmaceutical formulations containing Poly B in combination and sensors 4, 5 for the determination of pharmaceutical formulations containing CS alone or in combination as shown in Tables 5 and 6.
3.6. Potentiometric determination of Poly B and CS in plasma and urine
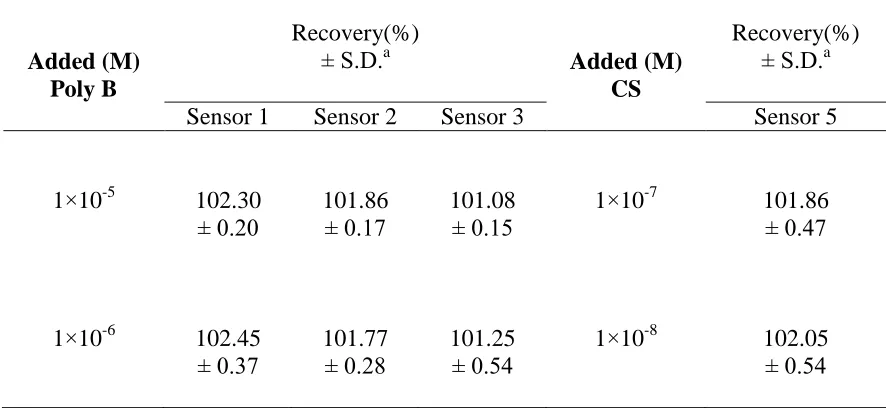
[image:14.596.76.519.373.577.2]The results obtained for the determination of these drugs in spiked human plasma show that a wide concentration range can be determined by sensors (1, 2 and 3) for Poly B (with peak plasma concentrations ranged from 2.38 to 13.90 mg/L after an intravenous infusion [58]. While only sensor 5 can be used for CS determination in plasma (peak plasma concentration of 13.40 ± 4.5 ng/ml after inhalation [59]) with high precision and accuracy due to its sensitivity and detection limit as shown in Table 7.
Table 7. Determination of Poly B and CS in spiked human plasma by the proposed sensors.
Added (M) Poly B
Recovery(%) ± S.D.a
Added (M) CS
Recovery(%) ± S.D.a
Sensor 1 Sensor 2 Sensor 3 Sensor 5
1×10⁻⁵ 102.30 ± 0.20
101.86 ± 0.17
101.08 ± 0.15
1×10⁻⁷ 101.86 ± 0.47
1×10⁻⁶ 102.45 ± 0.37
101.77 ± 0.28
101.25 ± 0.54
1×10⁻⁸ 102.05 ± 0.54 a
Average of three determinations
For the application in urine, it was found that all the sensors are reliable and give stable results with very good accuracy and high percentage recovery, which are presented in Table 8 as these drugs are rapidly eliminated unchanged in the urine [58-59]
Table 8. Determination of Poly B and CS in spiked human urine by the proposed sensors.
Added (M) Poly B
Recovery(%) ± S.D.a
Added (M) CS
Recovery(%) ± S.D.a
Sensor 1 Sensor 2 Sensor 3 Sensor 4 Sensor 5
1×10⁻⁵ 102.33 ± 0.36
101.55 ± 0.27
101.14 ± 0.47
1×10⁻⁵ 102.17 ± 0.49
101.63 ± 0.62
1×10⁻⁶ 102.50 ± 0.23
101.88 ± 0.14
101.05 ± 0.44
1×10⁻⁶ 102.88 ± 0.59
101.70 ± 0.36 a
Average of three determination
4. CONCLUSION
The proposed sensors are simple and selective for quantitative determination of Poly B and CS in pure form, pharmaceutical formulations, plasma and urine. The use of HP β-CD increased the membrane sensitivity and selectivity in comparison with precipitation based sensors for Poly B. While for CS, the use of iron oxide NPs was of a great value in terms of selectivity and sensitivity and gave a successful application in plasma. The described sensors offer advantages of fast response, good selectivity, accuracy, precision and elimination of drug pre-treatment steps and consumption of solvents. Consequently, they can be used for routine analysis of these drugs in quality-control laboratories.
References
1. D. Truzzolillo, C. Cametti and S. Sennato, Phys. Chem. Chem. Phys., 11 (2009) 1780. 2. S. Haber-Pohlmeier and A. Pohlmeier, Croat. Chem. Acta, 80 (2007) 439.
3. A. Theretz, J. Teissie and J. F. Tocanne, Eur. J. Biochem., 142 (1984) 113. 4. A. H. Thomas and I. Holloway, J. Chromatogr., 16 (1978) 417.
5. J. Krzek, M. Starek, A. Kwiecien and W. Rzeszutko, J. Pharm. Biomed. Anal., 24 (2001) 629. 6. J. A. Orwa, A. Van Gerven, E. Roets and J. Hoogmartens, J. Chromatogr. A, 870 (2000) 237. 7. M. Pendela, E. Adams and J. Hoogmartens, J. Pharm. Biomed. Anal., 36 (2004) 751.
8. A. M. El Kosasy, Omar Abdel-Aziz, N. Magdy and N. M. El Zahar, J. Fluoresc., 25 (20150 695. 9. L. Van den Bossche, A. Van Schepdael and S. Chopra, J. Hoogmartens, Talanta, 83 (2011) 1521. 10.T. A. Thomas, E. C. Brown, K. M. Abildskov, C. J. Kubin, J. Horan, M. T. Yin and S. Cremers,
Ther. Drug Monit., 34 (2012) 398.
11.A. Haemers and P. De Moerloose, J. Chromatogr., 52 (1970) 154. 12.J. M. Lemus and J. Perez, Anal. Lett., 34 (2001) 1265.
14.P. Srisom, B. Liawruangrath, S. Liawruangrath, J. M. Slater and S. Wangkarn, J. Pharm. Biomed. Anal., 43 (2007) 1013.
15.R. Injac, A. M. Linaric, V. Djorjevic-Milic, K. Karljikovic and B. Strukeli, Food Addit. Contam. Part A, 25 (2008) 424.
16.M. Jacobson, A. Koch and R. Kuntzman, J. Pharmacol. Exp. Ther., 183 (1972) 433.
17.X. Wu, O. O. Adedoyin and H. M. Mansour, Antiinflamm. Antiallergy Agents Med. Chem., 10 (2011) 215.
18.S. Murphy and H. W. Kelly, Drug Intell. Clin. Pharm., 21 (1987) 22.
19.Omar Abdel-Aziz, A. M. El Kosasy, N. Magdy and N. M. El-Zahar, Spectrochimica Acta Part A, 131 (2014) 59.
20.S. S. Saleh, H. M. Lotfy, N. Y. Hassan and S. M. Elgizawy, Saudi Pharm. J., 21 (2013) 411. 21.K. Brown, J. J. Gardner, W. J. S. Lockley, J. R. Preston and D. J. Wilkinson, Ann. Clin. Biochem.,
20 (1983) 31.
22.V. Kocic-Pesic, D. Radulovic, D. Pecanac and L. Zivanovic, Farmaco, 47 (1992) 1563.
23.M. S. Ali, S. Rafiuddin, D. A. Al-Jawi, Y. Al-Hetari, M. U. H. Ghori and A. R. Khatri, J. Sep. Sci., 31 (2008) 1645.
24.S. T. Hassib, A. A. El-Zaher and M. A. Fouad, J. Chem. Pharm. Res., 3 (2011) 243.
25.K. Mawatari, S. Mashiko, Y. Sate, Y. Usui, F. Iinuma and M. Watanabe, Analyst, 122 (1997) 715. 26.X. Y. Liu, T. T. Qu, B. J. Wang, C. M. Wei, G. Y. Yuan, R. Zhang and R. C. Guo, Biomed.
Chromatogr., 22 (2008) 1021.
27.Z. J. Lin, R. Abbas, L. M. Rusch and L. Shum, J. Chromatogr. B Analyt. Technol. Biomed. Life Sci., 788 (2003) 159.
28.A. Helle, S. Hirsjarvi, L. Peltonen, J. Hirvonen and S. K. Weidmer, J. Chrom. A, 1178 (2008) 248. 29.F. C. Pereira, A. G. Fogg and M. V. B. Zanoni, Talanta, 60 (2003) 1023.
30.J. C. Moreira, S. E. Foster, J. A. Rodrigues and A. G. Fogg, Analyst, 117 (1992) 989. 31.R. Maleki, A. A. Matin and A. Jouyban, J. Chin. Chem. Soc., 53 (2006) 613.
32.A. M. El-Kosasy, M. A. Shehata, N. Y. Hassan, A. S. Fayed and B. A. El-Zeany, Talanta, 66 (2005) 746.
33.H. Y. Aboul-Enein, X. X. Sun and C. J. Sun, Sensors, 2 (2002) 424.
34.V. K. Gupta, A. K. Singh and B. Gupta, Anal. Bioanal. Chem., 389 (2007) 2019.
35.A. M. El-Kosasy, M. Nebsen, M. K. Abd El-Rahman, M. Y. Salem and M. G. El-Bardicy, Talanta, 85 (2011) 913.
36.k. O’Grady, R. L. White and P. J. Grundy, J. Magn. Mater., 177 (1998) 886. 37.A. S. Teja and P. Y. Koh, Prog. Cryst. Growth Charact. Mater., 55 (2009) 22.
38.A. M. El-Kosasy, S. M. Tawakkol, M. F. Ayad and A. I. Sheta, Electroanalysis, 26 (2014) 1031. 39.D. A. Song, R. N. Liang, R. M. Zhang, J. W. Ding, J. Zhang and W. Qin, Chin. Chem. Lett., 21
(2010) 1378.
40.Y. Umezawa, P. Bühlmann, K. Umezawa, K. Tohda and S. Amemiya, Pure Appl. Chem., 72 (2000) 1851.
41.Y. Umezawa, K. Umezawa and H. sato, Pure Appl. Chem., 67 (1995) 507. 42.K. Tohda, D. Dragoe, M. Shibata and Y. Umezawa, Anal. Sci., 17 (2001) 733.
43.A. P. Zavascki, L. Z. Goldani, G. Cao, S. V. Superti, L. Lutz, A. L. Barth, F. Ramos, M. M. Boniatti, R. L. Nation and J. Li, Clin. Infect. Dis., 47 (2008) 1298.
44.M. Lindström, J. O. Svensson, L. Meurling, K. Svartengren, M. Anderson and M. Svartengren, Respir. Med., 98 (2004) 9.
45.G. Patrick and B. Klaus, Anti-Infect. Agents Med. Chem., 8 (2009) 367.
46.A. M. El-Kosasy, L. Abd El Aziz and Y. A. Trabik, J. Appl. Pharm. Sci., 2 (2012) 51.
47.E. E. Sideris, G. N. Valsami, M. A. Koupparis and P. E. Macheras, Eur. J. Pharm. Sci., 7 (1999) 271.
49.J. W. Kang, A. Van Schepdael, J. A. Orwa, E. Roets and J. Hoogmartens, J. Chromatogr. A, 879 (2000) 211.
50.M. Christoff, L. T. Okano and C. Bohne, J. Photochem. Photobiol. A: Chem., 134 (2000) 169. 51.L. A. Hussein, A. M. El-Kosasy and Y. A. Trabik, RSC Advances,5 (2015) 37957
52.M. Dawy, S. K. El-Mahy and E. Abd El Aziz, Aust. J. Basic Appl. Sci., 6 (2012) 55.
53.Z. Guo, K. Lei, Y. Li, H. W. Ng, S. Prikhodko and H. T. Hahn, Compos. Sci. Technol., 68 (2008) 1513.
54.H. Matsumoto, Y. Furuya, S. Okada, T. Tanji and T. Ishihara, Sci. Technol. Adv. Mat., 8 (2007) 531.
55.J. Maier, Nat. Mater., 4 (2005) 805.
56.The United States Pharmacopoeia 30 NF 25TH ed., United States Pharmacopeial Convention, Rockville, MD 20852, United States, 2007.
57.J. H. Humphrey, J. W. Lightbown and M. V. Mussett, Bull. World Health Organ., 20 (1959) 1229. 58.A. Lee, L. Chang, V.C. Yang, L. Pao and D. Wang, J. Food Drug Anal., 10 (2002) 212.
59.E. Bakker and M. E. Meyerhoff, Anal. Chim. Acta, 416 (2000) 121.