AN AREAL ANALYSIS OF INFANT AND CHILD MORTALITY
IN WEST JAVA
BY
LÜKMAN ISMAIL
A THESIS SUBMITTED IN PARTIAL FULFILMENT
OF THE REQUIREMENTS FOR THE DEGREE OF
MASTER OF ARTS IN DEMOGRAPHY AT
THE AUSTRALIAN NATIONAL UNIVERSITY
EXCEPT WHERE OTHERWISE INDICATED, THIS THESIS IS MY OWN
WORK.
i
ACKNOWLEDGMENTS
I am extremely grateful to the Government of Australia for awarding a scholarship enabling me to undertake this study. Also, I would like to thank the Central Bureau of Statistics of the Republic of Indonesia for granting me the necessary study leave.
I would like to express my gratitude to Dr. Siew Ean K h o o , my supervisor, for her patience, guidance, constructive suggestions, encouragement, and helpful comments in all steps of my thesis writing.
Thanks are due to Dr ,, Gavin W . Jones, the Convenor 0 f the Indonesian Census data tapes, who has given permission for use of the Indonesian Census data tapes; and to Ms . Chris MeMurray, Mr. Terry Dixon, Mr. Le s Dohn t for their assistance in computer programming and data pro ce ss in g . Also thanks to Mrs. Hatmadji for her assistance in using her personal computer.
ii
Embassy in Canberra, and Dr. Januar Achmad for their assistance in supply useful mat e r i a l for writing this thesis.
Thanks are also due to the Director of the Graduate Program in De m o g r a p h y at The A u s t r a l i a n National University, Dr. David W. Lucas, and the Secretarial staff, Ms. Carol Mehkek.
I would like also to thank all the friends, espec i a l l y Lukito, Haris and Makmuri, who accom p a n i e d me in typing the thesis. Thanks are also due to Mr, and Mrs. Arifi y a t n o who helped me providing a c c o m o d a t i o n during ray first staying in Canberra.
Finally, my special thanks must go to my wife and family who gave me en c o u r a g e m e n t and moral support.
iii
A B S T R A C T
This thesis examines the regional diff e r e n c e s in infant and child m o r t a l i t y in West Java based on the data from the 1980 Indon e s i a n P o p u l a t i o n Census. The thesis also examines the d e m o g r a p h i c and so c i o - e c o n o m i c indicators associated with those regional d i f f erences in infant and child mortality.
West Java is known as the most fertile among the provinces in J a v a . H o w e v e r , the infant and child m o r t a l i t y in this province are the highest. The infant and child m o r t a l i t y in West Java are found to be s u b s t a n t i a l l y different between the various regencies in the province .
In g e n e r a l , the results of this study indicate that regional d i f f erences in infant and child m o r t a l i t y in regencies are due to differences in so c i o - e c o n o m i c status of the regencies. The regencies which have better s o c i o - e c o n o m i c conditions appear t 0 have lowe r infant mortality.
V
GLOSSARY
I M R — I n f a n t M o r t a l i t y R a t e
C M R - C h i l d M o r t a l i t y R a t e
C E B - C h i l d r e n E v e r B o r n
P O P D E N - P o p u l a t i o n D e n s i t y
E M W - E v e r M a r r i e d W o m e n a g e d
1 5 - 2 4 y e a r s
L I T L E V ** P o p u l a t i o n a g e d 1 0 y e a r s
a n d o v e r w h o a r e a b l e t o
r e a d a n d w r i t e
N A T L A N G P o p u l a t i o n a g e d 1 0 y e a r . s
a n d o v e r w h o a r e a b l e t o
s p e a k t h e n a t i o n a l
1 a n g u a g e
W E D U C W o m e n a g e d 1 0 y e a r s a n d
o v e r w h o h a v e c o m p l e t e d
a t l e a s t e l e m e n t a r y
s c h o o l
H H F S H o u s e h o l d s w i t h a r e a o f
f l o o r s p a c e l e s s t h a n 1 0 0
s q u a r e m e t e r s
H H R A D - H o u s e h o l d s w i t h r a d i o
H H T V - H o u s e h o l d s w i t h t e l e v i s i o n
H H E L E C T - H o u s e h o l d s w i t h e l e c t r i c i t y
a s a s o u r c e o f l i g h t i n g
K H P I P E D - H o u s e h o l d s w i t h p i p e d w a t e r
f o r d r i n k i n g
F P R - F e m a l e l a b o u r f o r c e
p a r t i c i p a t i o n r a t e
H H A G R - A g r i c u l t u r a l H o u s e h o l d s
vi
T R E A T S i c k p e o p l e w h o o b t a i n e d
t r e a t m e n t f r o m m e d i c a l
p e r s o n n e l
H H T O I L H o u s e h o l d s w i t h o w n t o i l e t
f a c i l i t y
P H C P u b l i c H e a l t h C e n t r e
( p e r 1 0 , 0 0 0 p o p u l a t i o n )
K a b u p a t e n - R e g e n c y
K o t a m a d y a - M u n i c i p a l i t y
B i r o P u s a t S t a t i s t i k - C e n t r a l B u r e a u o f S t a t i s t i c s
K a n t o r S t a t i s t i k -P r o p i n s i J a w a B a r a t
vii
CONTENTS
Page
ACKNOWLEDGMENTS
i
ABSTRACT
iii
GLOSSARY
v
LIST OF TABLES
x
LIST OF FIGURES
xi
LIST OF APPENDICES
xli
CHAPTER 1
INTRODUCTION
1
1.1. Background and Objectives of the Study
1
1.2. Demographic Situation in West Java
3
1.2.1. Fertility and Nuptiality Pattern
4
1.2.2. Level of Mortality
6
1.2.3. Level of Infant Mortality
7
1.3. The Socio-Economic Situation in West
Java
8
1.4. Socio-Economic Differentials in Infant
and Child Mortality : A Literature
Review
10
1.4.1. Indonesian Studies
10
1.4.1.1. Differentials according to
Sex of Infant
10
1.4.1.2. Differentials according to
Place of Residence
11
1.4.1.3. Differentials by Age at
First Marriage
12
1.4.1.4« Differentials according to
Maternal Education
13
1.4.1.5. Differentials according to
viii
1.4.2. Studies of Other Developing Countries
16
1.4.2.1. Differentials by Maternal
Education
16
1.4.2.2. Differentials by Paternal
Occupation
17
1.4.2.3. Differentials by Housing
Conditions
18
1.4.3. Summary of factors affecting infant
and child mortality rates
19
CHAPTER 2
DATA AND METHODOLOGY
21
2.1. Sources of Data
21
2.2. Limitations of Data
22
2.3. Unit of Analysis
23
2.4. Method of Analysis
26
2.4.1. The Structure of Multivariate
Areal Analysis
28
2.4.2. Variables Considered in the
Analysis
30
CHAPTER 3
AREAL DIFFERENCES IN INFANT MORTALITY AND
SOCIO-ECONOMIC CONDITIONS
39
3.1. Introduction
39
3%2. Areal Differences in Infant Mortality
39
3.3. Areal Differences in Socio-Economic
Indicators
42
3.4. Summary Findings
50
CHAPTER 4
A STATISTICAL ANALYSIS OF AREAL DIFFERENCES IN
SOCIO-ECONOMIC INDICATORS AND CHILD MORTALITY
52
4.1. Bivariate Statistical Analysis
52
4.1.1. Correlation Between Child Mortality
4.1.2. Correlation Between Child Mortality
and Socio-Economic Indicators
55
4.1.3. Correlation Between Child Mortality
and Health Indicators
60
4*2*
Multivariate Analysis
61
4.3.
Summary Findings
66
CHAPTER 5
SUMMARY AND CONCLUSION
68
5.1. Summary
68
5 • 1«1» Regional Differences in Infant and
Child Mortality
68
5»1»2. Factors Associated with Regional
Differences in Infant and Child
Mortality
69
5.2. Conclusion
72
REFERENCES
75
ix
LIST OF TABLES
x
Number Heading Page
1 . 1 Selected Demographic Characteristics of West Java and Other Provinces in
Java in 1971 and 1980 4
1.2 Life Expectancy at Birth in Provinces
of Java 7
3.1 Infant and Child Mortality by
Regency and Municipality in West Java 41
3.2 Summary Statistics of the Variables
under Examination, West Java, 1980 45
3.3. Comparison of Demographic and
Socio-Economic Indicators in Four Municipalities and the Five Regencies having the highest and
Lowest Infant Mortality Rates, West Java, 1980 48
4.1 The Zero Order Correlation Coefficients of Child Mortality with Demographic,
Socio-Economic and Health Indicators, West Java, 1980 54
4.2. Regression Analysis of Child mortality on Socio-Economic and Demographic
LIST OF FIGURES
Figure 3.1.
Hap of West Java
xii
Appendix A
A p p e n d i x B
Appendix C
LIST OF APPEN D I C E S
: Demographic, Socio-Economic, and Health
Indicators By Regency and Municipality in
West Java, 1980
Table A.l. The Demographic Indicators By
Regency and Municipality in
West Java, 1980
Table A.2. Socio-Economic Indicators By
Regency and Municipality in
West Java, 1980
Table A.3« Health Indicators By Regency
.and Municipality in West Java, 1980
: Correlation Matrix Among The Indicators
under Examination
Table B.l. C o r r e l at io n Ma t r i x Among the D em o gra p h i c , Soci o - E c o n o m i c , and
H e a l t h Indicators under E x a m i n at i on ( R egency Only)
: Selected Scatterplots between Demographic,
Socio-Economic and Health Indicators with Child Mortality
Figure C*1 : Scatterplot between Mean Number
of Children Ever Born and Child
Mortality
Figure C.2 : Scatterplot between Population
Density and Child Mortality
Figure C.3 : Scatterplot between Women Education
and Child mortality
Figure C.4 : Scatterplot between Percentage
Households Possessing Radio and
Child Mortality
[image:14.550.29.497.116.547.2]xiii
Figure C.6 : Scatterplot between Percentage of
Households with Electricity as a
Source of Lighting with Child
Mortality
Figure C*7 : Scatterplot between Female Labour
Force Participation Rate with
Child Mortality
[image:15.550.134.482.89.252.2]1
C H A P T ER 1
I N T R O D U C T I O N
1.1. B a ck g r o u n d and Objec t i v e s of the Study
Infant and child m o r t a l i t y rates have often been used as d e v e lopment indicators since they are most responsive to changes in s o c io-economic conditions. Furthermore, since the level of infant and child m o r t a l i t y is highly a s sociated with the socio - e c o n o m i c conditions of the population, the rates of infant and child m o r t a l i t y are also used as indicators of po p u l a t i o n well being. In most developing countries, the infant m o r t a l i t y rate started declining in the early 1950s, and it has been argued that the decline is a t tributed to improved s o c i o - e c o n o m i c conditions.
2
I n d o nesia like most developing countries experienced high rates of infant and child mor t a l i t y and large d ifferences according to social strata of the population such as place of residence, region and other s o c i o economic cha r a c t e r i s t i c s . The estimated infant mor t a l i t y rate for the whole of Indonesia for the year 1980 was about 100 per 1,000 live births (Soeradji and Ismail, 1984:32) and the estimated child mo r t a l i t y rate was 166 per 1,000 children under the age of five years
(Adioetomo ,1985 : 12) .
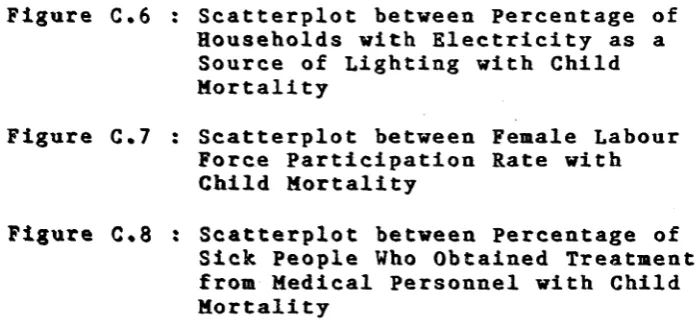
In Java there are d i f f erences in infant m o r t a l i t y rate among the five provinces; that is, the Special Region of Jakarta, West Java, Central Java, the Special Region of Y o g y akarta, and East Java. A c c ording to the Biro Pusat S t a tistik (1983b) the highest estimate of the infant m o r t a l i t y rate for 1980 was found in West Java (129 per 1,000 live births), while the lowest rate was in the Special Region of Y o g y a k a r t a (63 per 1,000 live births) (Table 1.1).
3
provinces in Java (S o e r a d j i , 1983 ; S o e m a n t r i , 1 983 ) . These two c h a r a c t e r i s t i c s underlined the choice of West Java for this study of infant and child m o r tality patterns.
The purpose of this study is to examine variations in infant and child m o r t a l i t y across the regencies (kabupaten) and m u n i c i p a l i t i e s (kotamadya) in West Java in 1980. Also, this study examines the factors which are a s sociated with the regional differences in infant and child m o r t a l i t y . This study consists of five chapters. The I n t r o d u c t i o n to the study is presented in Chapter i; Chapter 2 presents the Data and Methodology; Chapter 3 examines the areal d i f f erences in infant mo r t a l i t y in 1 980 . This will be followed by statistical analyses of the areal data in child m o r t a l i t y and s o c i o - e c o n o m i c indicators in Chapter 4. The summary and conclusions of the study will be presented in Chapter 5.
1.2. D e mo g r a p h i c Si t u a t i o n in West Java
West Java had a total p o pulation of 27.5 m i l lion in 1980 . About 87 per cent of the people lived in rural areas. The annual growth rate for West Java was 2.1 per cent between 1961 and 1971; it increased to 2.7 per cent between 1971 and 1930. This placed West Java as having the second highest annual growth rate in Java after the Special Region of Jakarta (Table 1.1.).
4
593 persons per square kilometer (Biro Pusat S tatistik, 1 983 a ) . It has the lowest population density of all provinces in Java (Table 1.1.)
Table 1.1 Selected D e m o g r a p h i c C h a r a c t e ri s ti cs of West Java and other Provinces in Java in 1971 and 1980
Province
Annual Popula tion Growth (%)
a)
Popula tion Density (persons/
s q .km) (2)
TFR ( per w o m e n )
(3)
IMR ( per 1 , 000 live births)
(4)
J akar t a
1971 4.4 7,761 5.2* 124
1980 3.9 11 ,023 4.0** 80
WEST J AVA
1971 2.1 467 5.9* 158
1980 2.7 593 5.1** 129
Central Java
1971 1 . 8 640 5.3 * 146
1980 1 . 6 742 4.4** 96
Yog yakar t a
1 97 1 1 . 1 785 4.8* 96
1980 1 . 1 868 3.4** 63
East Java
1971 1 . 6 532 4.7* 132
1980 1 . 5 609 3.6** 99
Source : Biro Pusat Stat i s t i k . 1983b . PERKIRAAN ANGKA
KELAHIRAN DAN KEMATIAN (Estimates of Fertility and Mortality R a t e ) . Jakarta .
Notes : * Refers to the years 1967-1970 **Refers to the years 1976-1979 TFR - total fertility rate
IMR - infant mortality rate
1.2.1. F e r t i li t y and N u p t i a li ty Patterns
[image:19.550.66.491.73.630.2]5
shows
that the total
fertility rate
for
West
Java in
the
period
1967-1970 was
5.9 per women , and
in
1976-1979
it
was 5.1 per women or
a decline of about 15 per cent.
West Java has the lowest rate of decline in fertility of
provinces in Java.
In West Java, the mean age at first marriage for women is still low. Nurdin (
1976
) found that the singulate mean age at marriage for women in1971
was17.6
years. The1980
Indonesian Population Census showed that for West Java the singulate mean age at marriage for women in1980
was18.5
years (Hull,1987
). This meansthat in West Java most of the women, especially women in rural areas, married at an early age. There is a perception among the rural population that a girl must marry between the age of
15
and19
years, otherwise, she will be called a "Perawan Tua' (Old Maid); and this predicament will be embarassing not only for the girl herself, but also for her family (McDonald and Abdurahman,1975).
(M u l i a k u s u m a , 1975). Women who marry at a younger age are probably not prepared p s y c h o l o g i c a l l y or physically to enter into a marriage.
6
1.2.2. Level of Mortality
7
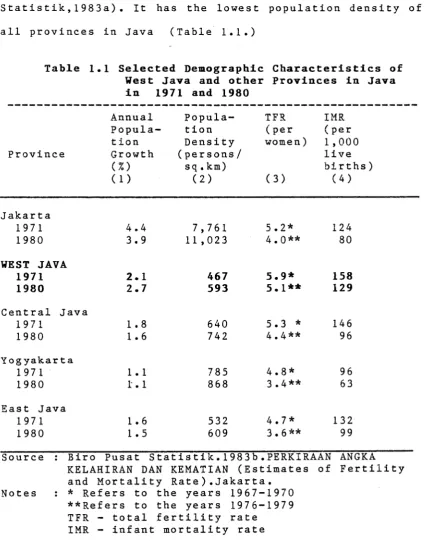
Table 1.2. Life Expec t a n c y at Birth in Provinces of Java
Province
Male s 1971
Female s Mai e s 1980
Females
J akar t a 47.9 50.8 56.0 59.5.
WEST JAVA 42.1 45.0 46.9 49.7
Central Java 44.0 47.0 52.8 56.0
Yog yaka r t a 44.0 47.0 58.9 63,5
East Java 46.0 49 .3 52.3 55 .5
J a v a 44.5 47.5 50.9 54.0
Source : Biro Pusat Statistik. 1 9 8 3 b . PERKIRAAN ANGKA KELA-HIRAN DAN KEMA T I A N (Estimates of Fertility and M o r t a l i t y Rates). Jakarta.
1.2.3. Level of Infant Mortality
The infant m o r t a l i t y rate in Indonesia has declined since 1960. In 1960, the infant mor t a l i t y rate was est i m a t e d to be 175 per 1,000 live births, while in 1980 it was about 100 per 1,000 live births (Hull and S u n a r y o ,1978; Soeradji and Ismail , 1984 : 33 ) . Based on these figures, it is estimated that the infant m o r t a l i t y rate in I n d onesia has declined at the rate of about four per cent per year between 1960 and 1980.
[image:22.550.62.493.45.321.2]8
In West Java, the infant mor t a l i t y rate has also declined s u b s t a n t i a l l y since 1971. Based on data from the 1971 Indon e s i a n Popul a t i o n Census, the rate was 159 per 1,000 live births, while according to the 1980 Indonesian Popul a t i o n Census, the rate was 129 per 1,000 live births (Nurd i n , 1986:45; Soeradji and I s m a i 1 , 1984 : 33 ).
As noted before, West Java is considered the most fertile area with quite good natural resources. Soeradji (1983) stated that the wealth of the region may not explain well the level of infant mortality. He argued that it is prob a b l y the d e m o graphic factors which are r e s p onsible for the higher rate of infant m o r t a l i t y in West Java since this province has the highest fertility rate and the lowest mean age at first marriage.
1.3. The S o c i o - Ec o n o mi c Sit u a t i o n in West Java
9
On Che other hands, most of the p o pulation in West Java are Moslem. A c c o r d i n g to the 1980 Indonesian P o p u l a t i o n Census (Biro Pusat Statistik, 1982a), about 99 per cent of the popul a t i o n were Moslem. Other religions in West Java are Christianity, Buddhism, and Hinduism.
D uring the period 1973 - 1980 the rate of economic growth of West Java province increased substantially. To m e a sure the economic growth, non-oil Gross Regional D omestic Product per capita has been used. In 1973, this figure for West Java was Rp. 59 , 959 . By 1980 , it had increased n e arly 50 per cent (in constant price terms) to Rp. 87,832 (Nurdin, 1986:11).
[image:24.550.51.498.20.746.2]10
1.4. S o ci o -E c o n o m i c D i f fe r e n t i a l s in Infant and Child Mortality; A L i t e r a t u r e R e view
This
section will review the results of several
studies on socio-economic differentials in infant
and
child
mortality
in
Indonesia
and
other
developing
countries. Differentials in infant mortality have been
found according to several socio-economic factors, such
as
level
of maternal
education,
paternal
occupation,
place
of
residence,
sex
of
infant,
and
housing
conditions .
1.4.1. I n do n es i a n Studies
1.4.1.1. D i f fe r e n t i a l s a c c o r d i n g to Sex of Infant
1.4.1.2. D i f f e r e n t ia l s acc o r d i n g to Place of Residence
When the analysis focused on d i f f e rentials according to place of residence in Indonesia, the infant m o r t a l i t y in urban areas was lower than in rural areas. In urban areas, data from the 1971 Indonesian po p u l a t i o n Census showed that the infant m o r t a l i t y rate was 114 per 1 , 000 live births, and in rural areas, it was 149 per 1 ,000 live births (Biro Pusat S t a t i s t i k , 1 9 8 3 b ) . Furthermore, from the 1980 Indone s i a n P o pulation Census, the infant m o r t a l i t y rates were 87 and 115 per 1,000 live births for urban and rural areas r e s p e c t i v e l y (Biro Pusat Statistik, 1 983b) .
1.4.1.3 D i f fe r e n ti a l s by Age at First Marriage
In general, marriage at an early age is associated with early age at i n itiation of child bearing. It is also related to s o c i o - e c o n o m i c conditions. Women who marry very young often come from poor families with lower health status and low e d u c ational attainment (Utomo and Iskandar, 1986). Accordingly, age at first m arriage is considered to have a great influence on infant and child mortality. The lower the age of a woman at first marriage , the younger the women will be when she has her first child, and the less likely the baby is to be healthy with consequent higher risk of child loss ( Soeradji , 1981) .
Infant m o r t a l i t y differ e n t i a l s in Indonesia according to age at first marriage of mother are clearly shown by Adioetomo (1985). Using data from the 1980 I n donesian Po p u l a t i o n Census, she found that the infant m o r t a l i t y rates for women who married at ages 14-17, 18-19 ,and 20 years and over were 103, 98, and 79 deaths per 1,000 live births, respectively.
13
the first time at ages 18 or 19 the rate was 78 per 1,000 live births. From these findings, it is clear that the lower the age at first m arriage the higher the infant m o r t a l i t y rate.
1.4.1,4. D i f fe r e n ti a l s acc o r d i n g to M at e r n a l E du ca ti o n
Several studies have shown that maternal e d u c a t i o n has a strong c o r r e l a t i o n with infant m o rtality. In Indonesia, m aternal edu c a t i o n is c o rrelated n e g a t i v e l y with infant m o r t a l i t y (Hull and Sunaryo,1978; K a d a r u s m a n , 1 982 ; Soeradji and I s m a i l , 1984 ; Ad i o e t o m o ,1985 ) .
14
Budiarto and Sunaryo (1985:66) showed that in West Java, the infant m o r t a l i t y rate differs s u b s t a n t i a l l y according to m aternal education. The infant m o r t a l i t y rate of u n educated mothers was almost three times higher than that of educated mothers; that is, 120 per 1,000 live births for unedu c a t e d mothers, and 47 per 1,000 live births for mothers who had completed senior high school. Utomo and Hatraadji (1983) examined the effect of maternal e d u c ation on infant m o r t a l i t y in villages in West Java and East Java. They found that there was s i g n ificant d i fference in the pr o p o r t i o n of infants who died between women with no schooling and women with some schooling but who had not completed primary school.
Again, using data from the 1980 Indon e s i a n Po p u l a t i o n Census, Adioetomo (1985) also found that the level of infant m o r t a l i t y is highest among women with no education. The level of infant m o r t a l i t y for women who have completed junior high school is almost half that for women with no education.
1.4.1.5. D i f fe r e n ti a l s ac c o r d i n g to Housing Conditions
1 5
l e a d to l o w e r i n f a n t an d c h i l d m o r t a l i t y r a t e s t h r o u g h
r e d u c i n g the i n c i d e n c e of i n f e c t i o u s and r e s p i r a t o r y
d i s e a s e s .
O n e of the c h a r a c t e r i s t i c s of a h e a l t h y h o u s e is
a p p r o p r i a t e n e s s of the s i z e of the h o u s e , m e a s u r e d by
a r e a of f l o o r s p a c e . D e s p i t e t h e r e b e i n g no e x a c t f i g u r e s
on h o w l a r g e an a r e a is a p p r o p r i a t e for e a c h o c c u p a n t in
a h o u s e h o l d , t h i s c h a r a c t e r i s t i c c a n be a r g u e d to be an
i m p o r t a n t f a c t o r i n f l u e n c i n g i n f a n t an d c h i l d m o r t a l i t y .
A d i o e t o m o ( 1 9 8 5 : 2 8 ) f o u n d t h a t , f or I n d o n e s i a , the
l a r g e r the a r e a of f l o o r s p a c e the l o w e r the i n f a n t
m o r t a l i t y r a t e . , T h e i n f a n t m o r t a l i t y r a t e s in h o u s e h o l d s
h a v i n g an a r e a of f l o o r s p a c e l e s s t h a n 30 , 3 0 - 6 9 ,
70-199, a nd m o r e t h a n 200 s q u a r e m e t e r s w e r e 114 , 106, 94,
a nd 85 d e a t h p e r 1 , 0 0 0 l i v e b i r t h s , r e s p e c t i v e l y .
S u b e k t i a n d S u a r d i ( 1 9 8 4 ) a n a l y z e d the i n f l u e n c e of
s o c i o - e c o n o m i c f a c t o r s on i n f a n t a nd c h i l d m o r t a l i t y in
W e s t N u s a T e n g g a r a . By i g n o r i n g o t h e r v a r i a b l e s in t h e i r
a n a l y s i s , t h e y f o u n d t h a t the p r o p o r t i o n of i n f a n t s d e a d
o ut of a l l l i v e b i r t h s d e c r e a s e d w h e n the a r e a of the
h o u s e i n c r e a s e d . In h o u s e h o l d s w h i c h h a v e an a r e a of l e s s
t h a n 15 s q u a r e m e t e r s , the a v e r a g e p e r c e n t a g e of i n f a n t
d e a t h s w a s 3 0 . 6 p e r c e n t , w h i l e in h o u s e h o l d s w h i c h h a v e
an a r e a of a b o u t 100 s q u a r e m e t e r s , the p e r c e n t a g e w a s
16 1.4.2. Studies of Other De v e l o p i n g Countries
1.4.2.1. D i f fe r e n ti a l s by M a ternal Edu c a t i o n
Several studies in other developing countries have also shown that maternal education has a strong correlation with infant mortality (Trussel and Pebley, 1984; Mensch, 1984). Using Nigerian data, Caldwell (1979) has shown that maternal education is correlated negatively with infant mortality. A study by Frenzen and Hogan (1982) of several villages in the north of Thailand found that the higher the level of maternal education, the lower the infant mortality r a t e ,, Am ong mothers with less than three years of education, the infant mortality rate was 9'5 per 1 , 000 live births, while for mothers with more than four years , the rate was 73 per 1,000 live b i rt h s.
17
1.4,2.2« Differentials by Paternal Occupation
In many situations the father's occupation is closely related to his education. The higher the father's education, the better his occupational status. In general, father's occupation is an indicator of the household economic situation and the consumption opportunities available to children (United Nations,
1985). Thus, it is possible that father's occupation will have an effect on the infant and child mortality rates. Several studies have shown that father's occupation has a significant effect on infant and child mortality rates (Meegama, 1980; Taucher, cited in Kadarusman, 1982;
D'Souza and Bhuiya, 1982; and Caldwell and McDonald,
1981 ) .
18
D"Souza and Bhuiya (1982) analyzed the socio economic d i f f e r e n t i a l s affecting child m o r t a l i t y based on data for father's occupa t i o n from the study which was u n d e r t a k e n in Matlab, Bangladesh. Occupational c l a s s i f i c a t i o n s of fathers refer to the primary o c c u pation. There are three levels of occupations: that is, a g r i c u l t u r a l laborers are at the lowest s o c i o economic level (I); at level II, are owners/workers, persons who, while owning some lands, do in fact work for others; and the highest level (III) consists of landowners (D'Souza and Bhuiya, 1982:760). D'Souza and Bhuiya^s analysis showed that child m o r t a l i t y declined with i n creasing o c c u p a t i o n a l status. The lowest level of occu p a t i o n a l status c o n t ributed to the highest rate of child m o r t a l i t y rate (deaths of children age 1 - 4 years per 1,000 children aged 1 - 4 years). During the period 1974-1977, the child m o r t a l i t y rates in Matlab were 42.9, 27.5, and 15.9 per 1,000 children aged 1 - 4 years for father's o c c u p a t i o n I, II, and III, respectively.
1.4.2.3. D i f f e r e nt i a l s by H o u s i n g Conditions
19 little impact on infant mortality, and they concluded that there is little evidence of causal relationship. Meegama (1980), however, has found that low infant m o r t a l i t y in Sri Lanka is associated with the presence of good w a t e r - s u p p l y and lavatory facilities. Thus, there are diffe r e n c e s in the level of infant m o r t a l i t y between households which have sanitation facilities and households without any facilities.
In Matlab , B ang 1 ade s h , D " Souza and Bhuiya ( 19 8 2 ) examined the effect of the area of floor space of housing on child m o rtality. There are three groups of households according to the size o f housing : Group I consists of residential areas less than 109 square feet ; Group II consists of residential areas ranging from 170 to 242 square feet; and Group III consists of households occupying more than 243 square feet. D'Souza and Bhuiya's e x a m i n a t i o n found that the level of child m o r t a l i t y for Group I is almost twice that for group III.
1.4.3. Summary of factors a f f e cting infant and child m o r t a l i t y rates
20
result in m a l n o u r i s h e d mother during pregnancy which may cause u n h e a l t h y conditions in the baby at birth and s u b s e q u e n t l y the baby will face a high risk of death.
Based on the literature mentioned above, it is found that the declining infant and child m o r t a l i t y rates in most develo p i n g countries are due to improvement in s o c i o - e c o n o m i c conditions of the population. Parental education, e s p e c i a l l y m a ternal education, is considered an important factor. It is u n d e r s t a n d a b l e that the educated mother tends to have well developed strategies for m a x i m i z i n g the life chances of her children (LeVine, 1980; Int e r n a t i o n a l Statistical Institute, 1984). The educated mother seems to have good knowledge of how to control disease by taking personal initiatives in treating sick children by n o n - t r a d i t i o n a l methods (Caldwell and McDonald, 1981).
21
CHAPTER 2
DATA AND METHODOLOGY
2.1. Sources of Data
Ideally, the estimates of infant and child mortality should be derived from vital reg i s t r a t i o n . However, in Indonesia, the estimates of infant and child mortality, so far, have been derived m ostly from the population censuses or surveys. This is primarily due to imperf e c t i o n s in the coverage and reli a b i l i t y of vital r e g i s t r a t i o n in Indonesia (Soeradji and Ismail, 1984:14). Therefore, this study will use data from the 1980 Indon e s i a n P o p u l a t i o n Census, Indonesia's third census since In d e p e n d e n c e . The first and second censuses were carried out in 1961 and 1971, respectively.
22
2.2. L i mi t a t i o n s of Data
From the sample census of the 1980 Indonesian Population Census, some information can be used to estimate infant and child mortality levels. This information is the number of children ever born who are still living, and number of children born alive who have died. There are several shortcomings in using this information to estimate infant and child mortality. The first is memory lapse of mothers about their deceased children. This situation will produce under-reporting of the number of deceased children, and it will produce an under-estimate of infant and child mortality. The second shortcoming is misinterpretation of the meaning of stillbirth. Sometimes, stillbirths are reported as deaths of children born alive (Santow, 1983:213). This situation will produce over-reporting of deceased children, and the infant and child mortality rates will be over-estimated. The third shortcoming is that the data only cover the survivorship of children whose mothers are still alive at the census date. Accordingly, the estimates will be biased if the mortality rate of children whose mothers have died is different from those of mothers still alive (Utomo, 1983 cited in Soeradji and Ismail, 1984:16).
23 individual as the unit of analysis in this study, as will be explained in the di s c u s s i o n of the unit of analysis in the next section.
Age m i s r e p o r t i n g also affected the quality of the 1980 Indone s i a n Po p u l a t i o n Census data. When age was asked, people in some parts of West Java (mostly women) were reluctant to report their ages because of beliefs regard sorcery. Exper i e n c e showed that the information on ages of such people was m o s t l y provided by relatives or other people (McDonald, 1983:44).
Several factors, such as dietary intake and accidents, are t h e o r e t i c a l l y considered as important factors i n f l u e n c i n g infant and child mor t a l i t y (Mosley, 1982; Mosley and Chen, 1984:25-45). In explaining s o c i o economic d i f f e r e n t i a l s in infant and child mortality, household income is also important. This factor is usually related with other socio-ec o n o m i c factors, e s p e c i a l l y with ability of households to provide basic needs, such as health care, dietary intake, goods and services. However, in this study, these factors can not be included. This is due to the fact that in the 1980 Indon e s i a n Po p u l a t i o n Census those data were not collected. Accordi n g l y , u n a v a i l a b i l i t y of these data will place some l imitations on this study.
2.3. Unit of A n alysis
1 980 . It w i l l a l s o e x a m i n e s o c i o - e c o n o m i c f a c t o r s
a f f e c t i n g a r e a l d i f f e r e n c e s in i n f a n t an d c h i l d m o r t a l i t y
in 1 9 8 0 . T h u s , the d e p e n d e n t v a r i a b l e s w i l l be i n f a n t a nd
c h i l d m o r t a l i t y . F o r the p u r p o s e of the s t u d y , t h e r e ar e
two p o s s i b l e u n i t s of a n a l y s i s : c l u s t e r s of i n d i v i d u a l s ,
s u c h as r e g e n c i e s , or t he i n d i v i d u a l . S e v e r a l
c o n s i d e r a t i o n s n e e d to be t a k e n i n t o a c c o u n t w h e n
d e c i d i n g w h i c h u n i t of a n a l y s i s w i l l be e m p l o y e d ; n a m e l y ,
a v a i l a b i l i t y of d a t a , a nd the i m p o r t a n c e of s t u d y
r e s u l t s f or d e v e l o p m e n t p l a n n i n g , e s p e c i a l l y at r e g e n c y
l e v e l .
T h e 1 9 8 0 I n d o n e s i a n P o p u l a t i o n C e n s u s p r o v i d e s m u c h
i n f o r m a t i o n on t he s o c i o - e c o n o m i c c h a r a c t e r i s t i c s of t he
p o p u l a t i o n of e a c h r e g e n c y , s u c h as e d u c a t i o n , o w n e r s h i p
of t e l e v i s i o n a nd r a d i o , a v a i l a b i l i t y of e l e c t r i c i t y ,
p i p e d w a t e r as s o u r c e of d r i n k i n g w a t e r , h o u s i n g
c o n d i t i o n s a n d t o i l e t f a c i l i t i e s . A c c o r d i n g l y , for
p r a c t i c a l p u r p o s e s , e m p l o y i n g the r e g e n c y as the u n i t of
a n a l y s i s w i l l g i v e v a l u a b l e r e s u l t s f or d e v e l o p m e n t
p l a n n i n g s i n c e the s t u d y e x a m i n e s h o w the d e p e n d e n t
v a r i a b l e s of i n t e r e s t are r e l a t e d to s o m e s o c i o - e c o n o m i c
c h a r a c t e r i s t i c s in the r e g e n c y .
25 will affect d i rectly the i m p l e m e n t a t i o n of development programs under his j u r i s d i c t i o n (Soeradji and Ismail, 1 984 ) .
The present study will not employ the individual as the unit of analysis. This is due to several reasons. The e m ployment of individuals as the unit of analysis in m o r t a l i t y study seems to be more a p p r opriate when the data are not the results of population census but rather service statistics such as vital regist r a t i o n . However, in Indonesia the coverage of vital r e g i s t r a t i o n data, as m e n t i o n e d above, is incomplete.
26 the i n f o r m a t i o n on the date of child death was not collected. The lack of this i n f o rmation will restrict the analysis of infant and child m o r t a l i t y because of the d i f f i c u l t y in d e t e r m i n i n g the specific reference period for the analysis.
It is, however, quite appropriate to choose regencies as the unit of analysis in this study. Using this unit, the study has the advantage of identifying high infant and child m o r t a l i t y areas so that programs can be developed to reduce the high infant and child mortality.
2.4. Method of Analysis
Before beginning the m ul t i v a r i a t e analysis, the
following steps will be performed. The corre l a t i o n of
each variable with infant or child mortality, that is the
zero order correlation, is examined. Along with this
step, an e x a m i na t i o n of the scatterplot of each variable with infant or child m o r ta li ty is also done. Independent variables which have insign i f i c a n t corr e l a t i o n with infant or child m o r ta l i t y will not be employed in the m u lt iv a ri at e analysis. Furhermore, to m inimize the effect
of mul t i c o 11 i ne r i t y , that is in the case where some of the i ndependent variables are i nt er - c o r r e l a t e d , only the dominant variables, as shown by the highest c orrelation
coefficient, among each group of indicators will be
included in the model. These steps are meant to limit
the number of variables to be included in the
m u lt iv a ri a te analysis. Too many variables to be included
in the model will hamper the i n t e r p r e ta t io n of the
results obtained.
Once the set of variables is selected, analysis of the v a r iables a s sociated with infant or child mo r t a l i t y
can be performed. The analysis is done by employing
28
2.4.1. The Structure of M u l t iv a ri at e Areal Analysis
The linear r e gression model formulated by Hermalin (1975:258) is employed in this study. The model is :
Yi = Bo + BIXli + B 2 X 2 i + 33X3i + Ei
where Yi r e presents infant or child m o r t a l i t y in the ith regency,
X 1i represents a set of demo g r a p h i c variables, X2i is a measure of socio - e c o n o m i c variables, X3i is a measure of health variables, and
gi is the error or d i s t urbance term representing all u n measured influences on infant or child m o rtality.
The use of this model in the analysis is subject to a number of a s s u mptions (Hermalin, 1975:258; Guns and Mason, 1930; D u n t e m a n t , 1984:52). These assumptions are :
i. The model is correctly specified, ii. The absence of m u l t i c o 1 1 i n e a r i t y ,
iii. The i ndependent variables are p r e d etermined and m e asured without error,
iv. Model error terms have zero means, un correlated, and have constant variance,
v. Model error terms follow a normal p r o b ability d i s t r i b u t i o n if F— test is to be used.
29 they a p p r o p r i a t e l y enter and affect the response as linear terms (Gunst and Mason, 1980:169). In other words, the infant or child m o r t a l i t y is a linear function of the d e m o g r a p h i c , s o c i o - e c o n o m i c and health variables. In this study, the linearity of the model is tested through plotting the scatterplot of each independent variable and its dependent variable.
Actually, A s s u m p t i o n (ii), that is the absence of m u l t i c o 1 1 inea r i t y , is not one of essential assumptions. The existence of m u l t i c o 1 1 inearity does not invalidate a
r e gression analysis, but it introduces some rather serious problems (Freund and Minton, 1979) in terms of i n t e r p r e t a t i o n of the results obtained (partial re g r e s s i o n co e f f i c i e n t s ) . In the case where m u l t i c o 1 1 inea r i t y exists, the partial regression coeffic i e n t s should be inte r p r e t e d cautiously. To test whether m u l t i c o 1 1 inea r i t y exists or not, the correlations between i n d e pendent variables are e m p i r i c a l l y tested by c a l c u l a t i n g the ma t r i x c o r r e l a t i o n (see Appe n d i x Table B.l). Table B.l shows that some of the independent variables use in this study are i n t e r - c o r r e l a t e d . For example, the three e d u c a t i o n indicators are positively and highly correlated with the economic indicators.
30
would seem to be in doubt. However, for practical purposes, the use of regression technique is not prohibited as long as the dependent variable has no influence on the value of the independent variables (see Freund and Minton, 1979).
In many practical problems, A s s u mptions (iv) and (v) are fr e q u e n t l y violated. But it has been found that regres s i o n analysis procedures are re l a t i v e l y "'robust', that is, v i o l a t i o n s of these assumptions do not greatly affect the v a l i d i t y of the results obtained (Freund and Minton, 1979; Guns and Mason, 1980).
2.4.2* V ar i a bl e s C o n s i d e r e d in the A nalysis
Based on the model above, the following four groups of variables are considered in the analysis:
I. M o r t a l i t y Indicators (dependent variables) 1. Infant Mor t a l i t y
2. Child Mor t a l i t y
The dependent variables in this study pertain to the p r o b a b i l i t y of dying between birth and exact age one year (q ( 1 ) ) m u l t i p l i e d by 1 , 000 for infant mortality, and the p r o b a b i l i t y of dying between birth and exact age three years (q(3)) m u l t i p l i e d by 1,000 for child mortality.
31
is the probability of dying between birth and exact ages
two and three years respectively. These values were not
presented in Soemantri's paper, but were calculated based
on
the
1980
Indonesian
Population Census
data using
Trussell's
method
and
West
Model
Life
Table
(see
Soemantri et al, 1984).
In this study, q ( 3) is used rather than q(2). This
is due to the fact that in some regencies the values of
q ( 2 ) are less than q(l), indicating some degree of error
in the q (2) values. The values of q ( 3) are calculated by
the author from the 1980 Indonesian Population Census
data tapes using Trussell's method (Trussell, 1975:97-
107)
and the West Model Life Table. The values of q(1) x
1,000 and q(3) x 1,000 are presented in Table 3.1.
It
should
be
noted
that
the
value
of q ( 3 )
automatically capture the condition of q(l). Hence, in
the final analysis, that is multiple regression analysis,
only q ( 3) will be used in explaining regional differences
in infant and child mortality in West Java.
32 Thirdly, the standard error of estimates from Trussell's m ethod is the smallest compare with other methods (see Trussell, 1975:97-107).
II. D e m og r a p h i c Var i a b l e s ( i n dependent variables)
1. Mean number of children ever born (CEB) 2. P o p u l a t i o n Density (POPDEN)
3. Percentage Ever Married among Women aged 15-24 years (EMW)
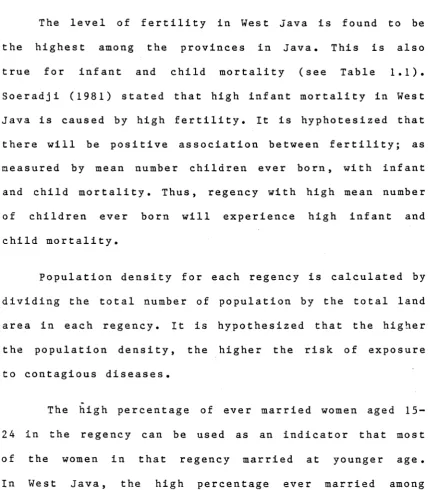
The level of f e r t ility in West Java is found to be the highest among the provinces in Java. This is also true for infant and child m o r t a l i t y (see Table 1.1). Soeradji (1981) stated that high infant m o r t a l i t y in West Java is caused by high fertility. It is hyphote s i z e d that there will be positive a s s o c i a t i o n between fertility; as meas u r e d by mean number children ever born, with infant and child mortal i t y . Thus, regency with high mean number of children ever born will experience high infant and child mortality.
P o p u l a t i o n density for each regency is calculated by dividing the total number of popul a t i o n by the total land area in each regency. It is hyp o t h e s i z e d that the higher the p o p u l a t i o n density, the higher the risk of exposure to contagious diseases.
[image:47.550.74.505.273.764.2]33
women aged 15-24 years is considered as the major cause of the high fertility rate ( N u r d i n , 1986:35). Fur t he rmo r e , Soeradii (1983) stated that since West J ava has a high fertility rate, the infant m o r t a l i t y rate is also high . Thus , it is possible t 0 expect that the pe rcent age ever m a r r i e d among women aged 15-24 may influence infant and child mortality.
III. S o c io - E c o n o m i c V ar i a b l e s ( I n dependent V a r i a b l e s )
1. Lite r a c y Level (LITLEV)
2. P e rcentage of p o pulation aged 10 years and over who are able to speak the national language (NATLANG)
3. Perce n t a g e of women aged 10 years and over who have completed at least e l ementary school (WEDÜC)
4. Average floor area of households (HHFS) 5. Percen t a g e of households possessing radio
(H H R A D )
6. Percentage of households p o ssessing t ele vision (H H T V )
7. P e rcentage of households with elec t r i c i t y as source of lighting (HHELECT)
8. P e rcentage of households with piped water as source of drinking water (HHPIPED)
9. Female labour force p a r t i c i p a t i o n rate (FPR) 10. Percen t a g e of agricul t u r a l households (HHAGR)
34
no or low e d u cation usually have low income, and may live in u n h e althy conditions in an u n hygienic environ m e n t . Therefore, they may experience a higher risk of m o r b i d i t y and mortality. Education level is also consid e r e d to be indicator of the level of m o d e r n i z a t i o n (Hermalin, 1975:260). The more modern a society, the more likely that the society will accept a new idea or
t e c h n o l o g y for improvement, including m odern medical treatment. Thus, the higher the edu c a t i o n level, the lower the m o r b i d i t y rate, and in turn, the lower the infant and child m o rtality. For the purpose of this study, literacy level is meas u r e d as the percentage of p o p u l a t i o n aged 10 years and over who are able to read and write.
The ability to speak the national language is expected to have an effect because it f acilitates receiving and u n d e r s t a n d i n g the directives of the government, p a r t i c u l a r l y infor m a t i o n regarding to health program and family planning.
child m o r t a l i t y will be lower in that regency. For the purpose of the study, women education is measured by the percentage of women aged 10 years and over who have completed at least elemen t a r y school.
The variables, average floor area of households, percentage of households p o ssessing radio or television, percentage of households with elec t r i c i t y as source of lighting, and percentage of households with piped water for d r inking are considered as proxies of income. Also, these v a r iables are used in mea s u r i n g the welfare of the p opulation. The wea l t h i e r the people in the regency the lower the infant and child m o r t a l i t y in that regency.
[image:50.550.62.504.60.684.2]36
The
next
variables
are
percentage
of
households
possessing radio, and television.
These variables can be
considered as indicators of access to information. The
effect of these variables is expected to be similar to
the ability to speak the national language.
Contaminated water has been suggested as the cause
of diarrhoeal disease, which is one of the leading causes
of child mortality in
Indonesia
(Utomo
and
Iskandar,
1986:40).
Having piped water for drinking can prevent
diarrhoeal disease. Thus,
it is quite possible to expect
that the higher the percentage of households with piped
water as source of drinking water, the lower the infant
and child mortality.
The
last
two
variables,
female
labour
force
participation
rate
and
percentage
of
agricultural
households, are economic indicators. According to Nurdin
(1986)
almost
25
per cent of women aged
10
years and over
37
years and over. The e c o n o m i c a l l y active is defined as p o pulation who are working and t e m p orarily working. Meanwhile, working itself is defined as worked at least two days in the previous week or t e m p o r a r i l y working (Biro Pusat Statistik, 1981)
IV. Health Variables (independent variables).
1. M o r b i d i t y Rate (MORBID)
2. Percen t a g e of sick people who obtained treatment from medical personnel (TREAT) 3. Number of Pusat K e s ehatan Masyarakat
(Public Health Centres) (PHC)
4. P e rcentage of households which have their own toilet facilities (HHTOIL)
38
One of the government's efforts in improving the health condition of the population is the establishment of public health centres (Pusat Kesehatan Masyarakat) in every densely populated district (kecamatan). By establishing public health centres, the government expects that the people in the districts can obtain health services easily. This means that health services become accessible especially for the people who are living far away from the cities where the hospitals are located. Thus, the number of public health centres per 10,000 population is expected to have an effect in improving the health of the population, and as a result will lower infant and child mortality.
39
CHAPTER 3
AREAL DIFFERENCES IN INFANT
MORTALITY AND SOCIO-ECONOMIC CONDITIONS
3.1. Introduction
Administratively, West Java consists of 20 regencies
and four municipalities (see Figure 3.1). In general, a
municipality
is predominantly an urban area. The urban
areas
contain
most
of
the
country's
well
educated,
relatively high income population and the best medical facilities. Thus, the socio-economic condition of the population in municipalities is better than in regencies. This chapter will examine the areal differences in infant mortality and socio-economic conditions in West Java in1 980 .
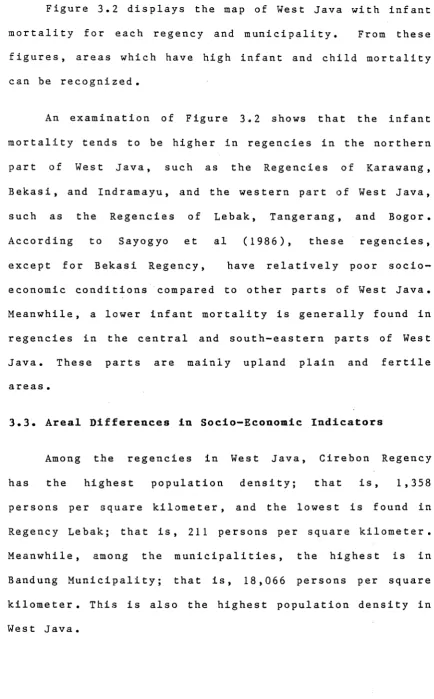
3.2. Areal Differences in Infant Mortality
[image:54.550.67.518.217.725.2]3
.1
:
M
ap
o
f
W
e
st
Java
o
<r
E