Int. J. Electrochem. Sci., 11 (2016) 10607 – 10619, doi: 10.20964/2016.12.70
International Journal of
ELECTROCHEMICAL
SCIENCE
www.electrochemsci.org
Facile Simultaneous Determination of Hydroquinone and
Catechol Using Nitrogen-doped Graphene Modified Electrode
Zan Lu, Dongning Li, Qianli Zhang*, Jie Wei*
School of chemical biology and materials engineering, Jiangsu Key Laboratory for Environment Functional Materials, Suzhou University of Science and Technology, Suzhou, 215009, Jiangsu, China
*
E-mail: zqlmhb@163.com, 1531041457@qq.com
Received: 19 September 2016 / Accepted: 16 October 2016 / Published: 10 November 2016
Nitrogen doped reduced graphene oxide (N-RGO) was prepared by a facile one-step procedure with ammonium hydroxide as the doping regent and hydrazine hydrate as the reducing regent. The obtained N-RGO was characterized by transmission electron microscope (TEM), Fourier transform infrared spectra (FTIR) and X-ray photoelectron spectroscopy(XPS). The characterized results validated the successful nitrogen doping of 1.8 at% and the reducing of graphene oxide to RGO. N-RGO modified glassy carbon electrode (N-RGO/GC) was explored for the simultaneous determination of hydroquinone (HQ) and catechol (CC) using cyclic voltammetry (CV) and differential pulse voltammetry (DPV). The potential separation of the oxidation peaks between HQ and CC were up to 110 mV, which is enough to electrochemical distinguish the dihycroxybenzene isomers. Under the optimal conditions, the oxidation peak currents of HQ and CC linearly increased with the concentrations in the ranges from 5 to 693 and 5 to 492 mol/L, respectively. The detection limits are 0.1 mol/L for HQ and 0.5 mol/L for CC. When simultaneously changing the concentration of the two isomers, the linear range was from 15 to 330 mol/L for both HQ and CC. The relative standard deviations (n=20) are 3.45% for HQ and 3.82 % for CC.
Keywords: Nitrogen doping; graphene; simultaneous determination; hydroquinone; catechol
1. INTRODUCTION
quickly and are highly toxic for people and animals even at very low concentration. The exposure to the pollution containing HQ and CC through skin adsorption, inhalation of vapors, or direct ingestion may cause fatigue, headache, liver function decrease, kidney damage. CC is also found in the abundant organic constituents of cigarette smoke and it is reported to be damage to DNA and may cause cancer[5]. HQ and CC often coexist in real samples and interfere with each other resulted from their similar structure and properties. Therefore, the study of sensitive and stable analytical methods for simultaneously determination of HQ and CC is of importance in environmental monitoring and industrial analyzing.
HQ and CC can be effective and sensitive simultaneous determined by chromatography[6,7]. However, the low analytical speed, expensive instrumentation, sophisticated and time-consuming preparation of these analytical techniques limit their applications in routine and on-site analyses. Compared with the above separation analytical methods, amperometric voltammetry has the advantages of rapid response, low cost, excellent sensitivity and simple preparation and operation[8,9]. Both HQ and CC have basic quinone structures which can be electrochmical oxidized on the electrode[10]. Hence, amperometric voltammetry is usually considered to be a attractive and promising method for detecting HQ and CC in environmental and industrial analysis.
However, simultaneous determination of HQ and CC by amperometric voltammetry is faced with several challenges when the conventional solid electrodes such as glassy carbon electrode, carbon paste electrode, and metal electrode are used. Firstly, voltammetric peaks of HQ and CC are overlapped in many cases because of their similar structure and properties[11,12]. Secondly, the competitive adsorption of HQ and CC on the electrode surface always damages the linear relationship between peak current and concentration. Thirdly, the electroactive intermediates such as phenoxytype radial of oxidation of HQ and CC may react with nearby radicals to form passive insulating polymers which may cause electrode fouling. The degree of electrode fouling is influenced by type of electrodes, buffer solution compositions, pH of buffer solution, concentration of HQ and CC, and scanning voltage, etc [13].
To overcome the above problems, great efforts have been made for simultaneously determination of HQ and CC with high sensitivity and good stability. Both enzymatic electrodes and non-enzymatic electrodes (chemical modified electrode) are reported in the references. For instance, tyrosinase based electrodes are capable of catalyzing the oxidation of CC and are the most pervasive electrode in electrochemical sensing of CC[14,15]. Though enzymatic electrode can provide high sensitivity and low detection limits, there are several inherent disadvantages of enzymatic electrode such as intricate processes for immobilization of enzyme, performance variation with time, and limited working and storage conditions. Thus, electrode modified with different materials is considered as the promising electrode for directly detection of HQ and CC. Usual electrode modification strategy is making full use of carbon nanomaterials, metal or metal oxide nanomaterials, polymer, and ion liquid[16-25].
determination of HQ and CC. Zheng et al[27] developed polydopamine reduced graphene oxide nanocomposite modified electrode for the same purpose. In the above references, ion liquid BMIMPF6 and polydopamine are the functionalization reagents to improve the RGO’s stability and dispersibility because RGO is naturally inclined to agglomerate irreversibly through van der Waals interactions. The RGO functionalized with metal oxide, polymer, etc has been reported for the simultaneous determination of HQ and CC[28-34]. Chemical doping, especially nitrogen doping, is another well known efficient strategy to improve the graphene’s properties. It has been reported that nitrogen doping can resulted in the increasing of surface area of RGO, the improvement of water dispersion of graphene[35,36]. Moreover, metal free nitrogen doping graphene possessed outstanding advantages of stability and low cost. The incorporation of nitrogen by preelectrolyzing GCE in ammonium carbamate aqueous solution had been reported for the sensitive simultaneous determination of hydroquinone (HQ) and catechol (CC)[37]. Nitrogen doping RGO (N-RGO) is expected to be an ideal electrode modification material for amperometic detection of HQ and CC. Herein, N-RGO modified electrode was fabricated and its potential application was tested for the simultaneous determination of HQ and CC. The potential separation of HQ and CC was 110 mV on the N-RGO modified electrode, which resulted in a easy amperometic simultaneous determination of HQ and CC. The detection limits were 0.1 μmol/L and 0.5 μmol/L for HQ and CC, respectively. Furthermore, N-RGO modified electrode was simple fabricated and showed good stability, which were very important in real sample analysis.
2. EXPERIMENTAL
2.1. Materials
Hydroquinone (HQ), catechol (CC), graphite powder, hydrazine hydrate (85%), N,N-dimethylformamide (DMF) were obtained from Shanghai Aladdin Chemical Reagent Company (Shanghai, China, www.aladdin-reagent.com). All the other reagents were purchased from Shanghai sinopharm chemical reagent Co., Ltd. In this study, all chemicals were analytical grade and used without further purification. The aqueous solutions were prepared with twice-distilled water (18.2 M).
2.2. Preparation of N-RGO
N-RGO was prepared using a frequently-used hydrothermal method with graphene oxide (GO) as the raw material, ammonium hydroxide as the doping regent, and hydrazine hydrate as the reducing regent.
The synthesized process for GO was described in our previous work using the modified Hummer’s method[38,39]. Briefly, 1.0 g graphite powder was mixed with 1.0 g NaNO3 and 33 mL
H2SO4 (98%) in a water-ice bath. 6.0 g KMnO4 was slowly added to the above mixture at 35℃ for 1.5
The mixture was purified by centrifugation and thoroughly washed with water. After the complete removal of remaining salts and acid, the resulting GO suspension was further treated by ultrasonication to obtain exfoliated GO.
For typical synthesis of N-RGO, 300 mL GO (0.25 mg/mL) was mixed with 105 L hydrazine hydrate (50%, v/v) and 75 L ammonium hydroxide (25%, v/v). The mixture was maintained at 95℃ in a reflux condenser for 2 h with stirring. The mixture was also purified by centrifugation and thoroughly washed with water, and then dried at 60℃ in a vacuum for further characterization. N-RGO was characterized on JEM-2100F TEM (www.jeol.co.jp/en.com), K-Alpha X-ray photoelectron spectroscopy (XPS, ThermoFisher, E. Grinstead, UK) with Al Ka X-ray radiation at 1486.6 eV, and Fourier transform infrared (FT-IR) on a Nicolet NEXUS670 spectrometer (http://web.ysu.edu/gen/stem).
2.3. Electrochemical experiments
The electrochemical experiments were carried out on a RST-5000 electrochemical workstation (Suzhou Risetest Electronic Co., Ltd., China) with a standard three-electrode electrochemical system, in which a bare or modified glassy carbon electrode (GCE, 3mm in diameter), platinum wire, and Ag/AgCl electrode were used as the working electrode, counter electrode, and reference electrode, respectively.
For preparation of RGO modified glassy carbon electrode (denoted as RGO/GC), 1 mg N-RGO was put into 1 mL H2O, and ultrasonicated for 30 min. Next, 6 L N-RGO was uniformly casted
on the clean GCE and dried in air, followed by coating with another layer of Nafion (0.05 wt%) with the volume of 4 L.
The cyclic voltammograms (CVs) and differential pulse voltammograms (DPVs) were recorded after preconcentration in -0.2 V for 60 s in 10 mL 0.1 mol/L PBS (pH 7.0). DPV analysis was performed under the following settings: step potential of 4 mV, amplitude of 50 mV, pulse width of 0.2 s, sample width of 0.02 s, and pulse period of 0.5 s. All measurements were performed at 25 ℃.
3. RESULTS AND DISCUSSION
3.1. Characterization of N-RGO
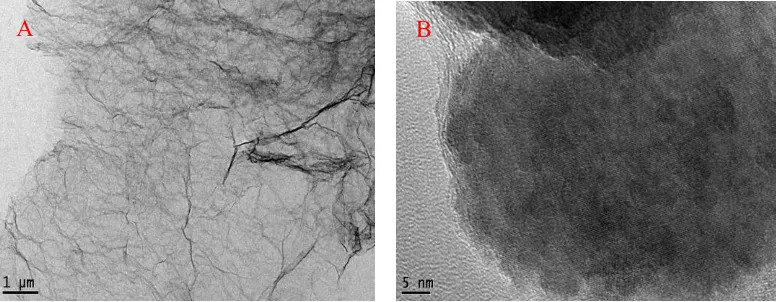
Figure 1. TEM (A) and HRTEM (B) images of N-RGO.
As shown in Fig. 2, the FT-IR spectrum of GO shows four types of carbons (Fig. 2, curve b): the stretching vibration of C=O band at 1736 cm-1, skeletal vibration of C=C band at 1636 cm-1, stretching vibration of C-OH band at 1232 cm-1, and stretching vibration of C-O band at 1056 cm-1. Besides the above bands, there is a strong band at 3432 cm-1, which is due to the O-H stretching vibration[40]. Compared with the FT-IR spectrum of GO, the characteristic peak of C=O stretching at 1739 cm-1 is almost disappeared for N-RGO (Fig.2, curve b). Moreover, the peak of C-H stretching at 2847 cm-1 and 2942 cm-1 appear in the FT-IR spectrum of N-RGO and the peak of C=C stretching at 1636 cm-1 is stronger than that of GO. The above changes are resulted from the complete reduction of GO to RGO[41]. In addition, the peak of C-N stretching at 1183 cm-1 and 1083 cm-1 also emerge in the FT-IR spectrum of N-RGO and the peak of O-H or N-H stretching at 3432 cm-1 is also stronger than that of GO, which display the successful doping of nitrogen to RGO.
3600 3000 2400 1800 1200 1183 1083 C-N 1630 C=C
1736 C=O
Transm
issio
n
/ a.u
.
Wavenumber / cm-1
3432 O-H N-H
2942 2847 C-H
a
b
Figure 2. FT-IR spectra of GO (curve a) and N-RGO (curve b).
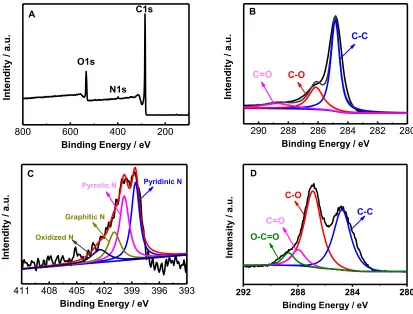
X-ray photoelectron spectroscopy (XPS), a effective method for studying elemental composition and valence state of materials, was performed to determine the oxidation state and surface composition of the prepared N-RGO (Fig.3). It is shown in Fig. 3A that the peaks at 533.2, 399.5, and
[image:5.596.180.417.487.657.2]
284.8 eV correspond to O1s, N1s, and C1s, respectively, revealing the presence of N in N-RGO as supported by the FT-IR result. According to the results of XPS measurement, the N content in N-RGO was 1.8 at%.
Fig. 3 B and C demonstrate the high-resolution C 1s and N 1s spectrums of N-RGO. On basis of the result of deconvolution, there are three representative peaks in C1s region at binding energies of 284.7, 286.2, and 288.7 eV, which can be attributed to the C-C, C-O, and C=O functional groups, respectively. The peak of the C-C groups at 284.7 eV is the strongest one among the above three peaks, while the other peaks (C-O, and C=O bonds) are very weak (Fig. 3B), showing that the C-C groups are the predominant in N-RGO[42]. In the high-resolution C 1s spectra of GO (Fig. 3 D), the peak at 287.0 eV from the C-O bond is stronger than others, and the peak at 288.7 eV is belong to the O=C-O bond. The fact of effective reduction of GOs to RGOs can be deduced by the change of peak intensity of C-C and C-O bond in the C 1s region of N-RGO and GO, and the disappearance of O=C-O bond in the C 1s region of N-RGO[43].
Fig. 3 C depicts the high-resolution N 1s spectra of N-RGO. The deconvoluted N 1s region shows four different types of nitrogen: pyridinic-N, pyrrolic-N, graphitic-N, and oxidized-N, and the ratio of nitrogen is found to be 41.9, 35.4, 15.9 and 6.8 at%. Pyridinic, pyrrolic, and graphitic N are reported as the active species of the element. As will be discussed later, the high catalytic activity of N-RGO for the electro-oxidation of HQ and CC may be attributed to the presence of active nitrogen in N- RGO.
[image:6.596.93.506.413.727.2]
Figure 3. XPS survey spectra of RGO (A); High resolution C1s spectra (B) and N1s spectra of N-RGO (C); High resolution C1s spectra of GO (D).
800 600 400 200
O1s A
N1s
In
tendi
ty /
a.
u.
Binding Energy / eV C1s
290 288 286 284 282 280
C=O C-O
C-C B
In
tendi
ty /
a.
u.
Binding Energy / eV
411 408 405 402 399 396 393
Oxidized N Graphitic N
Pyrrolic N Pyridinic N
C
In
tendi
ty /
a.
u.
Binding Energy / eV
292 288 284 280
In
tensity /
a.
u.
Binding Energy / eV
C-O
C=O
O-C=O
C-C
3.2. Voltammetrc response of N-RGO modified electrode to HQ and CC
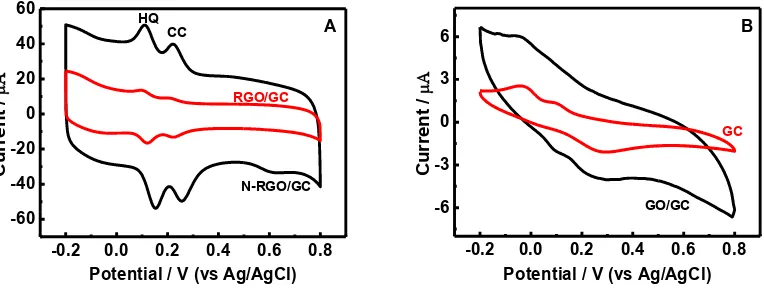
Fig. 4 displays the CVs of 80 μmol/L HQ and 80 μmol/L CC at bare GC electrode, and N-RGO, N-RGO, GO modifed electrodes in 0.10 mol/L PBS (pH 7.0) at 50 mV/s. It is shown that broad redox peaks is obtained on bare GC and GO modified electrode due to the overlap of the oxdation/reduction peaks of HQ and CC. The poor electrochemical signals of HQ and CC on GO/GC are owing to the low electric conductivity of GO containing many oxygen groups[44]. However, the oxdation/reduction peaks of HQ are clearly separated form those of CC on RGO and N-RGO modified GC electrodes, and two couple of well-define quasi-reversible redox peaks are observed for HQ and CC. Compared with RGO/GC, both the oxidation peak current and the reduction peak current of HQ and CC at N-RGO/GC are sharper and four times larger than those of RGO/GC, indicating that the nitrogen doping promotes the electron transfer at the modified electrode interface, and increase electrochemical signals of HQ and CC. On N-RGO/GC, the reduction and oxidation peak potential of HQ are at 0.11 and 0.15 V, and those of CC are at 0.22 and 0.25 V. The cathodic (ΔEpc) separation
between HQ and CC are up to 110. The CV of HQ and CC at N-RGO/GC is in agreement with those of other different modified electrodes reported in earlier references. Thus, it is most practical and reasonable for simultaneous determination of HQ and CC using N-RGO/GC.
[image:7.596.102.484.377.521.2]
Figure 4. CV of 80 μmol/L HQ and 80 μmol/L CC at N-RGO/GC and RGO/GC (A), GO/GC and GC (B) electrodes in 0.10 mol/L PBS (pH 7.0) at 50 mV/s.
3.3. Effect of pH
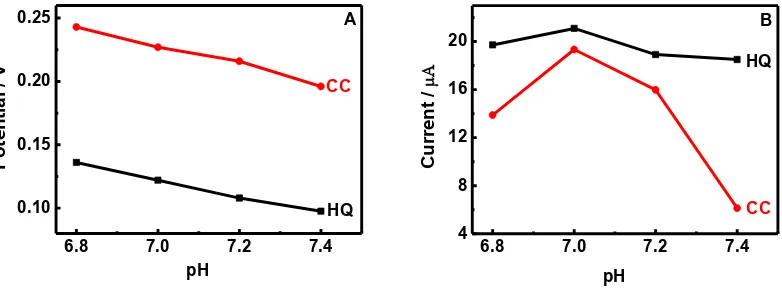
The pH effects on the oxidation of HQ and AC at N-RGO/GC are studied in the pH range from 6.8 to 7.4 in 0.1 mol/L phosphate buffer solutions (Fig. 5). In Fig.5 A, both the oxidation potential of HQ and that of CC are observed to be negatively shifted with the increase of pH values from 6.8 to 7.4, indicating that protons are involved in the electrode reaction process. The corresponding oxidation mechanism of HQ and CC is demonstrated in Scheme 1[24]. This phenomena is also reported the previous reference[18].
Fig. 5 B shows the effects of pH values on the oxidation currents of HQ and CC. As can be seen that the peak current of HQ slightly changed, and the peak current of CC is influenced seriously in the investigated pH range. The peak currents of CC increase with the pH values and reach the
-0.2 0.0 0.2 0.4 0.6 0.8
-60 -40 -20 0 20 40 60
CC HQ
N-RGO/GC
A
Curr
ent /
Potential / V (vs Ag/AgCl)
RGO/GC
-0.2 0.0 0.2 0.4 0.6 0.8
-6 -3 0 3 6
GO/GC
B
Curr
ent /
Potential / V (vs Ag/AgCl)
[image:8.596.94.485.137.281.2]
maximum at pH 7.0. When pH is above 7.0, the peak currents decrease rapidly with the increase of pH values. Therefore, pH 7.0 was chosen as the optimized buffer pH condition.
Figure 5. Effects of pH on the peak potential (A) and peak Currents (B) for the oxidation of 80μmol/L HQ and 80μmol/L CC on N-RGO/GC in 0.1 mol/L phosphate solutions at 50 mV/s.
Scheme 1. Electro-chemical reaction of HQ and CC
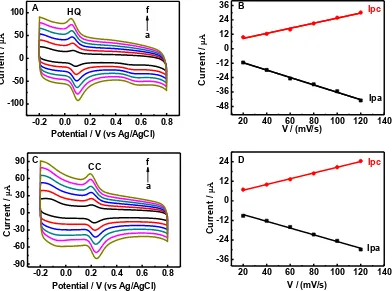
3.4 Effect of scan rate
The effect of scan rate on the redox behavior of HQ and CC is investigated at N-RGO/GC. Fig. 6 A and C demonstrate CVs of 80μmol/L HQ and 80μmol/L CC at different scan rates in the range of 20-120 mV/s, respectively. The redox peak currents of HQ and CC are found to increase with the increase of scan rate in the investigated range. Meanwhile, the oxidation peaks of HQ and CC shift more positive potential, and the reduction peaks shift to more negative potential. A good linear relationship between Ip vs. scan rate is displayed in Fig. 6 B and C for HQ and CC, respectively. The regression equations of HQ are Ipa = -0.31 - 5.43 and Ipc = 0.21 + 4.32 (Ip in A, in mV/s)with the correlation coefficients (R) of 0.9957 and 0.9897, respectively. The regression equations of CC are Ipa = -0.21 - 4.28 and Ipc = 0.18 + 2.99 (Ip in A, in mV/s)with the correlation coefficients (R) of 0.9924 and 0.9977, respectively. The above results confirms that the electrode reactions of HQ and CC are a surface controlled process in the scan rate rage of 20-120 mV/s, which is also reported by Li et al. [10]
6.8 7.0 7.2 7.4
0.10 0.15 0.20 0.25
HQ
CC
A
pH
Potenti
al
/
V
6.8 7.0 7.2 7.4
4 8 12 16 20
HQ
CC
B
pH
Curr
ent /
Figure 6. Effect of scan rates on the redox behavior of 80μmol/L HQ (A) and 80μmol/L CC (C) at N-RGO/GC, scan rate (a-f): 20, 40, 60, 80, 100, 120 mV/s; Plot of peak current versus scan rate for HQ (B) and CC (D).
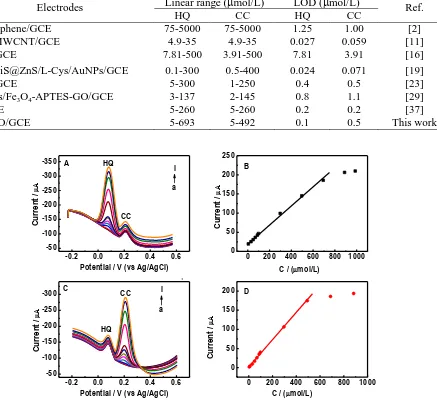
3.5. Simultaneous determination of HQ and CC
Fig.7 and Fig.8 illustrate simultaneous detection of HQ and CC on the N-RGO/GC in 0.1 mol/L phosphate solutions. In Fig. 7A and B, the anodic peak currents of HQ are linearly increased with the HQ concentrations in the range of 5 - 693 mol/L in the presence of 80 mol/L CC. The regression equation is Ipa (A) = 20.2108 + 0.2459 C (mol/L) (r = 0.9967). Similar trend is obtained by increasing the CC concentrations from 5 to 492 mol/L with a regression equation of Ipa (A) = 1.1644 + 0.3548 C (mol/L) (r = 0.9984) in the solution containing 80 mol/L HQ (Fig. 7 C and D). The detection limits of HQ and CC are found to be about 0.1 and 0.5 mol/L at 3 folds of the signal-to-noise ratio (S/N = 3), respectively, which are lower than those obtained on the polydopamine graphene modified electrode[27], but slightly higher than those on the Graphene/MWCNTs/BMIMPF6
modified electrode[26].
Fig. 8 displays the DPV responses of the N-RGO/GC with the simultaneous increase of HQ and CC concentration. The anodic peak currents of HQ and CC are also observed to be linearly increased accordingly. The line arrange is from 15 to 330 mol/L for both HQ (Ipa (A) = -0.1887 + 0.2546 C(mol/L)(r = 0.9978) ) and CC (Ipa (A) = 1.2883 + 0.2886 C(mol/L) (r = 0.9983)). The similar results of Fig. 7 and Fig. 8 show that The oxidation processes of HQ and CC are independent on N-RGO/GC. Thus, independent or simultaneous assays of the two targets are not interfered with
-0.2 0.0 0.2 0.4 0.6 0.8
-90 -60 -30 0 30 60 90
CC f
a C
Curr
ent /
Potential / V (vs Ag/AgCl)
20 40 60 80 100 120 140
-36 -24 -12 0 12
24 D Ipc
Ipa
V / (mV/s)
Curr
ent /
-0.2 0.0 0.2 0.4 0.6 0.8
-100 -50 0 50
100 A HQ
Curr
ent /
Potential / V (vs Ag/AgCl)
f
a
20 40 60 80 100 120 140
-48 -36 -24 -12 0 12 24
36 B Ipc
Ipa
V / (mV/s)
Curr
ent /
[image:10.596.90.527.230.630.2]
each other on N-RGO/GC, which can be selectively and sensitively used for the simultaneous determination of HQ and CC. A comparison of the N-RGO/GC with the recent relative modified electrodes is shown in Table 1. As can be seen that the N-RGO/GC provided not only a simple modified strategies but also a suitable linear range and a suitable detection limit for the simultaneous determination of HQ and CC without interference with each other.
Table 1. Comparison of the N-RGO/GC with other reported modified electrodes for the simultaneous detection of HQ and CC
Electrodes Linear range (mol/L) LOD (mol/L) Ref.
HQ CC HQ CC
Pd-graphene/GCE 75-5000 75-5000 1.25 1.00 [2] NiO/MWCNT/GCE 4.9-35 4.9-35 0.027 0.059 [11] PTA/GCE 7.81-500 3.91-500 7.81 3.91 [16] ZnS/NiS@ZnS/L-Cys/AuNPs/GCE 0.1-300 0.5-400 0.024 0.071 [19]
CNF/GCE 5-300 1-250 0.4 0.5 [23]
AuNPs/Fe3O4-APTES-GO/GCE 3-137 2-145 0.8 1.1 [29]
N-GCE 5-260 5-260 0.2 0.2 [37]
N-RGO/GCE 5-693 5-492 0.1 0.5 This work
Figure 7. (A) DPV of the N-RGO/GC in 0.1 mol/L phosphate solutions (pH 7.0) containing 80 μmol/L CC in the presence of different concentrations of HQ (a-l): 0, 5, 30, 50, 69, 89, 99, 298, 496, 693, 889 and 987 μmol/L. (B) The calibration curve of the HQ concentrations vs. the anodic peak currents. (C) DPV of the N-RGO/GC in0.1 M phosphate solutions (pH 7.0) containing 80 μmol/L HQ in the presence of different concentrations of CC: 0, 5, 10, 30, 49, 69, 88, 98, 296, 492, 688 and 883 mol/L. (D) The calibration curve of the CC concentrations vs. the anodic peak currents. DPV settings: step potential, 5 mV; amplitude, 60 mV; pulsewidth, 0.05 s; sample width, 0.01 s and pulse period, 0.2 s.
-0.2 0.0 0.2 0.4 0.6
-50 -100 -150 -200 -250 -300
-350 A HQ
CC l a Curr ent /
Potential / V (vs Ag/AgCl)
0 200 400 600 800 1000
0 50 100 150 200 250 B
C / (mol/L)
Curr
ent /
-0.2 0.0 0.2 0.4 0.6
-50 -100 -150 -200 -250 -300 CC HQ l a C Curr ent /
Potential / V (vs Ag/AgCl)
0 200 400 600 800 1000
0 50 100 150
200 D
C / (mol/L)
Curr
ent /
Figure 8. DPV of the N-RGO/GC in 0.1 mol/L phosphate solutions (pH 7.0) in the presence of 15, 30, 60, 90, 119, 148, 178, 264, 300 and 330 μmol/L for HQ and CC, respectively. (B) Calibration curve of the HQ or CC concentrations vs. the anodic peak currents. Other conditions were the same as Fig. 7.
Successive runs of DPVs of a mixture solution containing 80 μmol/L HQ and 80 μmol/L CC on the N-RGO/GC is recorded to assess the reproducibility for simultaneous detection of HQ and CC . The relative standard deviations (RSDs) of the peak currents are 3.45% and 3.82% for HQ and CC, respectively (n = 20). The RSDs results are both lower than 4%, indicating good reproducibility of the N-RGO/GC and the modified electrode is not subject to surface fouling by the oxidation product.
The repeatability of the electrode is also studied using the same electrode, where the RSDs were 2.8 % for HQ (n = 6) and 3.2 % for CC (n = 6) . The RSDs on different N-RGO modified electrodes prepared independently were 3.8 % for HQ and 4.2 % for CC (n=6), respectively. The stability of N-RGO/GC is investigated by the DPVs in 0.1 M phosphate solutions containing 80
mol/L HQ and CC. The amperometric responses were 90.5 % for HQ and 91.4 % for CC of their initial values after a storage period of a month, indicating long term stability of the modified electrode. 3.6. Real samples analysis
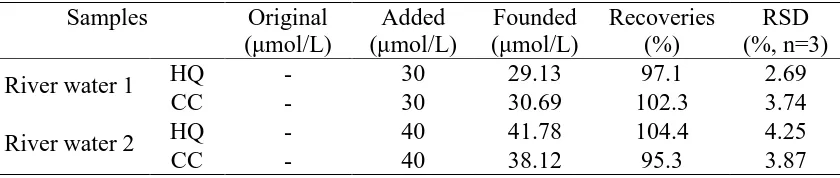
Two river samples from a river in our university were detected with the N-RGO/GC using DPV. The results were displayed in table 2. The amounts of HQ and CC in the river samples were both below the detection limits. The recoveries (n=3) for HQ and CC were 97.1-104.4% and 95.3-102.3% with the RSDs below 5%, respectively.
Table 2. Determination of HQ and CC in river water Samples Original
(μmol/L)
Added (μmol/L)
Founded (μmol/L)
Recoveries (%)
RSD (%, n=3)
River water 1 HQ - 30 29.13 97.1 2.69
CC - 30 30.69 102.3 3.74
River water 2 HQ - 40 41.78 104.4 4.25
CC - 40 38.12 95.3 3.87
0.0 0.2 0.4 0.6
-80 -120 -160 -200 -240 -280
CC
HQ k
a A
Curr
ent /
Potential / V (vs Ag/AgCl)
0 60 120 180 240 300 360
0 20 40 60 80 100
C / (mol/L)
B
Curr
ent /
CC
[image:11.596.90.510.653.742.2]
4. CONCLUSION
N-RGO was prepared by in-situ simultaneous chemical reducing GO by hydrazine hydrate and nitrogen doping by NH3H2O. Compared with GO and RGO modified electrode, the obtained
N-RGO/GC displayed high electrocatalytic activities toward the redox of HQ and CC. Two well-defined peaks and prominent improved oxidation peak currents of HQ and CC were obtained on N-RGO/GC. The metal free nitrogen doping graphene modifed electrode showed excellent sensitivity, reproducibility, and stability for simultaneous determination of HQ and CC. The method may hold great promise in electroanalytical and environmental applications because N-RGO owns the outstanding characters of facile prepared, good stability, and low cost.
ACKNOWLEDGMENTS
This work was supported by the Nation Natural Science Foundation of China (251178283), and Graduate research and innovation plan of Suzhou University of Science and Technology (SKCX15_067).
References
1. J. Zhou,X. Li,L. Yang, S. Yan, M. wang, D. Chen, Q. Chen, Y. Dong, P. Liu, W. Cai, C. Zhang, Anal. Chim. Acta., 899 (2015)57.
2. M. Zhang,F. Gan,F. Cheng, Res. Chem. Intermediat., 42(2016)813.
3. H. Yin,Q. Zhang,Y. Zhou, Q. Ma, T. Liu, L. Zhu, S. Ai, Electrochim. Acta.,56(2011)2748. 4. F. Kheiri,R. E. Sabzi,E. Jannatdoust, H.Sedghi, J. Solid State Electrochem.,15(2011)2593. 5. B. Unnikrishnan,P. Ru,S. Chen. Sensor Actuat. B- Chem., 169 (2012) 235.
6. P. J. Kerzic,W. S. Liu,M. T. Pan, H. Fu, Y. Zhou, A. R. Schnatter, R. D. Irons, Chemi. Biol. Int.,184(2010)182.
7. S. C. Moldoveanu,M. Kiser, J. Chromatogra. A,1141(2007)90. 8. E. Bakker. Anal. Chem.,76(2004)3285.
9. F. Xiao,L. Wang,H. Duan. Biol. Adv.,34(2016)234.
10.M. Li,F. Ni,Y. Wang, S. Xu, D. Zhang, S. Chen, L. Wang, Electroanal.,21 (2009) 1521. 11.L. A. Goulart,L. H. Mascaro. Electrochim. Acta.,196 (2016) 48.
12.H. Du,J. Ye,J. Zhang, X. Huang, C. Yu, J. Electroanal. Chem.,650(2011)209. 13.B. T. P. Quynh,J. Y. Byun,S. H. Kim, Sensor Actuat. B- Chem., 221 (2015) 191.
14.C. V. Fernando, G. Lívia L C, F. Luiz C S, J. Bruno C, F. Orlando, Enzyme Microb.Tech.,84 (2016) 17.
15.K. Liang,X. Fu,L. Wu, Y. Qin, Y. Song, Int. J. Electrochem. Sci.,11 (2016) 250. 16.G. Xu,B. Tang,S. Jing, J. Tao, Int. J. Electrochem. Sci.,10 (2015) 10659.
17.M. M. Foroughi,M. Noroozifar,M. Khorasani-Motlagh. J Iran. Chem. Soc.,12(2015)1139. 18.D. Yuan,S. Chen,F. Hu, C. Wang, R. Yuan, Sensor Actuat. B- Chem., 168 (2012) 193.
19.Y. Wang,J. Qu,S. Li, Y.Dong, J. Qu, Microchim. Acta.,182(2015)2277.
20.H. Zhang,Y. Huang,S. Hu, Q. Huang, C. Wei, W. Zhang, W. Yang, P. Dong, A. Hao, Electrochim. Acta.,176 (2015) 28.
21.Z. Meng,H. Zhang,J. Zheng, Res. Chem. Intermedi.,41(2015)3135.
22.Y. Zhou,L. Tang,G. Zeng, J. Chen, Y. Cai, Y. Zhang, G. Yang, Y. Liu, C. Zhang, W. Tang, Biosens. Bioelectron.,61 (2014) 519.
24.Z. Hong,L. Zhou,J. Li, J. Tang, Electrochim. Acta.,109 (2013) 671. 25.J. Tang,B. Jin, Anal. Methods,7(2015)9218.
26.X. Wang,M. Wu,H. Li, Q. Wang, P. He, Y. Fang, Sensor Actuat. B- Chem.,192 (2014) 452. 27.L. Zheng,L. Xiong,Y. Li, J. Xu, X. Kang, Z. Zou, S. Yang, J. Xia, Sensor Actuat. B- Chem., 177
(2013) 344.
28.Y. Li,S. Feng,Y. Zhong, Y. Li, S. Li, Electroanal.,27(2015)2221.
29.S. Erogul,S. Z. Bas,M. Ozmen, S. Yildiz, Electrochim. Acta.,186 (2015) 302.
30.R. Chen,Q. Wang,Y. Li, Y. Gu, L. Tang, C. Li, Z. Zhang, Rsc Adv.,5(2015)44165. 31.X. Ma,Z. Liu,C. Qiu, T. Chen, H. Ma, Microchim. Acta.,180(2013)461.
32.W. Sun,Y. Wang,Y. Lu, A. Hu, F. Shi, Z. Sun, Sensor Actuat. B- Chem., 188 (2013) 564. 33.W. Zhang,J. Zheng,Z. Lin, L. Zhong, J. Shi, C. Wei, H. Zhang, A. Hao, S. Hu, Anal. Methods,
7(2015)6089.
34.H. Zhang,X. Bo,L. Guo, Sensor Actuat. B- Chem., 220 (2015) 919. 35.B. Zheng,J. Wang,F. Wang, X. Xia, J. Mater. Chem. A,2(2014)9079. 36.Y. Zhang,Q. Wang,J. Li, X. Wang, K. Liu, RSC Adv.,5 (2015) 9057.
37.X. Wang,M. Xi,M. Guo, F. Sheng, G. Xiao, S. Wu, S. Uchiyama, H. Matsuura, Analyst,141(2016)1077.
38.W. S. Hummers,R. E. Offeman, J. Am. Chem. Soc.,80(1958)1339. 39.Y. Xu,H. Bai,G. Lu, C. Li, G. Shi, J. Am. Chem. Soc.,130(2008)5856. 40.W. Yue,Z. Lin,S. Jiang, X. Yang, J. Mater. Chem.,22 (2012) 16318.
41.K. H. Liao,A. Mittal,S. Bose, C. Leighton, K. A. Mkhoyan, ACS Nano,5(2011)1253. 42.T. T. Dang,V. H. Pham,K. V. Bao, S. H. Hur, E. W. Shin, Mater. Lett.,86(2012)161. 43.Y. Lu,Y. Jiang, H. Wu, W. Chen, J. Phys. Chem. C,117(2013)2926.
44.M. Feng,H. Feng, J. Nanosci. Nanotechno.,13(2013)937.