High Performance
Garbage Collectors
Robin Garner
May 2012
A thesis submitted for the degree of
Doctor of Philosophy at
Garbage collection is a performance-critical component of modern language imple-mentations. The performance of a garbage collector depends in part on major al-gorithmic decisions, but also significantly on implementation details and techniques which are often incidental in the literature.
In this dissertation I look in detail at the performance characteristics of garbage collection on modern architectures. My thesis is that a thorough understanding of the characteristics of the heap to be collected, coupled with measured performance of various design alternatives on a range of modern architectures provides insights that can be used to improve the performance of any garbage collection algorithm.
The key contributions of this work are: 1) A new analysis technique (replay collec-tion) for measuring the performance of garbage collection algorithms; 2) a novel tech-nique for applying software prefetch to non-moving garbage collectors that achieves significant performance gains; and 3) a comprehensive analysis of object scanning techniques, cataloguing and comparing the performance of the known methods, and leading to a new technique that optimizes performance without significant cost to the runtime environment.
These contributions are applicable to a wide range of garbage collectors, and can provide significant measurable speedups to a design point where each implementer in the past has had to trust intuition or their own benchmarking. The methodologies and implementation techniques contributed in this dissertation have the potential to make a significant improvement to the performance of every garbage collector.
Abstract v
1 Introduction 1
1.1 Problem Statement . . . 1
1.2 Scope and Contributions . . . 3
1.2.1 Workload Evaluation . . . 3
1.2.2 Software Prefetch for Garbage Collection . . . 3
1.2.3 Object Scanning Techniques . . . 3
1.3 Thesis Outline . . . 4
2 Background 5 2.1 Garbage Collection . . . 5
2.1.1 Terminology . . . 7
2.1.2 Memory allocation . . . 8
2.1.2.1 Free-list allocators . . . 8
2.1.2.2 Monotonic allocators . . . 9
2.1.2.3 Multi-threaded allocators . . . 9
2.1.3 Canonical garbage collection algorithms . . . 10
2.1.3.1 Mark-sweep . . . 10
2.1.3.2 Reference counting . . . 11
2.1.3.3 Evacuating . . . 12
2.1.3.4 Compacting . . . 13
2.1.3.5 Mark-region . . . 14
2.1.3.6 Generational . . . 14
2.1.4 Object Scanning . . . 15
2.2 Infrastructure . . . 16
2.2.1 Jikes RVM . . . 16
2.2.1.1 Low-level Programming . . . 17
2.2.1.2 Replay Compilation . . . 17
2.2.2 MMTk . . . 18
2.2.2.1 The MMTk Free-list Allocator . . . 18
2.2.2.2 Credibility of MMTk As An Experimental Platform . . . 19
2.3 Evaluation Methodology . . . 19
2.3.1 Benchmarks . . . 20
2.3.1.1 The SPEC Benchmarks . . . 20
2.3.1.2 The DaCapo Benchmarks . . . 21
2.3.2 Evaluation Methodology . . . 21
2.4 Summary . . . 22
3 Garbage Collector Performance 23 3.1 Introduction . . . 23
3.2 The Replay Tracing Framework . . . 24
3.3 Results . . . 25
3.3.1 The Composition of the Tracing Loop . . . 25
3.3.1.1 Replay Scenarios . . . 25
3.3.1.2 Tracing Costs . . . 28
Framework Overhead . . . 28
Experiments . . . 28
3.3.1.3 Results . . . 29
3.3.2 Mark State Implementations . . . 31
3.3.3 Heap Traversal Order . . . 33
3.3.3.1 Experiments . . . 33
3.3.3.2 Results . . . 35
Depth-first versus breadth-first . . . 35
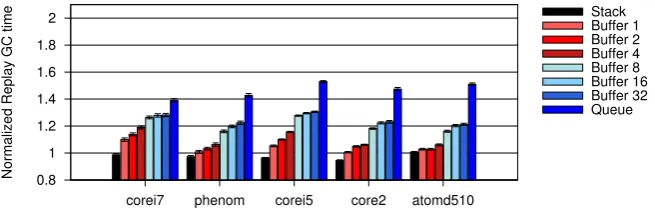
FIFO buffer . . . 36
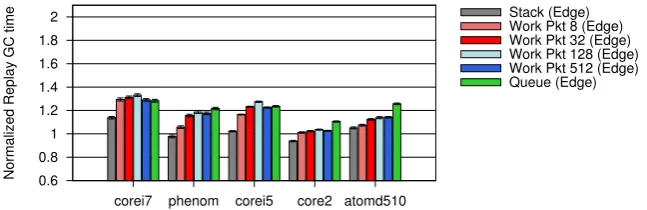
Work Packet . . . 36
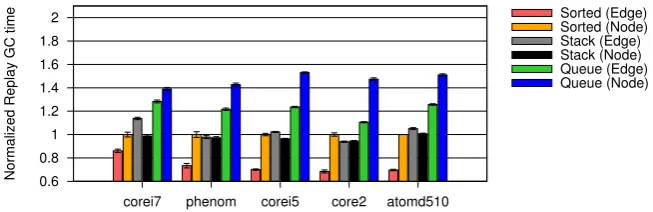
Scan Direction . . . 36
Edge Enqueuing . . . 37
3.3.3.3 Conclusion . . . 39
3.4 Summary . . . 39
4 Effective Software Prefetch 41 4.1 Introduction . . . 41
4.2 Related work . . . 42
4.3 Key Mark-Sweep Design Choices . . . 44
4.3.1 Allocation . . . 44
4.3.2 Mark state . . . 44
4.3.3 Sweep . . . 44
4.3.3.1 Block marks . . . 45
4.3.3.2 Cyclic mark state . . . 45
4.3.4 Work queue . . . 46
4.4 Software Prefetching . . . 46
4.4.1 Prefetching For GC Tracing . . . 47
4.5 Edge Order Traversal . . . 47
4.6 Performance Results . . . 48
4.7 Robustness: Experiences With Other Code Bases . . . 52
4.8 Summary . . . 52
5 Object Scanning 53 5.1 Introduction . . . 54
5.3 Analysis of Scanning Patterns . . . 56
5.3.1 Analysis Methodology . . . 57
5.3.2 Encoding and Counting Patterns . . . 57
5.3.3 Benchmarks . . . 60
5.3.4 Reference Pattern Distributions . . . 60
5.3.5 Reference Field Count Distributions . . . 63
5.4 Design Alternatives . . . 63
5.4.1 The Jikes RVM Scanning Mechanism . . . 63
5.4.2 Inlining Common Cases . . . 64
5.4.3 Compiled vs. Interpreted Evaluation . . . 65
5.4.4 Encoding and Packing of Metadata . . . 65
5.4.5 Indirection to Metadata . . . 66
5.4.6 Object Layout Optimizations . . . 66
5.5 Methodology . . . 67
5.5.1 Hardware Platforms . . . 68
5.5.2 Configurations . . . 68
5.6 Results . . . 69
5.6.1 Inlining Common Cases . . . 70
5.6.2 Compiled vs. Interpreted Evaluation . . . 70
5.6.3 Encoding and Packing of Metadata . . . 71
5.6.4 Indirection to Metadata . . . 71
5.6.5 Object Layout Optimizations . . . 72
5.6.6 Conclusion . . . 72
5.7 Summary . . . 75
6 Conclusion 79 6.1 Future Work . . . 79
6.1.1 Prefetch . . . 80
6.1.2 Scanning . . . 80
1.1 Architectural dependence on GC performance . . . 2
2.1 Mark-Sweep Garbage Collection . . . 11
3.1 The Standard Tracing Loop . . . 26
3.2 Replay Scenarios . . . 27
3.3 Replay Scenario for Evaluating Mark-state Implementations . . . 32
3.4 TheEdge-EnqueuingTracing Loop . . . 35
3.5 Effects of traversal order: major design choices . . . 36
3.6 Effects of a FIFO buffer . . . 36
3.7 Effects of partial breadth-first (work packet) traversal order . . . 37
3.8 Reversing the order of scanning of fields . . . 37
3.9 Edge enqueuing. . . 37
3.10 Edge enqueuing with a FIFO buffer . . . 38
3.11 Edge enqueuing. Effects of partial breadth-first order . . . 38
4.1 The FIFO-Buffered Prefetch Queue [Cher et al., 2004]. . . 43
4.2 Comparing the Standard and Edge Enqueuing Tracing Loops . . . 48
4.3 Normalized GC time vs. prefetch distance . . . 49
4.4 Normalized total time vs. prefetch distance . . . 50
4.5 Relative total execution time as a function of heap size . . . 51
5.1 Cumulative frequency distribution curves forreference layout patterns . . 59
5.2 Cumulative frequency distribution curves for referencefield counts . . . 62
5.3 Objects and Per-Class Metadata Structure in Jikes RVM. . . 64
5.4 The default scanning loop in Jikes RVM. . . 64
5.5 Unoptimized and optimized versions of scanning code. . . 65
5.6 Inlining common cases . . . 70
5.7 Specialization . . . 70
5.8 Header encodings . . . 71
5.9 Levels of indirection . . . 72
5.10 Object layout optimizations . . . 73
5.11 Six well-performing designs . . . 74
5.12 Six well-performing designs—per-benchmark, Core i5 and Core 2 pro-cessors . . . 76
5.13 Six well-performing designs—per-benchmark, Phenom and Atom pro-cessors . . . 77
2.1 Comparative GC performance, MMTk (Jikes RVM) vs. Boehm (GCJ).
GC Throughput in MB/s . . . 19
3.1 Tracing loop time as a percentage of total GC time. . . 24
3.2 Hardware Platforms used for the Replay Tracing Loop Costs Experiments 28 3.3 Elapsed Time for Various Scenarios for Two Design Points, Normalized to the Synchronized Mark Scenario. . . 29
3.4 Costs for Two Designs, Showing Time, Retired Instructions, L1 & L2 Misses, Normalized to Each Mark Scenario. . . 30
3.5 Elapsed Time for Various Scenarios for Four Design Points, Normalized to the Synchronized Mark Scenario. . . 32
3.6 Cost of The Mark Mechanism Alone for Four Design Points, Each Nor-malized to Cost of Entire Mark Scenario. . . 33
3.7 Hardware platforms used for heap traversal order experiments. . . 35
4.1 Hardware Platforms for prefetch experiments . . . 49
5.1 Detailedreference layout patterndistributions for ‘references first’ object layout . . . 58
5.2 Detailed referencefield countdistributions . . . 61
5.3 Hardware platforms for scanning experiments. . . 68
5.4 Object scanning configurations evaluated . . . 68
5.5 Header encoding: Percentage of objects covered by the schemes evalu-ated. . . 69
Introduction
This thesis addresses the problem of designing high performance implementations of garbage collection algorithms on modern hardware.
1.1
Problem Statement
Garbage collection is an increasingly important feature of modern programming lan-guages. Since its inception in LISP [McCarthy, 1960], there has been a huge volume of research into garbage collection. Most of this research has focused on the algorithm used, rather than the details of its implementation.
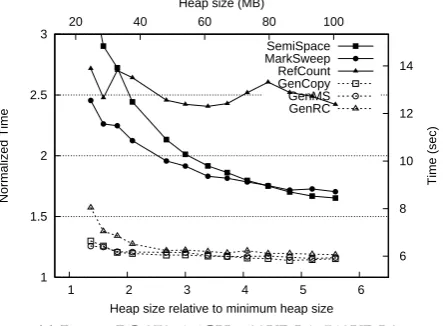
The performance characteristics of garbage collectors depend strongly on proces-sor architecture, particularly on the speed ratio between Register/ALU operations and memory operations at the various levels of cache. For example, see Figure 1.1, re-produced from Blackburn et al. [2004a], which shows the performance of six garbage collectors on three architectures across a range of heap sizes. The data point of in-terest is the point where the curves for MS (Mark-Sweep) and SS (Semi-Space) inter-sect. Mark-sweep is a high throughput collector with poor mutator locality, while semi-space is a low throughput collector with excellent mutator locality. In a large heap, the garbage collector runs less frequently, and mutator performance dominates overall performance. As the heap size decreases the garbage collector performance comes to dominate. On architectures where locality is more important, the crossover point will occur at a smaller heap size, and the semi-space collector will outperform mark-sweep over a larger range of heap sizes. On an architecture where locality was unimportant (e.g. on historical machines with a flat memory hierarchy) mark-sweep would perform better than semi-space across all heap sizes. This architectural depen-dence means that the measurement and analysis that informs garbage collector design decisions is as important as overall performance, if not more so—because while a par-ticular design may be superseded by advances in technology, the analysis techniques that led to the design are likely to still be relevant.
Another important factor in garbage collector performance is the workload, i.e. the composition of the heap in its target applications. For research in the field, this effec-tively means the benchmarks used to evaluate the work. Garbage collector implemen-tations that look carefully at the heap composition can be more effectively optimized
1 1.5 2 2.5 3
1 2 3 4 5 6
6 8 10 12 14
20 40 60 80 100
Normalized Time
Time (sec)
Heap size relative to minimum heap size Heap size (MB)
SemiSpace MarkSweep RefCount GenCopy GenMS GenRC
(a)Pentium 4, 2.6GHz, 8KB L1, 256KB L2
1 1.5 2 2.5 3
1 2 3 4 5 6
6 8 10 12 14
20 40 60 80 100
Normalized Time
Time (sec)
Heap size relative to minimum heap size Heap size (MB)
SemiSpace MarkSweep RefCount GenCopy GenMS GenRC
(b)AMD Athlon 2600+, 1.9GHz, 64KB L1, 512KB L2
1 1.5 2 2.5 3
1 2 3 4 5 6
6 8 10 12 14
20 40 60 80 100
Normalized Time
Time (sec)
Heap size relative to minimum heap size Heap size (MB)
SemiSpace MarkSweep RefCount GenCopy GenMS GenRC
[image:16.595.168.390.519.682.2](c)Power PC 970, 1.6GHz, 32KB L1, 512KB L2
to make the frequent case fast, and achieve speedups that would not otherwise be possible.
1.2
Scope and Contributions
The aim of my research has been to identify ways in which the performance of garbage collection can be improved, and to measure and quantify the improvement. To do this, I have used the Jikes RVM Java virtual machine, because this is a high-performance, freely available implementation of one of the most relevant modern programming languages. While the specific quantitative results may change, the methodologies and results should be applicable to other Java implementations, and to other programming languages.
1.2.1 Workload Evaluation
One of my key contentions is that the design of high performance garbage collectors must be driven by a thorough empirical understanding of the workload and the per-formance of the system being implemented. During the course of my PhD I have been deeply engaged in the development of the DaCapo benchmark suite [Blackburn et al., 2006, 2008].
This dissertation introduces the technique ofreplay collectionas a methodology for evaluating the performance of a garbage collector. This technique is used to exam-ine several aspects of the performance of a collector, and results from this evaluation inform the implementation techniques presented in later chapters.
1.2.2 Software Prefetch for Garbage Collection
Several authors have applied software prefetch to garbage collection, and have achiev-ed modest speachiev-edups at best. We show how a little-usachiev-ed algorithm for heap traversal, coupled with buffered prefetch and a new object metadata implementation combine to yield significant, consistent speedups on a large class of garbage collectors on a wide range of benchmarks and hardware platforms.
1.2.3 Object Scanning Techniques
1.3
Thesis Outline
The body of this thesis is structured around the three contributions outlined above. Chapter 2 provides an overview of garbage collection with particular focus on the techniques discussed in this thesis. It also provides background on the benchmarks used for memory management research, and particularly the DaCapo benchmarks project. Further, this chapter describes Jikes RVM and MMTk, and outlines briefly the evaluation techniques used in this research.
Chapters 3–5 comprise the main body of the thesis. They cover the three major research contributions outlined in Section 1.2.
Background
It will take more time: If you touch it, it will break... Software is wily.
Rose [2008]
This chapter provides the background material necessary to place the research contributions in context, and to describe the specific research infrastructure used in the remainder of the thesis.
Section 2.1 begins with a brief introduction to the field of garbage collection, with emphasis on the specific techniques that form the basis of this thesis. Section 2.2 de-scribes Jikes RVM, the research Java virtual machine in which this work was imple-mented, and MMTk, the memory manager used in Jikes RVM. Section 2.3 describes the benchmarks and experimental methodology used to evaluate the designs pre-sented in later chapters.
2.1
Garbage Collection
Automatic memory management, or garbage collection, has been a feature of many programming languages since early versions of LISP [McCarthy, 1960], and is now in widespread use due to the popularity of languages such as Java, C#, Python and Perl. This section provides a brief overview of garbage collection terminology, algorithms, and mechanisms. For a more complete discussion of the fundamentals of garbage collection see Jones and Lins [1996]; Jones et al. [2011]; Wilson [1992].
The purpose of garbage collection is to reclaim memory that is no longer needed by the program, and to recycle it for later use. Garbage collection algorithms can be classified in terms of several attributes, including:
• How they identify live data, either by tracing (following pointers from a fixed root set) or using reference counts.
• Whether they run concurrently with the program, or as ‘stop the world’ collec-tors that stop program execution to perform collection.
• Whether they move objects in the heap (copying collectors), or not.
• Whether they require accurate type information from the compiler (precise col-lectors) or can run with limited or no information (conservative and ambiguous roots collectors).
• Whether at every invocation they collect the whole heap, part of the heap (as in generational collectors) or spread the work evenly throughout program execu-tion time (incremental collectors).
The time complexity of garbage collection algorithms is almost always linear in some aspect of program behaviour or heap size, and efficiency is gained by decreasing the constant factors in the complexity equation. Some collectors require intervention when values are stored or read from pointer fields, and have overhead proportional to the pointer mutation rate.
There are some drawbacks to automatic memory management. Manual memory management potentially uses less memory, since objects can be freed as soon as they are no longer used, rather than waiting until many objects are ready to be reclaimed, as most garbage collectors do. In practice automatic memory management introduces a space-time tradeoff, where a larger heap allows for less frequent garbage collection and consequently better performance. Manual memory management is, however, not without its own space overheads. In a complex system it can often be very difficult to determine when an object is no longer in use.
One system for manual memory management that helps the programmer track objects that are in use is talloc[Tridgell, 2004], which solves the problem by adding an additional 32-byte header (60 bytes in a 64-bit system) to objects, over and above the header used by the underlying ‘malloc’ allocator, and reclaims unused objects in a tree structure. Allocating memory in talloc requires specifying a parent talloc
context, and when a talloc object is freed, all the objects allocated within its context are
also freed. Using talloc correctly requires that all functions that allocate memory be replaced with their talloc equivalents, and that code that allocates memory that lives beyond its enclosing context needs to export it to the external context. In exchange for this additional complexity, talloc provides considerable debugging assistance in tracking down memory leaks and use-after-free errors.
Hertz and Berger [2005] explore the tradeoff between automatic and manual mem-ory management in an artificial setting, using a memmem-ory trace from a previous run of the benchmark to determine when objects become unreachable and inserting explicit calls to free objects at the moment they become unreachable. This analysis, while interesting in itself, ignores the enormous programming effort and overhead (as in talloc above) required to track the ownership of objects and determine when they are no longer used. The most frequently cited study is Rovner [1985], who found that Mesa programmers spent 40% of their time implementing memory management pro-cedures and finding errors related to explicit storage management.
a programmer to provide code that the system undertakes to execute after an object is found to be unreachable but before it is reclaimed. In an explicit memory manage-ment system, finalizers are executed at the momanage-ment the programmer frees the object, while in a garbage collected system this only occurs sometime after the last reference to the object is removed. In some memory managers the finalizer may only be called when the program exits, since memory is generally only freed in response to resource exhaustion. In my opinion this claimed drawback is rather specious, since while the finalization feature (and its slightly more usable weak reference feature) have limita-tions, there is nothing stopping the programmer from executing finalization code at the point they determine that the object is about to become unreachable. The advan-tage that garbage collection supported finalization adds is that a finalizer will even-tually be run, even when an object becomes unreachable without the programmer noticing and arranging for manual finalization.
As with finalization, another potential drawback of garbage collection is that it can provide the programmer with a false sense of security, leaving them the illusion that memory management is purely a runtime-system issue. In practice, garbage collected systems can have memory leaks if the programmer maintains references to memory that is no longer in use. This can sometimes be subtle, such as when the compiler’s liveness analysis is less than perfect—a variable that is no longer in scope may main-tain a pointer to a large data structure. These memory leaks are easily fixed by ex-plicitly breaking the link to the data structure at the point the programmer no longer needs it, and the garbage collector still frees the programmer from leaks due to gen-uinely unreachable memory.
2.1.1 Terminology
The area of memory used to allocate dynamic data structures is known as theheap, and blocks of memory allocated on the heap are generally referred to asobjects, whether the language is object-oriented or not. The process of reclaiming unused memory is known as garbage collection, a term coined by McCarthy [1960]. Following Dijkstra et al. [1976], from the point of view of the garbage collector, the termmutatorrefers to the application, being the part of the system that mutates the heap. Most garbage collection algorithms interrupt the execution of the mutator for varying amounts of time, and the termpause timeis used to refer to the length of time that the garbage col-lector interrupts the main program. Colcol-lectors that must stop the mutator to perform collection work are known asstop the worldcollectors, as compared toconcurrentor
on-the-flycollectors. Of particular interest to real-time systems is themaximum pause time,
because when this can be reduced (or preferably bounded) the system will be more responsive. The termGC timeis used to denote the time when the garbage collector is running.
A garbage collector that always checks the liveness of all objects in the heap is known as afull heapcollector, as compared to agenerationalorincrementalcollector.
write barrier, which is invoked whenever the mutator writes to a field in an object in the heap. Less commonly used areread barriers, invoked on a read of a field, andstack
barriersinvoked on return from a method call. Barriers are typically only required on
reference fields, although some collectors require barriers on non-reference fields.
2.1.2 Memory allocation
Memory allocation is in itself an extensive field, and the standard reference is the sur-vey paper by Wilson et al. [1995]. The key issues for memory allocation are locality, speed of allocation and de-allocation, and avoidance offragmentation. In an ideal sys-tem with unbounded memory resources, allocation could be done by incrementing a single pointer that indicates the highest address currently in use. This idea is referred to asmonotonicorbump pointerallocation, and is of practical use in several situations.
When discussing memory allocation, one of the key efficiency issues is
fragmen-tation, which refers to memory wasted by the allocator. There are two types of
frag-mentation: internal fragmentationoccurs when the allocator returns a larger region of memory than the user requested, resulting in part of the allocated cell being unused;
external fragmentationoccurs when free memory is available in the spaces between
al-located regions, but which is too small to satisfy an allocation request.
2.1.2.1 Free-list allocators
In systems where all memory cells are the same size (such as LISP), a bitmap can be used to indicate which cell of memory is free. Object allocation in this style of allocator searches the bitmap for the first free bit, then returns the address of the corresponding block. The most widely used allocation strategy in explicitly managed heaps is the free-list allocator, which chains together free blocks of memory into a list. The design space for free-list allocators is large, and involves complex trade-offs between space and time efficiency.
At one end of the design spectrum for free-list allocators is an exact first fit algo-rithm. Initially the allocator assigns the entire heap to a single large contiguous block, and satisfies allocation requests by returning an initial segment of the unused mem-ory. As the program returns objects to the memory manager, it chains them on a list, in ascending order of size. When the allocator processes a new request, it scans the free list, and returns the first block that is the same or greater size than the request. If the block found is larger than the request, the allocator splits the block, and returns the unused portion to the free list. This algorithm suffers badly from external fragmen-tation [Robson, 1975], and coalescing of small unused chunks into larger fragments, while expensive to implement, is necessary to make this practical.
buddy system[Knowlton, 1965], a power of 2 segregated fits allocator with extremely fast performance, but which has a worst case internal fragmentation penalty of 50% of available memory. The Kingsley allocator was the default implementation ofmalloc
in BSD Unix 4.2.
The best known free-list allocators, such as the Lea allocator used by GNU libc [Lea, 1998], use a combination of strategies for different size objects. For small objects, which are most frequent, Lea uses segregated free-lists at 8-byte increments. For medium sized objects (64–128K bytes), a single free-list with approximate best-fit is used, while for objects larger than 128KB, Lea uses the underlying operating sys-tems virtual memory allocation functions.
One disadvantage of free-list allocators is that objects allocated contemporane-ously are not guaranteed to be collocated in memory. That is, temporal locality does not lead to spatial locality. Objects allocated close in time are frequently accessed to-gether during execution, so free-list allocators lead to poor cache hit rates, and hence poor mutator performance compared to monotonic allocators [Blackburn et al., 2004a].
2.1.2.2 Monotonic allocators
Much faster than a free-list allocator is amonotonic orbump-pointer allocator. The al-locator acquires a region of unused memory, maintains a single pointer to the lowest free address in the region, and after allocating an object, increments (‘bumps’) it by the size of the object just allocated. When memory is exhausted, a garbage collection
mechanism (such as the semi-space collector described below in Section 2.1.3.3) is in-voked, which frees a large contiguous region or regions so that allocation can resume. In a practical collector, the bump-pointer will allocate regions at some chunk size, e.g. 32KB in MMTk. A larger chunk size minimizes chunk allocation overhead and multi-threading overhead, while a smaller chunk size minimizes wasted space, especially important in multi-threaded allocators. Bump-pointer allocation is significantly faster than free-list allocation, and has better mutator performance [Blackburn et al., 2004a].
2.1.2.3 Multi-threaded allocators
Multi-threaded allocators raise several issues not relevant to single-threaded alloca-tors [e.g. Alpern et al., 2000; Berger et al., 2000; Garthwaite and White, 1998]. First, sharing a single free-list pointer or bump-pointer in a multi-threaded system incurs significant synchronization overhead. Second, in the majority of applications, most objects allocated by a thread are used only by that thread, so interleaving objects allo-cated by different threads can lead to false sharing of cache lines and consequent poor performance even when no objects are shared between threads.
greatly reduced provided that the thread-local chunks are sufficiently large, although there is an evident space/time trade-off.
2.1.3 Canonical garbage collection algorithms
This section describes the basic algorithms used to construct garbage collectors. Dijkstra et al. [1976] introduced the tri-colour abstraction, which is useful in dis-cussing and comparing garbage collection algorithms. The abstraction defines objects in the heap to be one of three colours, traditionally white, grey and black. A classic full-heap stop-the-world collector begins with all objects coloured white. The collec-tor iterates through theroot set, i.e. the set of references into the collected heap—static program variables, stack-allocated local variables and registers, colouring all refer-enced objects grey. The collector then iterates, choosing an object in the grey set and colouring all of its white referents grey, then colouring the chosen object black. The process terminates when the grey set is empty. This forms the transitive closure of the root set over the heap, identifying all objects which are reachable from variables in the program. At this point, any object still coloured white is unreachable and can be reclaimed. Collectors differ largely in how these sets are represented, and what happens when an object is moved from one set to another.
We use the termtracingto refer to this transitive closure process. Atracing collector
is one that determines liveness purely via a transitive closure process, as opposed to a reference counting collector (see Section 2.1.3.2 below).
2.1.3.1 Mark-sweep
The first garbage collection algorithm was created as part of the LISP system [Mc-Carthy, 1960], and is today known as mark-sweep. The mark-sweep algorithm asso-ciates a single bit flag called themark bitwith each object, initially set to zero, corre-sponding to white in the tricolour abstraction. The initial scan of the root set proceeds by setting the referenced object’s mark bit to one and adding it to the work list. The grey objects in the abstraction correspond to the contents of the work list. During the closure phase (known in a mark-sweep collector as themark phase), the collector iter-ates until the work list becomes empty. In each iteration an object is removed from the work list and the mark bits of each of the objects it refers to are checked. If the mark bit is unset, the collector sets it and adds it to the work list. The black set in the abstraction consists of those objects that have been marked, and processed by the collector loop.
Once the mark phase is complete, the collector scans the heap sequentially, placing every object whose mark bit is zero (the final white set) on a list of free memory cells, and resetting the mark bit of every marked object to zero in preparation for the next collection phase. When this sweep phaseis complete, control returns to the program and execution resumes.
1 // Mark phase
2 for (object in root-set)
3 markBit(object).set()
4 work.add(object)
5
6 while (!work.isEmpty())
7 obj = work.remove()
8 for (child in referents(obj))
9 if (markBit(child).testAndSet())
10 work.add(child)
11
12 // Sweep phase
13 for (object in allObjects)
14 if (markBit(object).isSet())
15 markBit(object).clear()
16 else
17 free-list.add(object)
Figure 2.1:Mark-Sweep Garbage Collection
as to whether the mark bit is kept in the object header, or separately in a side array. Mark-sweep as described above is relatively inefficient, taking time proportional to the size of the whole heap regardless of the amount of live data. It also suffers from a large pause time, although there are concurrent mark sweep algorithms that reduce this. Na¨ıve mark-sweep collection requires a free-list memory organisation, and there-fore incurs a higher allocation cost and worse locality than garbage collection schemes that use monotonic allocation.
Hughes [1982] introduced the concept of lazy sweeping. Rather than sweep the entire heap during the garbage collection, the mutator sweeps the heap incrementally, generally ablockat a time, where the definition of a block varies by implementation. While this does not decrease the total cost of sweeping, it does significantly reduce pause times. Boehm [2000] notes that lazy sweeping has a locality advantage, since the sweep operation loads memory into cache that the allocator is just about to use. When the cost of sweeping is delegated to the mutator, mark-sweep is the fastest full-heap garbage collection mechanism available. This advantage is offset by slow downs in the mutator. Since it requires a free-list allocator, mark-sweep suffers from poor allocation performance and poor mutator locality, and the mutator is further slowed down by the cost of lazy sweeping. We discuss performance aspects of lazy sweeping implementations in detail in Chapter 4.
2.1.3.2 Reference counting
drops to zero, the object is no longer required, and can be reclaimed. When an object is freed, objects that it refers to also have their reference counts decremented transi-tively. Implementing reference counting requires a write barrier to be inserted before code that manipulates pointers, so that the counts can be adjusted and freed memory reclaimed.
The main advantage of reference counting is that there is no delay between mem-ory becoming free, and it being available for re-use. Applications using reference counting can operate efficiently in heaps only slightly larger than the peak size that the application requires. The pause times of reference counting collectors are also proportional to the size of data structures that are freed, which are typically much smaller than the whole heap. Lazy reference counting [Weizenbaum, 1963; Ritzau, 2003] eliminate these pauses by reclaiming freed data structures one object at a time in the mutator, but at considerable cost in space [Boehm, 2004].
One disadvantage of reference counting is that pointer mutations are frequent and the write barrier is expensive, especially in multi-threaded systems where syn-chronization on the reference count field is required. Thus straightforward reference counting implementations are generally among the slowest of memory management schemes. Deferred reference counting [Deutsch and Bobrow, 1976] can significantly reduce the overhead of standard reference counting. Collection is performed in dis-tinct passes (as in other collection algorithms), and mutations to certain frequently changed roots (such as registers, the stack etc.) are only counted during a collection cycle. Coalescing [Levanoni and Petrank, 2001] reduces the reference counting over-head of frequently mutated fields by recording only the initial and final state of pointer fields mutated between two garbage collection phases. Ulterior Reference Count-ing [Blackburn and McKinley, 2003] uses reference countCount-ing for the mature space of a generational collector, observing that pointer mutations of mature objects are much less frequent than younger objects, achieving a collector that combines the throughput of a generational collector with the low pause times of a reference counting collector.
The most significant disadvantage of reference counting is that it cannot in itself collect cyclic data structures, and alternative approaches such astrial deletion [Christo-pher, 1984; Mart´ınez et al., 1990; Lins, 1992; Bacon and Rajan, 2001; Bacon et al., 2001] or mark-sweep collection (backup tracing [Deutsch and Bobrow, 1976]) must be em-ployed. Trial deletion involves identifying candidate objects for the roots of cycles, tentatively setting their reference count to zero, and seeing whether this would cause the object to be collected. The cost of trial deletion can have a significant effect on program run time [Quinane, 2003; Frampton, 2010], while using backup tracing to some extent obviates the need for reference counting at all. Frampton et al. [2008] and Frampton [2010] show how concurrent backup tracing can exploit the reference counting barriers to reduce overheads.
2.1.3.3 Evacuating
Cheney’s algorithm [Cheney, 1970]. Evacuating collection combines the advantage of low mutator overhead due to bump-pointer allocation with a collector whose cost is proportional to the amount of live data in the heap. Since most heap objects are short lived, this can be considerably more efficient than na¨ıve mark-sweep collectors whose performance is proportional to the total size of the heap.
The original copying collector is known today assemi-space, because it divides the available heap space into two equal sized regions. Using a bump-pointer allocator, objects are created in one half of memory, known as to-space. When all memory in space is consumed, the unused half of memory is renamed space, and the old to-space becomesfrom-space. Starting with the set of root pointers, from-space is traced as in a mark-sweep collector, but instead of simply being marked, each live object is copied to to-space. A bit is set in the old object (to mark it as having been copied), and a forwarding pointer is written to it to indicate where the live copy of the object is in to-space. When pointers are traced from live objects, either an object is still in from-space—in which case the collector copies it and updates the pointer to point to its new location, or it has already been copied—in which case the forwarding pointer is used to update the pointer being traced.
Cheney’s algorithm uses the set of already-copied objects as a work queue to eliminate the need for an explicit work queue data structure, thus making copying a practical technique in LISP by bounding the space overhead required. In modern object-oriented and functional languages—where the average object size is signifi-cantly larger than a pointer—it is more common to use a separate data structure (e.g. a stack) for the work queue.
The attraction of copying collectors is that in typical programs few allocated ob-jects survive to be collected, and hence the overhead of copying obob-jects is small com-pared to the size of the heap. Copying collectors also permit the use of a bump-pointer allocation scheme which provides good allocation performance. The principal advan-tage of copying collectors, though, is that they compact the heap, improving locality for the mutator.
One disadvantage of pure copying collectors is that time is often wasted copy-ing long-lived data structures from one semi-space to the other and back. A second disadvantage is that in order to allow for a worst-case collection where almost 100% of objects survive, it requires a 100% space overhead. Copying is generally used in modern generational collectors, where the ability to collect subsets of the heap inde-pendently allows copying to be targeted at object populations with low survival rates, where it performs best.
2.1.3.4 Compacting
lo-cation of each object, and writes a forwarding pointer to each object. In the third, or
forwardingpass, the collector updates all pointers to reflect the addresses calculated
in the second pass. In the fourth and final phase, the collector copies objects to their new locations. Copying is done in strict address order to ensure that no live data is overwritten.
While optimized versions of compacting collectors exist, they are still generally more expensive than the alternatives, and are rarely used as the primary collector in a high-performance system. More commonly, compacting is either used as a backup strategy for when space becomes tight [e.g. Sansom, 1991], or alongside a mark-sweep or mark-region collector to compact memory when fragmentation is detected. They do, however, have the advantage of excellent mutator locality because they preserve allocation order, and have very low space overheads.
2.1.3.5 Mark-region
The fifth canonical family of garbage collectors is known asmark region. These col-lectors allocate objects contiguously, and free it in small contiguous regions when all objects in the region are unreachable. The most significant examples on this class of collector are Immix [Blackburn and McKinley, 2008] and the original JRockit col-lector1. Immix allocates 32KBblocks, and allocates contiguously within these blocks. During collection, each live object is marked with a bit, as with mark-sweep collectors. In addition, a second bit is set for each 128-bytelinein which the object resides. After collection, all blocks are placed in the queue for allocation. The allocator uses the per-line mark bits to identify free space within the block, and allocates contiguously into these regions.
Mark Region collectors combine excellent allocation performance and good collec-tor performance, with very low space overheads and good mutacollec-tor locality.
2.1.3.6 Generational
Two hypotheses were posed in the early 1980s regarding the lifetime of objects in a typical program. The weak generational hypothesis [Ungar, 1984] proposes that ‘most objects die young’, and is a generalisation of the strong generational hypothesis, that object lifetime is proportional to age. Observation shows that the weak generational hypothesis holds for many workloads, whereas in general the strong generational hypothesis does not [Clinger and Hansen, 1997].
Generational collectors [Lieberman and Hewitt, 1983] divide the heap into regions for objects of different ages, and perform more frequent collections on more recently allocated objects, and less frequent collections on the oldest objects. The youngest generation is generally known as thenursery, and a collection that collects only the nursery is known as aminor collection. During a minor collection, pointers from older generations into the nursery are used in addition to the standard root set when tracing
1The JRockit garbage collector was documented in a web page that is no longer available. Secondary
the set of live objects. Although it is possible (but expensive) to calculate this set at collection time, this set is generally maintained using a generational write barrierthat takes note of pointers from older generations to younger generations, keeping them
in aremembered setfor use during minor collections. The space containing the oldest
objects in a generational collector is known as themature space.
Different collection policies can be applied to each generation in a generational collector. For example, Jikes RVM’s production configuration uses a generational col-lector with an evacuating nursery and an Immix mature space. The default collec-tor in the Sun (Oracle) hotspot virtual machine uses an evacuating nursery, a pair of semi-spaces as the second generation, and a mark-sweep mature space. One signifi-cant style of generational collector is the Appel-style collector [Appel, 1989]. This is a two-generation collector, where the evacuating nursery is allowed to use 50% of the available free space, shrinking as the mature space grows and then growing again af-ter a full-heap collection. By making maximum use of the available space for nursery collections, the throughput of the collector is maximised.
Generational collectors are very effective. The majority of collectors in practical systems implemented today are a variety of generational collector.
2.1.4 Object Scanning
The transitive closure operation of a garbage collector requires locating the references from the stacks and other structures outside the heap (the roots), and then finding the referents of a heap object, an operation we refer to asscanningthe object. Broadly speaking there are two ways to locate references in each of these domains, as well as a hybrid approach.
Conservativecollectors such as the Boehm-Demers-Weiser (BDW) collector [Boehm
and Weiser, 1988] use heuristics to identify which words in the stack and other non-heap areas could possibly be non-heap pointers. Using these values as roots, a conservative collector traces the heap, regarding all words as potential pointers. The BDW collector uses a segregated free-list with a large number of closely packed size classes, and can therefore identify the boundaries of objects given a pointer into the heap. Because a conservative collector is never sure which values are actually pointers rather than (for example) character sequences or integers, the collector must never move objects, and the BDW collector uses a mark-sweep algorithm. The principal concern of the object scanning implementation in a conservative collector is in designing heuristics that distinguish references from non-references.
col-lector is in efficiently accessing and using the metadata that describes the layout of each object.
In the design space between precise and conservative collectors areambiguous roots
collectors, originally introduced by Bartlett [1988]. These collectors assume no type knowledge of the stack, registers or global variables, but rely on the compiler for in-formation about the layout of heap objects. The technique is suited to compilers that use C as an intermediate language, and can thus control the contents of the heap, while the contents of the stack etc. is under the control of the underlying C com-piler. Bartlett’s mostly copying collector takes advantage of this by using copying techniques for objects in the heap that are not pointed to by the (ambiguous) root set. The other hybrid approach—precise roots and conservative object scanning—is possible but uninteresting in real-world settings. The implementation effort to imple-ment precise stack scanning is significantly greater than that of precise heap scanning, so in systems where the former is in place it makes little sense to omit the latter.
2.2
Infrastructure
This section describes the infrastructure used to implement the techniques developed in the later chapters of this thesis. This infrastructure is integral to this thesis, and throughout the course of my PhD I made substantial contributions to the design, maintenance and improvement of Jikes RVM and MMTk, the systems I now describe.
2.2.1 Jikes RVM
Jikes RVM [Alpern et al., 2000] is an open source high performance Java virtual ma-chine (VM) written almost entirely in a slightly extended Java [Alpern et al., 1999], and is the basis for all concrete implementations presented in this thesis.
Besides being written in Java, Jikes RVM is distinctive in that it uses a compile-only strategy, and as such does not have a bytecode interpreter. Instead, a fast template-driven baseline compiler produces machine code when the VM first encounters each Java method. The adaptive compilation system then judiciously optimizes the most frequently executed methods [Arnold et al., 2000]. Using a timer-based approach, it schedules periodic interrupts. At each interrupt, the adaptive system records the cur-rently executing method. Using a threshold, it then selects frequently executing meth-ods to optimize. Finally, the optimizing compiler thread re-compiles these methmeth-ods at increasing levels of optimization.
of Jikes RVM, the boot image can be compiled using aprofiled build, which runs the unoptimized virtual machine briefly to generate edge counter information which is then used by the compiler to build the final optimized build.
2.2.1.1 Low-level Programming
Frampton, Blackburn, Cheng, Garner, Grove, Moss, and Salishev [2009] describe in detail the approach (known as vmmagic) used by Jikes RVM to break the Java lan-guage’s abstractions and deal directly with the underlying hardware. This provides several features essential to the implementation of a virtual machine, including
un-boxed typeson which much of the work described in later chapters relies.
Unboxed types as implemented by vmmagic allow us to declare local variables and object fields which are stored directly (like anintorlong, and unlike anObject),
but which have methods. One such unboxed type isAddress, which represents an ad-dress in memory, and which has the size of the underlying hardware adad-dress. Meth-ods of an AddressincludeloadInt(), which loads a 32-bit integer at the represented
address. The compiler compiles this as an intrinsic, substituting an IR sequence that (if not optimized away) eventually translates to a single instruction rather than a full method call.
Using vmmagic gives us ‘abstraction without guilt’—the ability to write fast code without sacrificing too much of the expressive power of the high-level language we develop in.
2.2.1.2 Replay Compilation
One feature of Jikes RVM that we use extensively in this thesis is replay compilation
[Huang et al., 2004]. This allows us to use the benefits of adaptive optimization but without the experimental ‘noise’ that is inherent in an adaptive timer-based optimiza-tion process.
Replay compilation requires running an experiment in two different modes. Dur-ing the first execution, each benchmark is run for a number of trainDur-ing iterations until it has reached a stable state, and the adaptive recompilation system has compiled all the ‘hot’ methods. On exit, the replay compilation system saves the list of optimized methods, their levels of optimization and the profile information used by the optimiz-ing compiler to compile the methods.
When running several invocations of a benchmark to measure experimental error, we use the same replay data. Ensuring that a benchmark is compiled the same way for each invocation significantly reduces experimental error introduced by the adaptive compilation system.
When comparing several different runtime system optimizations, we can also use the same replay compilation data, ensuring that the mutator’s behaviour is common across the optimizations being compared.
2.2.2 MMTk
MMTk is Jikes RVM’s memory management sub-system. It is a composable memory management toolkit that implements a wide variety of collectors that reuse shared components [Blackburn et al., 2004a].
MMTk collects together coherent sets of components into memory management
plans, and when a virtual machine invokes MMTk, it selects one of these plans to
manage its heap.
A plan in MMTk divides up virtual memory bypolicy, allowing different areas of the heap to be managed in different ways. A typical plan may provide alarge object
spacemanaged using Baker’s Treadmill [Baker, 1992], an Appel-style copying nursery
[Appel, 1989] and a mark-sweep mature space.
The experimental work presented in this thesis uses MMTk’s MarkSweep plan, a full-heap collector in which objects smaller than 8KB are managed by a mark-sweep policy2.We do this for a number of reasons:
1. Some of the optimizations we implement only apply to non-copying collection.
2. MarkSweep has the fastest tracing rate of any of MMTk’s non-copying collec-tors. This tends to display more prominently the results of any optimizations.
3. Mark-sweep is a well known algorithm with a long history. It is representative of a much larger class of collectors.
Many of the contributions presented in this thesis have been integrated into MMTk.
2.2.2.1 The MMTk Free-list Allocator
The segregated free list allocator used by MMTk’s MarkSweep space maintains sep-arate free lists for 40 different size classes. When a free list for a given size class is empty, one to three 4KB-blocks of memory is allocated and split into cells of the free list size. Block sizes are tuned to ensure that a maximum of 14% internal fragmenta-tion occurs in any given size class, and total fragmentafragmenta-tion is typically much less than this.
At the block level, each active thread maintains one private block for each size-class it has allocated since the previous garbage collection. At the start of each GC, all
2Objects larger than 8KB are managed by a specialized Large Object Space using Baker’s treadmill
Platform Jikes RVM GCJ 4.0
AMD Athlon64 3500+ 266 194
Pentium-4Prescott 265 214
Pentium-MDothan 210 189
PowerPC 970 G5 218 291
Table 2.1:Comparative GC performance, MMTk (Jikes RVM) vs. Boehm (GCJ). GC Throughput in MB/s
blocks are returned to the global pool and at the start of the next mutator cycle they must acquire new blocks from the global pool. This helps to minimise the amount of space tied up in per-thread blocks.
2.2.2.2 Credibility of MMTk As An Experimental Platform
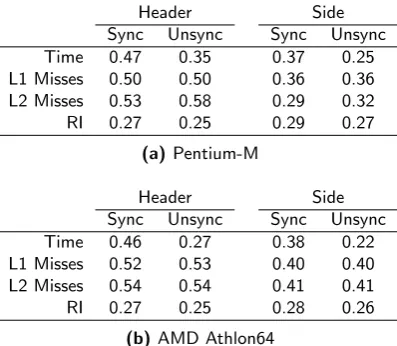
In our prefetch paper [Garner et al., 2007] we compare the performance of the tuned version of MMTk used in this paper with gcj using the standard Jikes RVM GC per-formance benchmark, FixedLive. Gcj [GCJ] is an ahead-of-time Java compiler which uses the Gnu Compiler Collection back-end and the Boehm conservative garbage col-lector [Boehm and Weiser, 1988; Boehm, 2012]. The Boehm colcol-lector is highly tuned for this environment, with a great deal of tuning in gcj aimed at reducing the root set to the smallest memory regions containing pointers into the heap. The FixedLive mark starts by allocating a large binary tree which lives for the duration of the bench-mark, and then allocates a large number of very short-lived objects, using heuristics to identify and time five garbage collections. The results of this comparison are given in Table 2.1, with the numbers representing a tracing rate in MB/s. This shows that MMTk outperforms gcj by between 11% and 37% on the x86 platforms, but lags gcj on the PPC by 33%. The tracing performance of gcj on the PPC is considerably faster than on the x86 architectures, despite the fact that on most benchmarks the PPC 970 is slower than the other machines we used. We believe that the prefetching in the BDW collector is much more effective on the PPC, and that this allows it to outperform MMTk with no prefetching.
This comparison uses the same baseline MMTk MarkSweep configuration that is the basis of Chapter 4. We use gcj version 4.0.2, and compile using the ‘-O2’ flag. The BDW collector is a conservative (ambiguous roots) collector, thus some of the performance difference may be due to it being unable to take advantage of the fast object scanning techniques used by MMTk. Our goal here, however, is simply to assert that MMTk is a well tuned platform and a credible basis for experimentation, relative to prior work.
2.3
Evaluation Methodology
at the issues of benchmarking and evaluation of results as they pertain to the work presented in the body of this thesis. Like the infrastructure I use, the benchmarks are fundamental to this thesis. I was deeply involved in the DaCapo benchmark project, as a lead author, and maintainer and developer of its evaluation framework.
2.3.1 Benchmarks
“The best choice of benchmarks to measure performance are real applica-tions, such as a compiler. Attempts at running programs that are much simpler than a real application have led to performance pitfalls. Examples include
• kernels, which are small, key pieces of real applications;
• toy programs, which are 100-line programs from beginning program-ming assignments, such as quicksort; and
• synthetic benchmarks, which are fake programs invented to try to match the profile and behavior of real applications, such as Dhrys-tone.
All three are discredited today, usually because the compiler writer and architect can conspire to make the computer appear faster on these stand-in programs than on real applications.”
Hennessy and Patterson [2006, p. 29]
Performance-oriented work on computer systems aims to improve the performance of real-world applications. While some work is targeted at a specific application or class of applications, other work targets a much wider domain. The difficulty when evaluating research is that many applications are hard to run repeatedly in controlled conditions. Many have long run-times, or require a complex hardware environment, or are licensed proprietary code. The accepted practice is to use benchmarks, a care-fully constructed or selected set of applications with defined workloads. Performance results against a well designed suite of benchmarks will be indicative of performance on the real-world programs that are the ultimate target of the research. Conversely, a bad choice of benchmarks may lead to misleading or incorrect results.
The performance analysis in this work is performed using the SPECjvm98,
SPEC-jbb2000 and DaCapo benchmarks. This section describes these benchmarks in more
detail.
2.3.1.1 The SPEC Benchmarks
some significant drawbacks. The SPEC benchmarks are primarily targeted at produc-ing a sproduc-ingle number that can be used for comparisons between computer systems. With the SPECjvm suites, the SPEC benchmark harness makes it possible to run and measure individual benchmarks, however some modification to the suite is required to (for example) time thenth iteration, or start and stop performance counters.
SPECjbb has a more fundamental problem for memory management research. In both the 2000 and 2005 versions, the benchmark runs for a fixed amount of time and reports the number of transactions performed per unit of time. While a performance improvement can be measured as it contributes to the overall throughput, it becomes impossible to directly measure improvements in garbage collector time—the better the garbage collector performs, the more work the benchmark performs, and hence the more garbage collection it performs. For these reasons, when using SPECjbb we usepseudojbb, a fixed-workload version.
In this thesis I useSPECjvm98andSPECjbb2000, because at the time of performing the experiments, Jikes RVM was unable to runSPECjvm2008and SPECjbb2005due to limitations in its class libraries.
2.3.1.2 The DaCapo Benchmarks
The DaCapo benchmarks were designed and built by a large group of researchers, in order to address some of the shortcomings in the available Java benchmark suites. The first official release of the DaCapo benchmarks was made in October 2006, to coincide with the publication of our OOPSLA paper [Blackburn et al., 2006]. The Da-Capo benchmarks are substantially more complex and varied than the SPEC bench-marks. The benchmarks were chosen with several goals in mind: relevance—all of the benchmarks should be nontrivial, actively maintained, and used in real-world settings; diversity—the benchmarks should cover a range of problem domains and coding styles; and suitability for research—a controlled, tractable workload amenable to analysis and experiments [Blackburn et al., 2008].
2.3.2 Evaluation Methodology
Evaluation methodology for memory management research in a virtual machine en-vironment is a current topic of debate in the programming language research com-munity. The evaluation methodology used in the subsequent chapters of this thesis builds on the work in Blackburn et al. [2006, 2008].
The key features of our evaluation methodology are:
1. Wide selection of quality benchmarks. We evaluate on at least 17 benchmarks from theSPECjvm98, DaCapo andSPECjbb2000suites. Only where unavoidable, we subset the benchmarks, and clearly identify where and why.
3. Multiple hardware platforms. All of our results are produced on 4 or more hardware platforms. This produces some results that are of interest because they are hardware-specific, while protecting against the pitfall of generalising from a single quirky platform.
Different portions of the thesis are evaluated on different sets of platforms. This is an unavoidable consequence of having performed the experimental work for the thesis over a period of six years. All the hardware platforms used were operated in 32-bit mode, since Jikes RVM did not have a mature 64-bit compiler implementation for the Intel architecture at the time.
4. Multiple iterations.Chapter 4 runs experiments with 5 iterations of each bench-mark and takes the fastest of the 5 runs. Chapter 5 uses 6 iterations, takes the mean of all iterations and shows a 90% confidence interval calculated using Stu-dent’s t-distribution. Chapter 3 uses a mix of these two methods. Since the results in Section 3.3.1 and Section 3.3.2 are used to support the contributions in Chapter 4 they use the methodology of that chapter, while Section 3.3.3 was performed later and uses the more recent methodology of Chapter 5.
Our own advice in Blackburn et al. [2006] is to use multiple virtual machines. It is the nature of experimental software implementation to be extremely time consuming, and implementing our experiments on a virtual machine other than Jikes RVM would be prohibitive given the available time, so where applicable we explicitly identify aspects that are specific to the virtual machine.
Garbage collector performance is in general a time/space trade-off, and it is usual to present results using a range of heap sizes. The results presented here affect the performance of basic garbage collection mechanisms, and are essentially independent of heap size. For this reason most of our results are presented for a single heap size, although we take care to verify this assumption for each optimization.
Georges et al. [2007] demonstrate the potential importance of reporting the mean with a calculated confidence interval when evaluating Java performance on modern virtual machines. As mentioned above, the work in Chapter 4 uses the minimum of a set of results and calculates no confidence interval. While it would be straightforward (if time consuming) to recalculate the results, the experiments in Chapter 5 do use these calculations and find the experimental error to be extremely low. For this reason we believe that the results in Chapter 4 would hold if we were to recalculate them.
2.4
Summary
Garbage Collector Performance
The previous chapter gave background information about garbage collection, the benchmarks used to evaluate performance, and the infrastructure we use for our ex-periments. This chapter presents a new technique—which we callreplay tracing—for analysing the performance of a garbage collector. We build on the performance results and insight obtained using replay tracing in later chapters.
This chapter is based in part on work published in the paper “Effective Prefetch for Mark-sweep Garbage Collection” [Garner, Blackburn, and Frampton, 2007]. The key contribution of this work is the technique of replay tracing, and performance analyses we present.
The chapter is structured as follows. Section 3.1 provides a brief introduction to the problem of performance evaluation of the garbage collector tracing loop and de-scribes the prior work in this area. Section 3.2 dede-scribes the replay tracing framework in detail. Section 3.3.1 analyses the tracing loop using the replay tracing framework, describing the experiments we use to determine the costs of the various parts of the loop. Section 3.3.2 uses replay tracing to evaluate two possible implementations of mark state, a side bitmap and header mark state. Section 3.3.3 looks at the perfor-mance impact of heap traversal order, using replay tracing to ensure that implementa-tion details of the queue structure are removed from the equaimplementa-tion. Finally, Secimplementa-tion 3.4 summarises the results and shows how they inform later chapters of the thesis.
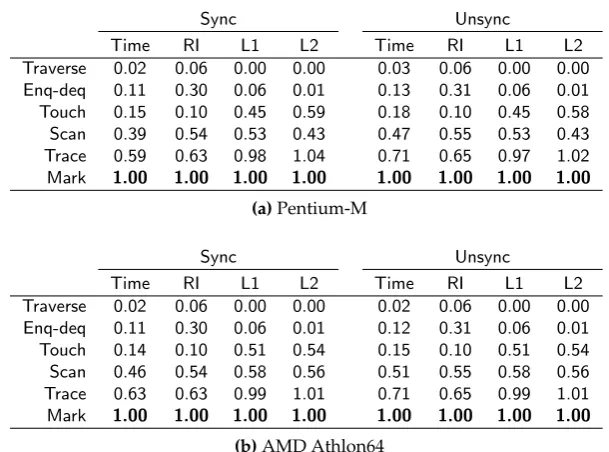
3.1
Introduction
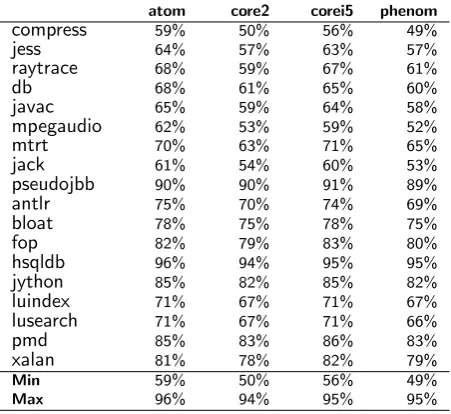
The tracing loop is the most performance-critical element of any garbage collector, and in particular it is the portion that scales with the volume of live memory in the heap. Table 3.1 shows the percentage of GC time spent tracing the heap on the machines used in Section 3.3.3. We can see from this table that the tracing loop accounts for be-tween 49% (compresson the AMD Phenom) and 96% (hsqldbon the Atom D510) of the GC time. Previous work has used sample-based profiling [Boehm, 2000] and simula-tion [Cher et al., 2004] to analyze the mechanism, each of which have shortcomings. Simulation has the disadvantage of long running times, making it difficult to use large, realistic benchmarks. Simulation also limits the available target architectures to those supported by the simulation packages available, and is entirely dependent on the
atom core2 corei5 phenom
compress 59% 50% 56% 49%
jess 64% 57% 63% 57%
raytrace 68% 59% 67% 61%
db 68% 61% 65% 60%
javac 65% 59% 64% 58%
mpegaudio 62% 53% 59% 52%
mtrt 70% 63% 71% 65%
jack 61% 54% 60% 53%
pseudojbb 90% 90% 91% 89%
antlr 75% 70% 74% 69%
bloat 78% 75% 78% 75%
fop 82% 79% 83% 80%
hsqldb 96% 94% 95% 95%
jython 85% 82% 85% 82%
luindex 71% 67% 71% 67%
lusearch 71% 67% 71% 66%
pmd 85% 83% 86% 83%
xalan 81% 78% 82% 79%
Min 59% 50% 56% 49%
[image:38.595.163.389.112.319.2]Max 96% 94% 95% 95%
Table 3.1:Tracing loop time as a percentage of total GC time.
delity of the simulation infrastructure with respect to real hardware. Sample-based profiling limits analytical flexibility: in order to sample a collector, it must be a work-ing real-world collector; this makes it time consumwork-ing to experiment with algorithmic and implementation variations, and very hard to tease apart the contributions of var-ious details of the implementation. Furthermore, sampling is inherently probabilistic rather than exact.
Hicks et al. [1997] present what is probably the work closest to our approach. Their system instruments a language runtime in order to take a snapshot of the heap, and use a special garbage collector evaluation tool to replay a traversal of the heap. This has the advantage of requiring even less of a runtime than our system. The disadvan-tage of their system is that examining GC behaviour over the entire run of a bench-mark requires taking a snapshot at each GC, producing extremely large trace files in some cases. Our approach overcomes these limitations and is more light-weight, with the basic replay tracing infrastructure requiring only a few hundred lines of code.
3.2
The Replay Tracing Framework
The solution presented here is calledreplay tracing. Our initial implementation uses a modified mark-sweep garbage collector. The system works by modifying the garbage collector so that ateverycollection, in addition to performing collection work, the col-lector gathers a trace of visited objects and thenreplaysand measures that trace multi-ple times for analytical purposes. This approach allows experimentation with a great many variations on the tracing loop, and by using timers and hardware performance counters we can analyze the various costs in detail.
(popped from the mark stack), we record a pointer to the object in areplay buffer. The replay buffer gives us a record of the objects accessed during the trace, in exactly the order in which they are accessed. We then use the replay buffer to execute multiple replay scenarios. Each scenario performs different operations on every object in the buffer. The objects are processed in exactly the same order for each scenario.
For example, a scenario which just performs a mark operation on each object al-lows us to isolate the cost of marking and thus evaluate different marking strategies. Likewise, a scenario could just touch each object, scan each object, or perform a com-plete mark, scan and trace of each object. By carefully constructing scenarios and measuring their costs, we can break down the contributions of the various elements of the tracing loop and systematically explore alternatives.
In order to minimize distortion of results due to cache pollution, we flush the cache between each use of the replay buffer by reading a large table sequentially. We use a table at least 4 times the size of the last-level cache. We also need to take care when setting mark bits—their state must be flipped after each phase in which they are changed. We repeat all of this—creating the replay buffer, replaying scenarios, and flushing the cache—each time a collection is triggered. We aggregate results across collections so that at the end of the program we have measurements for each scenario with respect to the entire GC workload of the program.
3.3
Results
We now use the framework to conduct three studies. In Section 3.3.1 we study the costs of the tracing loop. In Section 3.3.2 we evaluate the performance of side versus header metadata. In Section 3.3.3 we evaluate the impact of traversal order on the performance of garbage collection.
3.3.1 The Composition of the Tracing Loop
Our first objective of replay tracing is to break down the cost of the transitive closure operation, thetracing loop, into its component parts. Once we know which parts of the loop are most expensive, we can target them for optimization.
3.3.1.1 Replay Scenarios
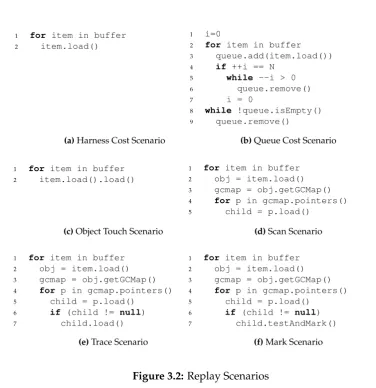
We now describe a number of example replay scenarios, including those we use in our subsequent analysis.
1 for p in root-set
2 obj = p.load()
3 mark(obj)
4 queue.add(obj)
5
6 while !queue.isEmpty()
7 obj = queue.remove()
8 gcmap = obj.getGcMap()
9 for p in gcmap.pointers()
10 child = p.load()
11 if child != null
12 if child.testAndMark()
13 queue.add(child)
Figure 3.1:The Standard Tracing Loop
(line 8), iii) enumerating reference fields (line 9), and iv) the test and mark of refer-enced objects (line 12).
In order to evaluate the relative costs of these operations, we use the scenarios shown in Figure 3.2. The harness cost scenario in Figure 3.2(a) measures the cost of the replay buffer and thus the overhead of our framework. Thequeue cost scenario in Figure 3.2(b) measures the approximate queue management cost of the standard tracing loop, alternately inserting Nitems onto the queue and popping N−1 items (we use N=10) so that the effects of growing and shrinking the queue across block boundaries are measured. Once all items are inserted, the remaining items are popped from the queue. For this scenario we use MMTk’s standardDequedata structure as a
stack, i.e. the same way MMTk uses it in Jikes RVM’s production collectors.
The object touch scenario (Figure 3.2(c)) measures the cost of accessing the first
word of each reachable object in the heap.1 The GC map, describing the location of any reference fields within the object, is typically only found via touching (and possibly dereferencing) the header of the object to be scanned. The scanscenario in Figure 3.2(d) measures the cost of visiting each object in the heap, iterating its GC map, and loading each reference field. Comparing the cost of this scenario with a scenario that simply visits each heap object can tell us about the incremental cost of the scan operation. The trace scenario in Figure 3.2(e) adds to the scan scenario a dereference of every non-null child of the scanned object. Finally, themarkscenario Figure 3.2(f) performs a mark on each non-null child of every object in the replay buffer. Themarkscenario thus performs all of the work of the standard tracing loop except the final enqueuing operation; compare lines 9 to 13 in Figure 3.1 with lines 4 to 7 in Figure 3.2(f).
One might be tempted to assume that the change in workload of two scenarios where the second scenario strictly adds work to the first one can be measured by simple subtraction. This is true for wall clock time (at least in our observations), but
1In Jikes RVM, the object pointer actually points 4 bytes past the first field of a scalar object, and at