Na2S 0 4 on Cu11 and Zn Adsorption onto
Synthetic Goethite
Christopher G. Gunton
Department of Earth and Marine Science
September 2007
A thesis submitted for the degree of
Doctor of Philosophy of
Declaration
The research and results within this thesis was undertaken at the Department of Earth and
Marine Sciences, The Australian National University. Except where acknowledged, the
content of this thesis is my own and has not been previously submitted to qualify for any
other qualification or award.
Christopher G. Gunton
Acknowledgements
Firstly, I would like to acknowledge that this research was supported and funded by the Co operative Research Centre for Landscape, Environments and Mineral Exploration (CRC LEME) in conjunction with an Australian Postgraduate Award from the Australian Government.
Thanks must go to Dr Ying Chen from the Research School of Physical Sciences and Engineering at the Australian National University who conducted the N2 BET analysis for surface area calculations, Dr Patrica Angus formerly from the Chemistry Department at the ANU for her valuable advice for setting up the experimental methodology and Linda McMorrow from the Department of Earth and Marine Science at the ANU for her patience and assistance with analysing samples. Thankyou to Dr Keith Scott form CRC LEME for your advice and insight on how to keep the project relevant to the ‘real world’.
To anyone who has undertaken the mammoth task of completing a PhD, you can understand the time, effort and emotional highs and lows that accompany the task. 1 have been fortunate to have had the support of both my fellow students and staff at the Department of Earth and Marine Science who contributed to a stimulating research environment. To everyone in the department, my sincere thanks.
To my supervisors, Dr D.C. “Bear” McPhail and Dr Andrew Christy, without your support and guidance, this research certainly would not have developed this far and you always managed to give the right direction when it was most needed. Your advice, no matter how brutal at times, was always invaluable.
Finally, to the most important and influential people in my life, my family Angela and Chloe. I would never have completed this without your support and patience over the past 5 years. This is a journey and achievement we have made together.
Abstract
Abstract
Metal mobility in natural environments may be controlled by the aqueous speciation of
metals, dissolution/precipitation reactions or metal adsorption onto mineral and/or organic
surfaces. Data from simple experimental systems has provided enough knowledge of
adsorption reactions to examine more complex geochemical systems, such as those
characteristic of natural environments.
This study examines Cu" and Zn adsorption in 0.1-5 molal NaCl and 0.001-1 m Na2SC>4
using batch experiments at 25°C and pH 2-9.5. Cu11 and Zn adsorption was greater in NaCl
solutions when compared to SO4" solutions at pH < 7.5. In 0.5 m NaCl and pH 6.5, all
available Cu11 was removed from the aqueous phase and assumed to be adsorbed on
goethite, while the concentration of adsorbed copper was approximately 20% lower in 0.01
m Na2SC>4 at the same pH. In contrast, zinc adsorption was greater in sulfate solutions at pH
< 7.5 than in NaCl solutions of the same pH. An adsorption maximum for Cu11 occurred at
2.0 molal NaCl, and at concentrations > 2.0 molal adsorption decreased. A similar effect
was observed for Zn adsorption at 1.0 molal NaCl, where Zn adsorption decreased in NaCl
concentrations >1 molal.
Surface complexation modelling using the Constant Capacitance Model (CCM) was used to
infer the surface complexes responsible for adsorption and calculate equilibrium constants
complexes, e.g. SOCuCl0 and SOZnCC (where SO represents the underlying goethite
surface) are responsible for the enhanced adsorption of Cu11 and Zn in NaCl solutions.
Adsorption was interpreted to decrease in NaCl concetrations >2.0 molal for Cu11 and 1.0
molal for Zn due to the formation of stable aqueous metal chloride species. In sulfate
solutions, Cu11 and Zn was also interpreted to form ternary surface complexes e.g.
SOHCuSCC and SOZnSCL. The CCM implied that the formation of stable aqueous Cu" and
Zn sulfate complexes decreased adsorptin with increasing sulfate concentrations.
The predictive power of the model was established when results of a coexisting Cu11, Zn
and NaCl and NazSCL experiment were successfully replicated using the calculated
equilibrium constants for Cu11 and Zn adsorption in NaCl and sulfate solutions. Finally, the
model was used to assess Cu11 and Zn mobility in mixing waters in a natural environment
based on measured data from Lake Tyrrell. This showed that mixing of a highly saline
water with relatively fresh water would decrease Cu11 adsorption, thereby enhancing Cu11
Table of Contents
Table of Contents
Acknowledgements iii
Abstract iv
Table of Contents vi
Chapter 1: Introduction 1
1.1 The Role of Adsorption in Natural Environments 1
1.1.1 Applications of Adsorption in Environmental Geochemistry 2 1.1.2 Applications of Adsorption in Mineral Exploration 3
1.2 History of Adsorption Research 5
1.3 Project Aims 9
Chapter 2: Effect of NaCl on Cu11 Adsorption onto Synthetic Goethite 12
2.1 Introduction 12
2.2 Materials and Methods 16
2.2.1 Goethite Synthesis and Characterisation 16
2.2.2 Adsorption Experiments 17
2.2.3 Ionic Strength Effect Experiments 20
2.3 Results 21
2.3.1 Cu11 Adsorption onto Goethite in NaNÜ3 Solutions 21
2.3.1.1 Quantitative Interpretation 26
2.3.1.2 Surface Complexation Modelling 29
2.3.1.3 Surface Site Density 33
2.3.1.4 Fitting Equilibrium Constants 35
2.3.2 Cu11 Adsorption onto Goethite in NaCl Solutions 45
2.3.2.1 Fitting Equilibrium Constants 48
Chapter 3: Effect of NaCl on Zn Adsorption onto Synthetic Goethite 60
3.1 Introduction 60
3.2 Materials and Methods 64
3.2.1 Goethite Synthesis and Characterisation 64
3.2.2 Adsorption Experiments 64
3.3 Results 65
3.3.1 Zn Adsorption on Goethite in NaNÜ3 Solutions 65
3.3.1.1 Quantitative Interpretation 70
3.3.1.2 Surface Complexation Modelling 72
3.3.1.3 Surface Site Density 72
3.3.1.4 Fitting Equilibrium Constants 74
3.3.2 Zn Adsorption onto Goethite in NaCl Solutions 78
3.3.2.1 Fitting Equilibrium Constants 86
3.4 Conclusions 95
Chapter 4: Effect of Sulfate on Zn and Cu11 Adsorption onto Synthetic 97
Goethite
4.1 Introduction 97
4.2 Materials and Methods 101
4.2.1 Adsorption Experiments 101
4.3 Sulfate Adsorption onto Synthetic Goethite 104
4.4 Cu11 Adsorption onto Goethite in Na2SC>4 107
4.4.1 Quantitative Interpretation 112
4.4.2 Surface Complexation Modelling 115
4.4.2.1 Summary of Model Parameters 115
4.4.2.2 Fitting Equilibrium Constants 117
4.5 Zn Adsorption onto Goethite in Na2SÜ4 123
4.5.1 Quantitative Interpretation 128
4.5.2 Surface Complexation Modelling 132
4.5.2.1 Fitting Equilibrium Constants 132
138
Table of Contents
Chapter 5: Implications for Metal Transport 140
5.1 Introduction 140
5.2 The Effect of Anion Competition on Cu11 and Zn Adsorption 141
5.2.1 Materials and Methods 142
5.2.2 Results 143
5.3 Applications and Implications for Cu11 and Zn Transport 153
5.4 Conclusions 159
Chapter 6: Summary and Conclusions 161
6.1 Introduction 161
6.2 Key Findings 161
6.2.1 Copper Adsorption in NaCl Solutions 161
6.2.2 Zinc Adsorption in NaCl Solutions 162
6.2.3 Copper and Zinc Adsorption in Na2SÜ4 Solutions 163
6.3 Scope for future Work 164
6.3.1 Ionic Strength Effects on pH 164
6.3.2 Investigation of Cu!1 and Zn in mixed Anion Solutions 165
6.3.3 Effect of CO2 on Metal Adsorption 165
6.3.4 Investigation of Ternary Surface Complexes 166
6.4 Conclusion 167
References 169
Appendix A: Experimental Data for Cu11 Adsorption onto Goethite in NaNO? 177
and NaCl Solutions
Appendix B: Experimental Data for Zn Adsorption onto Goethite in NaNC>3 184
and NaCl Solutions
Appendix C: Experimental Data for Cu11 and Zn Adsorption onto Goethite in 193
Na2SC>4 Solutions
Appendix D: Experimental Data for Cu11 and Zn Adsorption onto Goethite in 197
1.0 molal NaCl and 0.1 molal Na2SC> 4
Appendix E: Example of FITEQL 4.0 Input File with Debye-Hiickel ‘b-dot’ 198
Activity Coefficients
Appendix F: Summary of Fitted Log K values for Experiments 202
Chapter 1: Introduction
Chapter 1: Introduction
Adsoiption is an important geochemical process that has the capability to control metal
mobility in natural, low temperature, near surface environments (i.e. groundwater,
laccustrine and marine environments). Adsorption is important to scientific disciplines such
as soil science (e.g. Sposito, 1984; Barrow et ah, 1982), mineral exploration (e.g. Rose and
Biachi, 1993), hydrogeochemistry (e.g. Balistrieri and Murray, 1982), environmental
geochemistry (including contaminated land, Swartz et al., 2004; and remediation), and
minerals processing. However, due to the limited knowledge of adsorption reactions, most
adsorption studies were conducted in simple experiments with low concentrations of inert
electrolytes (e.g. NaNCb, NaC104). These simple experimental conditions are not
representative of natural systems, and yet understanding metal mobility in near surface
environments is critical for solving many problems presently facing the global population.
1.1 The Role of Adsorption in Natural Environments
The purpose of this study was to examine the effect of NaCl and Na2S04 on adsorption.
This has implications in mineral exploration and environmental geochemistry, which are
consistent with the objectives of the Co-operative Research Centre for Landscape,
Environment and Mineral Exploration (CRC LEME). A brief description of the
1.1.1 Applications o f Adsorption in Environmental Geochemistry
The number of reported occurrences of groundwater contamination from anthropogenic and
natural sources is rising (Koretsky, 2000), posing health risks to large populations of people
who depend on these water resources. For example, arsenic contamination of groundwater
used for drinking is a significant geohazard in countries such as India, Bangladesh (e.g.
Swartz et al., 2004; Anawar et al., 2003; Pena et al. 2005), Vietnam, Chile and Switzerland
(Pena et al., 2005; Pfeifer et al. 2004). This problem affects millions of people in
Bangladesh alone, where it is estimated that >1 million people will suffer from arsenocosis
(Yu et al., 2003; Swartz et al., 2004). Research has indicated that microbial activity has
promoted the reduction of iron oxyhydroxides and mobilised arsenic (e.g., Pfeifer et al.
2004; Swartz et al. 2004). This hypothesis implies that mobility may have once been
inhibited by arsenic adsorption onto iron oxyhydroxides (i.e. ferrihydrite, goethite,
schwertmanite, mackinawite etc.) prior to reduction of the environment. Therefore
understanding the effect of physical changes (i.e. changes in temperature) or chemical
properties (i.e. salinity increases, pH changes, redox changes) on adsorption is a key to
determining the cause and solving this harmful problem.
Acid sulfate soil is an increasing environmental problem in Australia, with an estimated
40,000 km“ of coastal land affected. The impact of acid sulfate soils is felt by coastal
communities and industries through the destruction of natural environments and eco
systems such as estuarine and coastal wet-lands; depletion of commercial resources (i.e.
fisheries) and the destruction of community infrastructure (Sammut, 2000). The role of
adsorption in these environments is not well known as yet. Metal mobility is predicted to
Chapter 1: Introduction
increase in acid sulfate soil environments due to the low pH of affected water and the
formation of various metal-sulfate aqueous complexes which stabilize metal cations in
solution. However, adsorption studies examining the role of aqueous sulfate on metal
adsorption onto iron oxy-hydroxides (i.e. Swedlund and Webster, 2001; Balistrieri and
Murray, 1982; Ali and Dzombak, 1996) have shown that sulfate may in fact enhance metal
adsorption. This raises the question of whether adsorption may be a method of controlling,
or possible remediation, of acid sulfate soil affected locations.
Understanding the role of adsorption on the retention or mobility of toxic metals in the
environment is important if heavy metal contamination is to be controlled or remediated.
However, the key controlling factors (i.e. aqueous speciation of solutions or mineral surface
properties) must be understood before these major environmental problems can solved.
1.1.2 Applications of Adsorption in Mineral Exploration
Mineral exploration in Australia is becoming increasingly difficult because the majority of
the large world class mineral deposits exposed at the surface (e.g. Broken Hill; de Caritat et
al., 2005 and Mount Isa; Perkins, 1996) have been discovered. Therefore mineral explorers
are forced to explore regions with a thick residual regolith (e.g. the goldfields of Western
Australia) or covered by young transported sediments (e.g. Carpentaria Basin in NW
Queensland and the Murray Basin in Victoria).
The discovery of large Proterozoic ore deposits underneath transported regolith (e.g.
Olympic Dam in South Australia; Ernest Henry and Cannington in North-West
Queensland) have been made with geophysical methods such as magnetics and gravity
surveys. However, not all styles of mineralisation may exhibit such strong geophysical
responses, and other exploration tools, such as geochemical sampling of soils or
groundwaters (c.f. de Caritat et al., 2005), may be useful for identifying areas with
mineralisation. Given the enormous surface area of Australia covered by either a residual
regolith or transported cover sediment, the potential for undiscovered world class orebodies
to exist is high.
When considering geochemistry as a mineral exploration tool, it is important to understand
the processes involved with enhancing metal concentrations in the regolith. Traditional
exploration geochemistry models assume that mineralised host rocks are exposed at the
surface, where physical and/or chemical weathering decomposes the rock, dissolving and
transporting metals. However, other models for exploring in regions under cover need to be
considered, de Caritat et al. (2005) proposed groundwater as a medium for sampling in
regions with thick cover. Radford and Burton (1999) proposed the formation of
geochemical anomalies in transported cover by the upward migration of metals caused by
factors such as bioturbation and fluctuating groundwater levels. Both these strategies rely
on adsorption/desorption processes to trap metals in the regolith and understanding the
effect of groundwater chemistry, mineral and surface properties on these processes may
lead to more effective sampling techniques. Chapter 5 will demonstrate how the adsorption
data collected in this study can be used to predict the mobility of Cu11 and Zn in
environments similar to those found in natural saline lakes.
Chapter 1: Introduction
1.2 Summary of Adsorption Research
It is difficult to distinguish between the adsorption of an ionic species on a solid surface and
precipitation of a new mineral. The definition of adsorption used for this study is that of
Koretsky (2000): “The term adsorption is used if species are taken up from the solution and
are chemically bound in a monolayer at the mineral-water interface”. This implies that
adsorption occurs as a two-dimensional layer at the surface-water interface, while a
precipitate is considered as a three-dimensional structure that extends in to the surrounding
aqueous phase.
Surface - water interface geochemistry has been a topic of interest for a long period of
time. The first observations of reactions between the surface - water interface were made
during silicate dissolution experiments conducted in the early 1800’s (Hochella and White,
1990). Significant advances in the knowledge of interface geochemistry did not occur until
the late 1960’s with the advent of better analytical methods (i.e. potentiometric titrations)
which resulted in the development of surface complexation models (Dzombak and Morel,
1990). Interest in the mineral water interface was sustained until the early 1980’s, when the
number of published papers appeared to decrease. A resurgence of surface - water interface
studies occurred in the early 1990’s, which coincided with a rise in the number of
metal/mineral combinations studied.
Adsorption research has ranged from experimental studies designed to quantify metal
adsorption in carefully controlled environments (i.e. Balistrieri and Murray, 1982;
Padmanabham, 1983a; Barrow et al., 1980), to the development of numerical models
designed to predict adsorption in specific conditions (i.e. Robertson and Leckie, 1997;
Peacock and Sherman, 2004; Sahai and Sverjensky, 1990a; Criscenti and Sverjensky, 1996;
Persson and Lovgren, 1996, Dyer et al. 2004). The recent availability of more sensitive and
accurate analytical equipment (i.e. XAS, EXAFS and XANES), has allowed researchers to
observe these reactions at the atomic level, providing information about the formation of
specific complexes at the solid-solution interface (i.e. Trivedi et al. 2001; Peacock and
Sherman, 2004; Waychunas et al. 2002; Waychunas et al. 2003).
Research has shown that adsorption onto mineral surfaces is controlled by stoichiometry
and stability of the adsorbate species, surface properties of the adsorbing mineral and the
properties of the host solution (i.e. pH and chemical speciation). It is well established that
cation adsoiption onto non-permanently charged surfaces (such as iron-oxyhydroxides)
decreases with decreasing pH; caused by H+ adsorption onto the mineral surface at low pH,
which creates a net positive surface charge and repels other cations. The opposite occurs for
negatively charged anions, such as metal-oxide complexes, where adsorption increases with
decreasing pH (e.g. Dzombak and Morel, 1990). The adsorption edge, or the pH range
where adsorption primarily occurs, has been shown to vary depending upon the metal
species (e.g. increase in adsorption of Cu11 is greatest between pH 4.5-5.5 in NaNCE
solutions, compared with that for Zn at pH 6-7; Dzombak and Morel, 1990).
A detailed description of the mineral surface is made by Davis and Kent (1990), therefore
only a brief explanation is provided here. Two groups of mineral surfaces have been
identified, permanent and with non-permanently charged surfaces, which reflect the major
charge properties of the mineral. Non-permanently charged minerals possess proton bearing
Chapter 1: Introduction
functional groups and adsorption is strongly dependent on pH (Davis and Kent, 1990).
Non-permanently charged include iron oxy-hydroxides (e.g., goethite, ferrihydrite),
silicates and titanium oxides (Davis and Kent, 1990; Yates, 1975). These minerals are well
characterized and have large volumes of data describing their morphology, surface area and
adsorption site densities, while their relatively simple crystal structures and strong
adsorbing properties make them ideal for studying adsorption reactions. Minerals with a
permanent surface charge do not have proton bearing functional groups at the surface, and
their permanent charge is attributed to cation exchange (e.g. Al3+ replacing Si4+ in kaolinite;
Peacock and Sherman, 2005). Minerals used in adsorption studies examining metal
adsorption onto permanently charged surfaces include kaolinite (Peacock and Sherman,
2005; Heidmann et ah, 2005), montmorillonite (Catalano and Brown Jr, 2005; Brigatti et
ah, 2004), sepiolite (Vico, 2003) and vermiculite (Abate and Masini, 2005). Results of
these studies suggest permanently charged surfaces are ideal adsorbates. However,
separating the influence of cation exchange capacity from adsorption and precipitation
reactions can be difficult (Catalano and Brown Jr, 2005).
The influence of solution chemistry, and in particular ligands, on the adsorption of metals
has been a topic of recent interest (e.g. Criscenti and Sverjensky, 1999; Swedlund and
Webster, 2001; Balistrieri and Murray, 1982; Ali and Dzombak, 1996) in an attempt to
simulate natural environments. For example, sulfate is one of the more frequently anion
species studied. It has been considered as an adsorbing anion itself (e.g. Persson and
Lovgren, 2004; Rietra et ah 1999; Juang and Wu, 2005; Geelhoed et ah, 1999) and as a
complexing or competing ion, either suppressing or enhancing the adsorption of other
cations (e.g. Ali and Dzombak, 1996; Balistrieri and Murray, 1982; Swedlund and Webster,
2001). The influence of solution speciation is not well understood, especially in conditions
found in many natural environments. While the effect of anions on metal adsorption have
been addressed previously (e.g. the effect of sulfate on metal adsorption), experimental
conditions are usually kept simple and well constrained, in order to assist numerical
modeling processes and eliminate complex issues (such as calculation of activity
coefficients in high ionic strength solutions). As a result, no experimental adsorption data in
solutions with high ionic strength is available and the adsorption behavior of metals in
many natural environments is not known.
This study uses experiments to quantify oxidised copper (Cu11) and zinc (Zn) adsorption
onto synthetic goethite over a range of NaCl (0.1 - 5 molal) and Na2SC>4 (0.001 - 1 molal)
concentrations to represent saline (simulated by NaCl) and acid sulfate soil conditions
(simulated by NaiSO.*). No previous studies have not examined the effect of chloride at
concentrations greater than sea water (0.56 molal, Balistrieri and Murray, 1982) or sulfate
concentrations greater than 0.1 molal (Ali and Dzombak, 1996); and do not reflect some of
the high concentrations of C f and SO4 ' associated with saline groundwater or acid sulfate
soils. Furthermore, there are conflicting results for the effect of chloride and sulfate
concentrations for Cu11 and Zn adsorption. Balistrieri and Murray (1982) concluded that
NaCl had no effect on the adsorption of Cu11 and Zn onto goethite in simulated seawater
conditions (NaCl = 0.56 molar), and Swallow et al. (1980) found that 0.5 molar NaCl did
not affect Cu11 adsorption onto ferrihydrite. In contrast, Barrow et al. (1980) reported that
the adsorption of copper increased when the NaCl concentration was increased from 0.0075
M to 0.075 M, which was in agreement with the conclusions of Padmanabham (1983b).
Kanungo (1994) studied Zn adsorption in 0.5 molar NaCl in acidic solutions and found that
Chapter 1: Introduction
adsoiption was enhanced slightly at low pH when compared with NaNCU experiments. To
add to the confusion, an extensive literature review by Criscenti and Sverjensky (1999)
examining the effect of anions on metal adsoiption led them to believe that transition and
heavy metal adsorption was suppressed with increasing NaCl.
1.3 Project Aims
The key aims of this project are:
1) Determine the effect of salinity (simulated by a range of NaCl concentrations) on
the adsorption of Cu11 and Zn onto synthetic goethite under controlled experimental
conditions.
2) Determine the effect of sulfate concentration on the adsorption of Cu1! and Zn onto
synthetic goethite under controlled experimental conditions.
3) Use Cu11 and Zn to compare the effect of NaCl and Na2SC>4 on base metal
adsorption onto goethite.
4) Describe the impacts salinity and sulfate concentrations may have on the mobility of
copper and zinc in the regolith.
To meet these objectives, experiments were used to collect Cu11 and Zn adsorption data in
solutions 0.1 - 3.0 molal NaNC>3, 0.1 and 5.0 molal NaCl and 0.001, 0.01, 0.1 and 1.0
molal Na2SC>4. This data was used in conjunction with surface complexation modelling to
aid interpretation and calculate equilibrium constants for surface species. Synthetic goethite
was selected for adsorption experiments because it is a common mineral in oxidized near
surface environments. Unlike ferrihydrite, goethite is relatively stable and unlikely to
change in composition or morphology during experiments. Synthesizing goethite is a
simple process, but more important surface properties such as morphology, surface area and
site density remain consistent between synthesised batches, and it can be easily
characterised (i.e. Kosmulski, 2003). Copper and zinc adsorption onto goethite in NaNCb
solutions has been previously investigated (e.g. Balistrieri and Murray, 1982; Barrow et al.,
1980; Padmanabham, 1983b; Kanungo, 1994b; Trivedi et al. 2001 ; Peacock and Sherman,
2005; Robertson and Leckie, 1997), so the results of this study can be compared with
previous studies to determine the reliability of the experimental method. Furthermore,
copper and zinc provide a contrast in their adsorption behaviour (since their acid-base
properties and aqueous complexation are different), these metals frequently associated with
one another and are relatively common in the oxidized, low temperature near surface
environments that are considered in this study.
Cu11 and Zn were selected to examine the effect of NaCl and Na2SC> 4 concentration on to
synthetic goethite because both metals are both economic commodities that are actively
being explored for. Furthermore, both metals are common in natural oxidized near surface
waters, but exhibit different aqueous speciation behaviour. These metals also demonstrate
contrasting adsorption properties where Cu11 adsorption occurs in acidic conditions (e.g.
between pH 4 and 6) while Zn adsorption occurs between pH 7 and 9, as shown in previous
adsorption studies (e.g. Balistrieri and Murray, 1982; Trivedi et al., 2001; Dyer et al.,
2004). Therefore, studying these two metals will determine how anion concentration may
influence different metal species.
Chapter 1: Introduction
NaNOß was used in experiments to compare the results of this study with those of previous
authors to determine the reproducibility of adsorption data from the experimental method
used. Chloride and sulfate anions were used to simulate natural conditions. For example,
NaCl was used to simulate saline water found in regions affected by dryland salinity, while
Na2SC>4 was used to simulate high sulfate concentrations found in areas with acid sulfate
soils.
Chapter 2: Effect of NaCl on Cu11 Adsorption on Synthetic
Goethite
2.1 Introduction
Understanding copper mobility in low-temperature waters, soils and more broadly, the
regolith, is important for mineral exploration geochemistry, mineral processing,
remediation of heavy metal contamination in waters and soils and the impact of copper
as a micronutrient and/or toxin to biota (e.g., Bampton et al. 1977; Davis and Leckie,
1978; Padmanabham, 1983b; Barrow et al, 1982; Cairns et al. 2001). The mobility of
copper depends on transport processes such as groundwater flow as well as geochemical
processes such as the dissolution/precipitation of copper-bearing minerals and sorption
onto inorganic and organic material. Microbiological processes may also be important
(e.g., Gordon et al., 2000). Adsorption onto mineral surfaces is likely to be particularly
important (Swallow et al., 1980; Balistrieri and Murray, 1982; Barrow et al., 1982;
Padmanabham, 1983a; Padmanabham, 1983b; Dzombak and Morel, 1990; Rodda et al.
1993; Kooner, 1992; Rodda et al. 1996; Sen et al., 2000; Criscenti and Sverjensky;
1999, Bradl, 2004; Peacock and Sherman, 2004), but despite many published studies it
is still not well understood, especially under the saline conditions found in regolith and
other geological environments. This chapter the focuses on the effect of dissolved NaCl
on the adsorption of Cu" onto goethite, a-FeOOH. It aims to improve the understanding
Chapter 2: Effect of NaCl on Cu11 adsorption onto Goethite
minerals are likely to exert significant control on copper sorption and mobility (Kooner,
1992; Peacock and Sherman, 2004).
Metal adsorption onto mineral surfaces depends on the nature of the sorbate (i.e.,
aqueous geochemistry of the metal) and the nature of the sorbent (i.e., a mineral and its
surface; e.g., Drever, 1997; Langmuir, 1997). The aqueous speciation of oxidised
copper is affected by temperature, pressure, and the composition of the solution such as
pH, redox and ligands such as Cl' (cf., Brugger et al., 2001), S 0 42 and organic
compounds such as humic and fulvic acids (e.g., Weng et al., 2002). The specific
surface area of goethite and density of active adsorption sites may affect adsorption and
vary with both the crystalline habit of the goethite and other physical and chemical
parameters of the system (e.g. Manceau et al., 2000). Many of these geochemical
variables have already been studied for oxidised copper and iron oxyhydroxides such as
goethite, ferrihydrite and lepidocrocite (e.g., Peacock and Sherman, 2004).
pH is perhaps the most important geochemical variable affecting adsorption of cations
onto mineral surfaces and its effect on the adsorption of Cu11 onto goethite and other Fe
oxides and oxyhydroxides and has been studied comprehensively. Table 2.1 summarises
previous studies examining the adsorption of Cu11 onto goethite, with the results of these
studies all showing that the adsorption of cations increases markedly as the pH of the
solution increases.
The effects of temperature and pressure on sorption are likely to be small under the
range of conditions typical of near surface environments. Rodda et al. (1993) studied
and 80°C and found that sorption increased by only a few percent with increasing
[image:23.523.57.482.163.498.2]temperature.
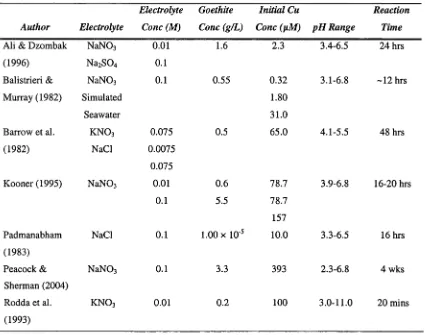
Table 2.1: Summary of previous experimental studies of Cu" adsorption onto goethite.
Author Electrolyte
Electrolyte
Cone (M)
Goethite
Cone (g/L)
Initial Cu
Cone (nM) pH Range
Reaction
Time
Ali & Dzombak N aN 03 0.01 1.6 2.3 3.4-6.5 24 hrs
(1996) Na2S 0 4 0.1
Balistrieri & N aN 03 0.1 0.55 0.32 3.1-6.8 ~12 hrs
Murray (1982) Simulated 1.80
Seawater 31.0
Barrow et al. k n o3 0.075 0.5 65.0 4.1-5.5 48 hrs
(1982) NaCl 0.0075
0.075
Kooner (1995) N aN 03 0.01 0.6 78.7 3.9-6.8 16-20 hrs
0.1 5.5 78.7
157
Padmanabham NaCl 0.1 1.00 x 10'5 10.0 3.3-6.5 16 hrs
(1983)
Peacock & N aN 03 0.1 3.3 393 2.3-6.8 4 wks
Sherman (2004)
Rodda et al. k n o3 0.01 0.2 100 3.0-11.0 20 mins
(1993)
The compositions of waters and brines, especially the presence of complexing ligands,
also have an effect on copper sorption. Electrolytes such as NaNOß, KNO3 and NaC104
are typically selected to study the effects of ionic strength on sorption due to their
unreactive nature with mineral surfaces (Balistrieri and Murray, 1982) and weak
complexing of metals with nitrate or perchlorate in aqueous solutions (Criscenti and
Sverjensky, 1999). The role of ligands, such as Cl" and S042", on the adsorption of
Chapter 2: Effect of NaCl on Cu" adsorption onto Goethite
limited range of concentrations (Table 2.1). Results of these studies indicate that the
presence of ligands influences adsorption of metals onto mineral surfaces, but the
magnitude of the changes, and even whether they enhance or suppress sorption, is still
poorly understood.
The effect of chloride concentration on the adsorption of Cu11 onto goethite is unclear.
Balistrieri and Murray (1982) concluded that NaCl had no effect, based on their
experimental study of Cu11 adsorption onto goethite under simulated seawater
conditions. Swallow et al. (1980) studied the effect of NaCl on Cu11 adsorption onto
hydrous ferric oxide, but they also concluded that NaCl had no effect on the adsorption
of Cu11 after examining the adsorption of C u11 and Pb11 onto hydrous ferric oxide in 0.1
M and 0.5 M NaNC>3 and 0.5 M NaCl solutions. Other studies, however, suggest that Cl’
enhances metal adsorption onto iron oxyhydroxides. Barrow et al. (1982) found that
Cu11 adsorption onto 0.5 g/L synthetic goethite increased with increasing NaCl
concentration (i.e., 0.0075 M and 0.075 M NaCl), and attributed this to the preferential
adsorption of CuCP aqueous complexes onto the goethite surface. Padmanabham
(1983b) studied the adsorption of 1.0 x 1 0 5 M Cu" onto synthetic goethite in 0.1 M
NaCl and 0.1 M NaNC>3 solutions and found similar behaviour. In studies with other
metals, e.g., Pb11 sorption onto goethite and alumina, increasing chloride concentrations
enhances sorption (e.g., Gunneriusson et al., 1994; Bargar et al., 1998). In contrast, in
an extensive review of adsorption literature and the effect of anions on metal sorption,
Criscenti and Sverjensky (1999) concluded that transition and heavy metal adsorption
In this chapter, the effect of pH, NaNOß and NaCl concentration on the adsorption of
Cu" onto synthetic goethite in an aqueous system is investigated experimentally.
Adsorption data were collected for a range of NaNC>3 (0.1-3 molal) and NaCl
concentrations (0.1-5 molal) to examine the changes in adsorption behaviour of Cu11
onto goethite as a function of NO3', ionic strength and Cl'. Surface complexation
modelling was used to interpret the experimental data and fit thermodynamic
equilibrium constants for surface reactions with Cu11 and Cl". The aim was to achieve a
clearer understanding of how Cu" adsorbs in near surface environments, settle the
question of whether adsorption increases or decreases with NaCl, and obtain
predictively useful thermodynamic properties that will allow more reliable geochemical
and reactive transport models.
2.2 Materials and Methods
2.2.1 Goethite Synthesis and Characterisation
Goethite was synthesized according to the method outlined by Schwertmann and
Cornell (1991) using reagent-grade chemicals. Briefly, 100 mL of 1.0 M aqueous
Fe(NC>3)3 solution was mixed with 180 mL of 5.0 M KOH in a 2 L polyethylene flask
and diluted to 2 L with ultrapure water. The subsequent hydrolysis reaction produced a
dark brown precipitate, which was sealed in the flask and placed in an oven at 70°C for
60 hours. The solution in the flask was decanted and the precipitate was rinsed a
minimum of three times with double deionised water. The resulting material was
analysed by X-Ray diffraction and the pattern was the same as that for goethite
Chapter 2: Effect of NaCl on Cu" adsorption onto Goethite
the goethite to be homogeneous, consisting only of acicular crystals up to
approximately 2 pm long and 300 nm wide (Figure 2.1). The specific surface area was
measured to be 36.05 ± 3.2 m /g using N2 BET analysis. The site density was calculated
using adsorption experiments and is described in detail later in Section 2.3.1.3. Goethite
was stored in ultrapure water at room temperature until required, and then filtered, dried
and crushed in preparation for the adsorption experiments.
Figure 2.1: SEM images of synthetic goethite showing the morphology of the goethite crystals. The
measured surface area of goethite was 36.05 nm2/g.
2.2.2 Adsorption Experiments
Adsorption was measured in separate series of 11-12 individual experiments. For each
experiment 0.075 g of dried goethite was placed in a 125 mL glass reaction vessel with
75 g of an electrolyte solution.
2.52 x 10° molal Cu" stock solutions were prepared using Cu(N0 3)2.2V2H20 in a
matrix consistent with the electrolyte used for each series. 5 g of the Cu11 stock solution
molal for each experiment. The pH of each sample was adjusted using 0.1 M HNO3 or
0.1 M NaOH and measured using a Thermo Orion 290A+ pH Meter and ROSS Sure
Flow electrode with an uncertainty of ± 0.02 pH units. Reaction vessels were sealed
with a Dreschel head and placed in a water bath at 25°C ±0.1 to maintain constant
temperature.
In order to minimise the effect of CO2 adsorption onto goethite (i.e., Zeltner and
Anderson, 1988), nitrogen gas was bubbled through a reaction vessel containing double
deionised water to saturate the gas and minimise the effect of evaporation, before being
passed through each reaction vessel in sequence to mix each solution and provide an
inert atmosphere.
Kinetic experiments were conducted to measure the time for adsorption of Cu" onto the
goethite surface. 0.281 g of goethite was placed in a glass reaction vessel with 300 g of
0.1 molal NaNC>3 and 1.54 x 10 4 molal Cu11. At specific time intervals, the pH of the
experiment was recorded and 8 g of the goethite-bearing solution was withdrawn with a
syringe and filtered through a 0.22 pm syringe filter before being analysed for dissolved
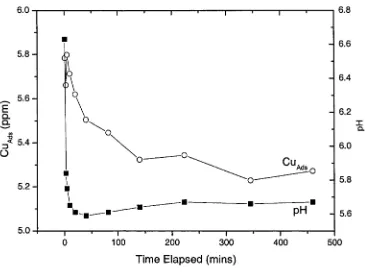
copper. Kinetic experiments (Figure 2.2) show that steady state between goethite and
Cu" was achieved after 3-4 hours, but to ensure that equilibrium was achieved in each
reaction vessel, all experimental series were run overnight for 16 hours. It is not clear
whether equilibrium in these experiments and further data between 4 and 16 hours is
Chapter 2: Effect of NaCl on Cu" adsorption onto Goethite
[image:28.523.85.450.85.357.2]Time Elapsed (mins)
Figure 2.2: Concentration of adsorbed Cu11 and pH as a function of time at 25°C and 1 atmosphere. The
total Cu11 concentration was 1.54 x 10'4 molal, in 0.1 molal N aN 03 solution. Goethite concentration was 0.935
ggoethitAgsoimion-At the conclusion of the equilibration period, the pH was measured and 30 mL of
solution was extracted from each experiment and the goethite was filtered from each
sample using a Millipore 0.22 p,m filter. The supernatant solution was preserved by
adding several drops of 10% HNO3. Duplication of all experiments revealed an
experimental uncertainty of approximately 5%.
Solutions were analysed for copper using a spectral line of 327.40 nm on a Varian Vista
Pro Axial ICP-AES, with the matrix of blank and standard solutions matched to the
NaCl concentration of experiments. The total adsorption of Cu11 was assumed to be the
Samples were also analysed for Fe; however, any Fe present in the solutions was below
the ICP-AES detection limit of 0.05 mg/kg.
Selected goethite samples were dried and examined using SEM to determine whether
any morphological changes occurred during the experiments. However, no noticeable
changes could be detected and it was assumed no significant dissolution and/or
precipitation occurred in our experiments.
2.2.3 Ionic Strength Effect Experiments
A 5 molal NaCl stock solution was prepared using reagent grade NaCl in a 2 litre poly
propylene flask. The 5 molal solution was diluted to create 50mL aliquots of 4, 3, 2, 1,
0.5, 0.3 and 0.1 molal solutions. The pH of each solution was measured with a Thermo
Orion 290A+ pH Meter and ROSS Sure Flow electrode with an uncertainty of ± 0.02
pH units, calibrated using unaltered commercial pH 3, 7 and 10 buffers.
The pH for each NaCl concentration listed above was calculated using the Pitzer
Equation for determining activity coefficients in PHREEQC. The calculated pH was
subtracted from the measured pH for each NaCl concentration to determine a pH
difference. This pH difference for each NaCl concentration was added to the measured
Chapter 2: Effect of NaCl on Cu11 adsorption onto Goethite
2.3 Results
2.3.1 Cu11 Adsorption onto Goethite in NaNO3 Solutions
Results for the adsorption of Cu11 onto goethite in NaN03 solutions (0.1 molal, 1.0
molal and 3.0 molal) are shown in Figure 2.3 and listed in Appendix A. The
concentration units used to measure adsorption are moles of Cu11 adsorbed per gram of
goethite (mol Cu'Vg goeth). These units provide a true measurement of the
concentration of Cu11 on the mineral surface as opposed to referencing the concentration
of Cull removed from solution (i.e. mol CuadS/L). The concentration of adsorbed copper
increases with increasing pH, as is typical for the sorption of metals (e.g., Dzombak and
Morel, 1990). The concentration of adsorbed copper decreases with increasing NaN03
concentration between 0.1 and 1 molal NaN03 and at pH greater than approximately 5,
whereas between 1 and 3 molal NaN03 there is no discernible difference in the amount
of copper adsorbed (Figure 2.3 and Figure 2.4). The precipitation of Cu(OH)2(s) did not
occur in any adsorption experiments. At pH 6, where Cu(OH)2(s) precipitation is likely
to occur, the concentration of dissolved Cu11 was less than the initial concentration of
1.102 x 10‘4 due to Cu11 adsorption onto goethite at pH 6. To test this, Cu(OH)2(s) was
precipitated in a solution with 0.075 g goethite with an initial Cu11 concentration of 4.72
x 104 molal. When plotted the adsorption curve was did not behave in the same
systematic way observed in adsorption experiments as all dissolved Cu" was removed
from solution at pH 6.2.
The results of the 0.1 molal NaN03 experiments were compared with those of
Balistrieri and Murray (1982), Ali and Dzombak (1996) and Kooner (1992) and
goethite concentrations, surface area of goethite and dissolved Cu11 concentrations the
distribution coefficient (Kd) was applied:
K d =
goeth
Cudiss (2.1)
Cuads is the difference between the initial and final concentration of Cu" in each
experiment, Wsoin is the total mass of solution (kg; excluding goethite), Wgoeth is the
mass of goethite in each experiment (kg), As is the measured surface area of goethite
(m2/kg) and CudiSS is the measured concentration of dissolved copper (molal).
Kd values versus pH are illustrated in Figure 2.5. Most of the data fall within one order
of magnitude at a given pH. The scatter is most likely due to variations in the
characteristics of goethite, such as crystal morphology, surface area and site densities.
For instance, the site density is different for different crystal faces of goethite (e.g.,
Lützenkirchen et al., 2002; 3.03 FeO sites/nm2 on (101) and 7.19 sites on (100),
Peacock and Sherman, 2004) so if the synthetic goethite in different studies had
different morphologies the available sorption sites would be likely to differ.
Unfortunately, morphologies and surface areas were not recorded for all studies, so the
effect can not be established. In addition, the presence of atmospheric C02(g) can
inhibit metal adsorption on goethite (Zeltner and Anderson, 1988), but all of the
datasets presented here had the atmosphere controlled so as to minimise the
Chapter 2: Effect o f NaCl on Cu" adsorption onto Goethite
1.2x10'*
1.0 molal NaNO,
25°C
8.0x10 s i 6.0x10 s
-I
3 4 0x10 s 2.0x10 s -0.1 molal NaNO.
25°C
1 0x10"*
E. 6 0x10s u 4 0 x 1 0 s
0.1 molal N a N 0 3
25°C
1.2x10'* SOCu*
”" l 6 0x10 s 6 0 x1 0 s 4 0x10 s 2.0x10 s
1 0x10*
SOCu* 8 0x10 s
6,0x10s
4.0x10 s
2.0x10s
-1 6x-10s 1 4x10* 1 2x10s I 10 x10s <2 8 0x10s
1
</) 6 0x10s
5 ,
4 0x10 2 0x10s
0.1 molal NaNO,
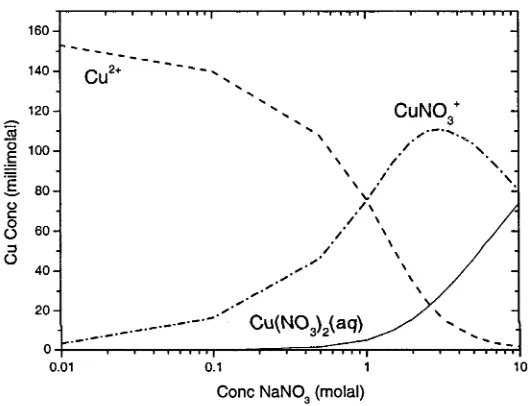
1 1 Cu2* . Cu(OH)2aq '
N i /
-CuN O* »— i— 1— i— 1— i— '— r
i
i> L \
'Cu(OH)2aq . 1.0 molal NaNO,
1 1 0 x10s - 8 8 0x10s
[image:32.523.68.465.71.531.2]-CuOH*
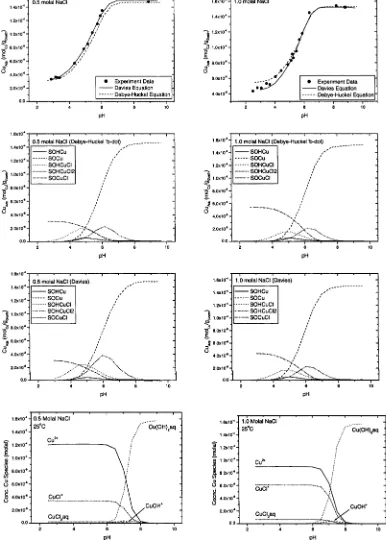
Figure 2.3: (a) Adsorption o f Cu" onto goethite at 25°C and 1 atmosphere as a function o f pH for 0.1, and 1.0 molal N a N 0 3. Initial Cu11 concentration was 1.102 x 10‘4 molal and the goethite
concentration was 0.935 g goethite per kg solution. Solid line is the CCM fit for each
individual experiment at a fixed N a N 0 3 concentration, (b) Calclated surface species using the
CCM for 0.1 and 1.0 molal N a N 0 3. (c) Calculated aqueous speciation o f Cu11 in 0.1 and 1.0
molal N a N 0 3. A ctiv ity coefficients were calculated with the Davies Equation. Values for the
fitted log K with the CCM are shown in Table 2.3 and the assumptions made in the CCM are
a
b
c
Figure 2.3 (continued): (a) Adsorption of Cu11 onto goethite at 25°C and 1 atmosphere as a function of pH for 3.0 molal NaN03. Initial Cu11 concentration was 1.102 x 10‘4 molal and the goethite
concentration was 0.935 g goethite per kg solution. Solid line is the CCM fit for each
individual experiment at a fixed NaN03 concentration, (b) Calculated surface species using
the CCM for 3.0 molal NaN03. (c) Calculated aqueous speciation of Cu11 in 0.1 and 1.0 molal NaN03. Activity coefficients were calculated with the Davies Equation. Values for the fitted
log K with the CCM are shown in Table 2.3 and the assumptions made in the CCM are
[image:33.523.159.361.66.531.2]Chapter 2: Effect of NaCl on Cu" adsorption onto Goethite
1.2x1 O'4
1.0x10⁴
8.0x10s
I &
05 I 6.0x10 s
1
O 4.0x10 s2.0x10 s
0.0
2 4 6 8 10
PH
Figure 2.4: Adsorption of Cu11 in 0.1, 1 and 3.0 molal NaN03 onto goethite at 25°C and 1 atmosphere as a function of pH for 3.0 molal NaN03. Initial Cu11 concentration was 1.102 x 10'4 molal and
the goethite concentration was 0.935 g goethite per kg solution.
Another important aspect of experimental design is the time necessary for equilibration.
The experiments conducted by Peacock and Sherman (2004) were four weeks long,
much longer than the 12-24 hour reaction times of our study and all the other
comparable studies (Table 2.1; Figure 2.5), but did not present evidence for needing
longer run durations. In this study it was demonstrated that a constant adsorbed copper
concentration was reached within 3-4 hours (Figure 2.2) and all the experiments were
run overnight for approximately 16 hours to ensure equilibrium was achieved. Peacock
and Sherman (2004) measured higher concentrations of adsorbed Cu than found in the
experiments of this study and it is possible that their solid materials were dissolving and
re-precipitating, and therefore changing the surface area and/or site density, and/or that
processes other than adsorption were operating in their experiments, such as copper
diffusion into goethite (e.g., Manceau et al., 2000). In any case, there is not enough
A 0.1 m NaN03 □ 1.0 m NaN03 • 3.0 m NaN03 25°C
A □
A D * □
[image:34.523.122.398.81.288.2]information to assess what processes were operating in their experiments, or understand
the differences in the results of the two studies.
*+ o
Figure 2.5: Comparison of Cu" adsorption onto goethite at 25°C and 1 atmosphere in 0.1 M NaNÜ3.
Symbols represent the following studies: • Current study; □ Peacock and Sherman (2004) 3.3
g/L goethite, 393pM Cu"; O Ali and Dzombak (1996) 1.6 g/L goethite, 2.3pM Cu"; & Kooner
(1992) 0.6 g/L goethite, 157 pM Cu"; 0 Kooner, (1992) 0.6 g/L goethite, 78 pM Cu"; O
Kooner (1992) 5.5 g/L goethite, 78 pM Cu"; + Balistrieri and Murray (1982) 0.55 g/L
goethite, 0.32 pM Cu"; X! Balistrieri and Murray (1982) 0.55 g/L goethite, 1.8 pM Cu"; X
Balistrieri and Murray (1982) 0.55 g/L goethite, 31 p/L Cu".
2.3.1.1 Quantitative interpretation
Surface complexation modelling is commonly used to interpret adsorption experimental
data and predict surface species (e.g., Sahai and Sverjensky, 1997a). In this section, the
Chapter 2: Effect of NaCl on Cu11 adsorption onto Goethite
complexes were selected. The process used to fit the model to the experimental data is
also described.
In order to determine the reactions controlling copper adsorption in NaNC>3 solutions,
the simplest likely surface complexes of copper, e.g., Peacock and Sherman (2004;
Equations 10 and 11 in their Table 3) are shown in Equations 2.2 and 2.3.
=SOH(a<fe) + Cu 2*(aq) = =SOHCu2+M s ) (2.2)
= S O H (a* ) + Cu 2*(aq) = =SOCu+(a<fe) + H+(o<?) (2.3)
and their associated equilibrium constants are:
K = a=soHCu2*— (2.4)
a = SO Ha Cu2+
— ^=SOCu* a H*
a =SOHa Cu2+
(2.5)
“=S” in these equations is a cation at a surface adsorption site. By plotting log[Cu]Ads -
log[Cu]oiss versus pH, where [Cu]Ads is the total concentration of adsorbed Cu11, [CuJoiss
is the total concentration of dissolved C u11 and for the purpose of this analysis it is
assumed that =SOH is the total number of available adsorption sites. Note that Equation
2.2 is independent of pH and that we assume no activity coefficient effects at this stage.
The effect of pH in these experiments is shown in Figure 2.6, where best-fit lines show
slopes of 0.94 for 0.1 molal NaNC>3, 0.56 for 1.0 molal NaNC>3 and 0.76 for 3.0 molal
NaNC>3. The slopes between 0 and 1 indicate that both reactions were operating in the
(cf., Peacock and Sherman, 2004), although it cannot be determined if they were present
from the calculated slopes in Figure 2.6 alone; however these and other species are
considered in the following section on fitting equilibrium constants to the experimental
data.
y=0.94-3.30 (•2=0.98
0.1 m NaN03
• .
/
1.0 m NaNO,
y=0.56x-3.30 r2 = 0.99
J
o - n
g
I d o
S’
_1 'i
d ., g
—I
-2
3 4 5 6 7 8
[image:37.523.170.367.163.678.2]pH
Figure 2.6: Log[C u]Ads - log[C u]Diss versus pH showing Cu" adsorption onto goethite in different concentrations o f N a N 0 3. Experimental data are listed in Appendix A. The slopes o f the linear
regression lines indicate the stoichiometry o f dominant adsorption reactions and corresponding
copper surface complexes. 3.0 m NaN03
Chapter 2: Effect of NaCl on Cu" adsorption onto Goethite
2.3.1.2 Surface Complexation Modelling
In a heterogeneous multicomponent system, any thermochemical interpretation requires
the identification of the dissolved and surface species that are present. The minimum
number of reactions that need be considered include protonation and deprotonation
reactions at the surface attachment sites and reactions describing the formation of each
dissolved or adsorbed species. Equilibrium constants need to be known or determined
for all of these reactions. The molal units (moles of solute per kilogram of H2O),
typically used to describe concentrations in the liquid, can also be used to express
concentrations of surface species if the number of surface attachment sites per mass of
H20(/) is known. In order to determine this, it requires knowledge of the mass of solid
per mass of H20(/), the specific surface area of the solid, and the density of attachment
sites on the solid surface.
Several physical models have been used to describe the changes in the structure of the
liquid near the solid surface, and have implications for the total surface charge, the
charge distribution and electrostatic potential in the liquid, and hence the activity
coefficients of charged species in the vicinity of the surface (Dzombak and Morel,
1990). The interfacial structure models commonly applied to adsorption data include the
constant capacitance model (CCM), diffuse layer model (DLM) and triple layer model
(TLM) (Sposito, 1984; Davis and Kent, 1990; Dzombak and Morel 1990; Gunneriusson
et al, 1994; Lumsdon and Evans, 1994; Ali and Dzombak, 1996; Sahai and Sverjensky
1997a; Peacock and Sherman, 2004). Each of these models is a progressively more
complex description of the electrostatic behaviour near the mineral surface, and we
descriptions, refer to Sposito (1984), Davis and Kent (1990) and Dzombak and Morel
(1990).
The CCM, DLM and TLM are all based on the assumptions that the surface is
effectively flat, infinite, and has an electrical charge that is a product of adsorption
reactions (Dzombak and Morel, 1990). Positive and negative species in the solution
experience an electric field due to the surface, and are accordingly attracted and repelled
so as to balance the surface charge. This produces a “diffuse layer” in the liquid
adjacent to the surface in which the electrical potential of the surface falls away to zero.
The three models differ in how they describe the decrease of the potential with distance
away from the surface.
The simplest model, the CCM, assumes linear variation of potential with distance away
from the surface (cf., Davis and Kent, 1990). In other words, it assumes that there is
effectively a constant capacitance in the boundary layer of the solution. This
capacitance value is a fittable parameter. The “surface” is assumed to include strongly
bound adsorbed species. In the DLM, the differential equation relating electric field and
potential through the diffuse layer is solved, assuming that the local charge imbalance
between positive and negative species obeys Boltzmann statistics (cf., Davis and Kent,
1990) and capacitance is no longer an independently fittable parameter. At the limit of
low surface charge and low potential, the DLM behaves like a CCM. A more complex
version of the DLM is the Stem model, in which the thin layer of strongly chemisorbed
species is separated as a distinct constant capacitance layer between the surface proper
and the diffuse layer. The TLM generalises this approach, and has two constant
Chapter 2: Effect of NaCl on Cu11 adsorption onto Goethite
TLM is more complex than the other models because it includes an additional surface
layer to account for the weaker adsorption of large ionic species such as alkali earth
cations (e.g., Langmuir, 1997). In this case, there are two capacitances that can be fit to
experimental data, although in practice the capacitance of the outer layer is typically set
to a constant value (e.g., Yates, 1975; Sahai and Sverjensky, 1997).
The Constant Capacitance Model was chosen because it was found to be the simplest
model that could be fit to most of the data. Furthermore, the CCM is appropriate where
the mineral surface has a low surface charge or the solution is of high ionic strength and
the diffuse layer is compressed close to the mineral surface (Barrow et al., 1982; Davis
and Kent, 1990) such as the conditions of our experiments. Details of the reactions and
fit parameters necessary in the CCM are described below.
The formation of charged surface sites provides the sites for metal sorption and they are
represented by the following reactions:
=SOH( ads) + H+(aq) = =SOH2+(ads) (2.6)
=SO'(ads) + H+(aq) = =SOH(aüfc) (2.7)
Their apparent equilibrium constants expressed as concentrations are:
(2.8)
J f a p p _ a = S O H
The activity of H+ is assumed to change as a function of distance from the mineral
surface, due to the effect of the surface charge (Dzombak and Morel, 1990). Therefore,
the addition of a coulombic “correction factor” is introduced for the activity of each
adsorbed species of charge z and is multiplied by exp(-zF^/RT):
K1int a =SOH,
a = S O H a H *
f exp
V
- z F y / o RT
\
J
(2.10)K2int
l =SOH
a =SO~a H *
f exp
V
- z F y / o RT
\
J
(2.11)where y/G is the electrical potential (V) at the surface, F is the Faraday constant (96487
C/mol), R is the universal gas constant (8.314 J K'Vmol) and T is temperature in Kelvin.
The chosen standard state is a hypothetical 1 molal for the adsorbed species and zero
surface potential (i.e. Sahai and Sverjensky, 1997).
In the CCM the electrical potential is calculated assuming a constant capacitance:
(2.12)
Where o () is the charge of the solid surface (Coulombs) and C is the constant
capacitance (F/m2; Davis and Kent, 1990). The reactions and associated equilibrium
constants for the metal complexes are treated in the same way, and the specific
Chapter 2: Effect of NaCl on Cu" adsorption onto Goethite
2.3.1.3 Surface Site Density
Surface site density is a necessary parameter in surface complexation models for
determining the concentration of =SOH (Equations 2 to 9), but it is difficult to estimate
accurately. The difficulty results from uncertainty in the nature of these sites with a
number of different types of sites (e.g., singly, doubly and possibly triply coordinated
oxygens for protonation/deprotonation reactions on various crystal planes; Peacock and
Sherman, 2004), the nature of the surface (e.g., surface roughness and surface edges
(Body et al., 2000; Gaboriaud and Ehrhardt, 2003), the dependence on ionic strength,
the type of electrolytes and the methods used to measure site densities (cf.,
Lützenkirchen et al., 2002; Peacock and Sherman, 2004). Another complicating factor
is that site densities for goethite are different for different crystal planes, e.g., 3.03 FeO
sites/nm2 on (101) and 7.19 sites on (100); Peacock and Sherman, 2004), which implies
that different morphologies of goethite will have different average site densities. It is
also possible that the nature and number of sites available are different for cations or
anions of different properties, such as the very small hydrogen ion. Existing estimates
for goethite site density show more than an order of magnitude difference (Table 2.2).
Potentiometrie titration methods have resulted in values between 1.7 and 2.7 sites/nm2
(Table 2.2), whereas tritium exchange measurements resulted in 16.4 site/nm (Yates,
1975). Molecular statics calculations are close to the latter measurement, where they
indicate a value between 15 and 16 sites/nm2 (Rustad, 1996). Potentiometrie methods
are likely to underestimate the site density because they are susceptible to interferences
from CO2 (which adsorbs strongly to goethite surfaces, and limits the sites available for
acid-base reactions during titration; Zeltner and Anderson, 1988) and they are done at
goethite to ensure proton saturation (Lützenkirchen et al., 2002), which can result in
large errors because the acidity of the solutions implies that the titrations are measuring
small changes in big numbers (Dzombak and Morel, 1990; Lützenkirchen et al., 2002).
Table 2. 2: Published surface areas, site densities and protonation (Ki‘nI) and deprotonation (K2‘nt) reactions for goethite.
Author Calculation Method
Surface Area
(m2/g)
Surface Site Density
(sites/nm2) Log
nr
1 Log K2intAli and Dzombak (1996) Titration 79.4 1.4 7.68 -8.32
Gao and Mucci (2001) Titration 27.7 1.8 7.45 -9.6
Lövgren et al. (1993) Titration 39.9 1.7 7.47 -9.51
Lumsdon and Evans (1994) Titration 86 2.74 7.52 -10.63
Missana et al. (2003) Titration 35 2.2 7.2 -10.0
Peacock and Sherman (2004) Titration 32.7 6.02 7.5 -9.5
Rustad (1996) Molecular Statics - 15-16 -
-Van Geen et al. (1994) Titration 45 2.3 7.91 -10.02
Yates (1975) Tritium Exchange - 16.4 4.2 -10.8
Given the uncertainty in the site density estimates, the adsorption of copper on our
synthetic goethite was measured by varying the goethite/solution ratio in a series of 5
experiments at pH = 5.5 (Figure 2.7) in an attempt to measure the maximum copper
adsorption. Results show that copper occupies 14 sites/nm2. This estimate is likely to be
a minimum value as the maximum concentration of adsorbed copper in our experiments
may not have been achieved. Our value is in good agreement with the results of the
tritium exchange experiments of Yates (1975) and the molecular statics calculations of
Rustad (1996), so we choose the site density of 16.4 sites/nm2 estimated by Yates
(1975). Sahai and Sverjensky (1997a) made the same choice; however, in contrast,
Peacock and Sherman (2004) chose a value of 7.5 sites/nm2 as proposed by Venema et
al. (1998). In any case, choosing different values of site density did not affect the
conclusions about the nature of surface complexation and the reactions present in the


![Figure 2.6: Log[Cu]Ads - log[Cu]Diss versus pH showing Cu" adsorption onto goethite in different](https://thumb-us.123doks.com/thumbv2/123dok_us/1913776.150070/37.523.170.367.163.678/figure-log-diss-versus-showing-adsorption-goethite-different.webp)