This is a repository copy of
Heat mapping for district heating
.
White Rose Research Online URL for this paper:
http://eprints.whiterose.ac.uk/142999/
Version: Published Version
Proceedings Paper:
Brocklebank, I., Styring, P. orcid.org/0000-0002-8434-7356 and Beck, S.
orcid.org/0000-0003-2673-4179 (2018) Heat mapping for district heating. In: Energy
Procedia. 3rd Annual Conference in Energy Storage and Its Applications, 3rd
CDT-ESA-AC, 11-12 Sep 2018, Sheffield, UK. Elsevier , pp. 47-51.
https://doi.org/10.1016/j.egypro.2018.09.025
© 2018 Elsevier Ltd. Uploaded in accordance with the publisher's self-archiving policy.
Article available under the terms of the Creative Commons Attribution Licence
(http://creativecommons.org/licenses/by/4.0).
[email protected] https://eprints.whiterose.ac.uk/
Reuse
This article is distributed under the terms of the Creative Commons Attribution (CC BY) licence. This licence allows you to distribute, remix, tweak, and build upon the work, even commercially, as long as you credit the authors for the original work. More information and the full terms of the licence here:
https://creativecommons.org/licenses/
Takedown
If you consider content in White Rose Research Online to be in breach of UK law, please notify us by
ScienceDirect
Available online at www.sciencedirect.com
www.elsevier.com/locate/procedia
ć
Energy Procedia 151 (2018) 47–51
1876-6102 Copyright © 2018 Elsevier Ltd. All rights reserved.
Selection and peer-review under responsibility of the 3rd Annual Conference in Energy Storage and Its Applications, 3rd CDT-ESA-AC. 10.1016/j.egypro.2018.09.025
Copyright © 2018 Elsevier Ltd. All rights reserved.
Selection and peer-review under responsibility of the 3rd Annual Conference in Energy Storage and Its Applications, 3rd CDT-ESA-AC.
Keywords: District heating; energy mapping; heat demand; feasibility; geographical information services
1.Introduction
District heating (DH) is an alternative to the incumbent UK heating technologies of individual, natural gas fired, boilers. A district heating network (DHN) is comprised of three elements: a thermal energy generating unit (or units), the pipe network and substations that connect the network to the customer buildings [1]. The major advantage of district heating is that, through the economies of scale and supply, a DHN can utilize thermal energy sources that may not be economically viable on an individual scale. Examples of thermal energy sources that can be utilized by DH are: excess heat from industry, energy from waste incineration and combined heat and power [2]. In addition, DH is both flexible and secure and can use local thermal energy sources, providing money to the local economy [1].
In the UK, DH implementation is low, accounting for only 2% of the total countries energy supply [3]. A reason for the low implementation of DH is through the high costs of installation. The operation and installation of a DHN should be led by the local authority, who tend to lack in house engineering experience [4]. The lack of in house
S
D
3rd Annual Conference in Energy Storage and Its Applications, 3rd CDT-ESA-AC,
11
–
12 September 2018, Sheffield, UK
Heat mapping for district heating
Ian Brocklebank
a, Peter Styring
a*, Stephen Beck
baDepartment of Chemical and Biological Engineering, Sir Robert Hadfield Building, Sheffield, S1 3JD, England bDepartment of Mechanical Engineering, The Diamond, Sheffield, S3 7RD, England
Abstract
If the UK wishes to decarbonise its energy supply, it should consider a wider uptake of district heating. Currently, district heating
48 Ian Brocklebank et al. / Energy Procedia 151 (2018) 47–51
engineering experience means that local authorities must employ expensive engineering consultancies to assess the viability of a new network, a cost that in some cases may be prohibitive. A simple model of DH feasibility that can be utilized by a non-technical individual will allow for more potential DHNs to be considered and therefore for more DHNs to be installed. This paper investigates the initial stage of a simple model of DH feasibility, estimating the local area energy demand.
An estimation of the local area energy demand allows for a quick comparison to be made between the local area heat demand density and the minimum heat demand density, of 3 MW/ km2, that the UK government advise for
profitable DH [5]. The heat demand estimation is also used to identify possible anchor loads. Anchor loads are customers with a high, constant and stable heat demands that are vital to the business case of a new DHN and are used to determine the network route [6]. The heat demand estimation can be done using one of a variety of techniques: questionnaires, thermal imaging, remote sensing or geographical information services (GIS), otherwise called heat mapping [7]. Questionnaires are highly accurate for individual buildings but are only accurate across a large area if the response rate is high; the overall questionnaire process is time consuming and expensive [7]. Remote sensing and thermal imaging are both highly accurate and quick but are very expensive [7]. GIS mapping is widely used, proven to be affordable, quick and accurate [7-12].
The aim of this paper is to investigate the heat mapping process for district heating. Heat maps of the case study are generated and compared to existing maps to assess the accuracy of the heat mapping process.
2.Methodology
The heat mapping was done by combining techniques presented by the following sources: Parsons Brinckerhoff [13], the Chartered Institution of Building Services Engineers(CIBSE) [14], the Energy Information Administration (EIA) [15], the UK Energy Research Centre (UK ERC) [17] and Finney et al. [7]. The heat mapping was split into two areas: commercial heat mapping, to identify anchor loads and domestic heat mapping, to estimate the heat demand density.
The domestic heat mapping used the technique outlined by Finney et al. [7]. UK census data was obtained [17], giving the population density of the case study area. The population density was converted into energy and power density using the UK ERC study as well as several assumptions. It was assumed that: the average number of people living in a dwelling was 2.37, the average UK dwelling heat usage is 20.5 MWh per year and that the average UK dwelling was heated for 3,000 hours per year.
The commercial heat mapping used the techniques outlined by Parsons Brinckerhoff [13]. Googles Maps and Google Street View were used to identify the commercial buildings in the case study area, noting the following: building type, building location and total building floor area. The CIBSE energy benchmarks TM 46 [14] gave the typical fossil fuel energy use of archetype building categories (in kWh/ m2). The EIA commercial buildings energy
consumption study split the total energy use of archetype buildings into the individual uses. The UK ERC carbon trust advanced metering trial gave a ratio of energy to power usage for archetype buildings. Combing the three studies estimated the energy and power usage for heating purposes of archetype buildings in kWh/ m2 and kW/ m2. When
combined with the total floor area noted of each building in the case study area, the estimated energy and power usage for each commercial building in the case study area were calculated.
The methodology used relied on several assumptions and techniques that may bring inaccuracy into the work. Normally, an engineering study would strive to minimize and quantify any inaccuracies in the work. The purpose of heat mapping is not to accurately model the heat demand in the local area but to quickly estimate the heat demand in the area; therefore, inaccuracies could be tolerated. The validity of the work was assessed by comparing the results to that of similar work produced by the UK government [18].
3.Case study
site with a population of at least 1,000. The towns identified were: Darley Dale, Matlock, Rowsley, Bakewell, Youlgreave, Cromford and Matlock Bath.
4.Results
A domestic buildings heat map was generated for the towns of Darley Dale, Matlock, Rowsley, Bakewell, Youlgreave, Cromford and Matlock Bath as shown in Fig. 1.
[image:4.544.173.385.163.338.2]`
Fig. 1. Domestic heat users in the case study area.
Fig. 1 shows that the towns of Bakewell, Darley Dale and Matlock have large areas with heating power densities of greater than 3 MW/ km2 and the towns of Rowsley, Youlgreave, Cromford and Matlock Bath do not. As only
Bakewell, Darley Dale and Matlock have large areas with power densities higher than the profitable level advised by the UK government, the potential new DHN should be focused there and there only.
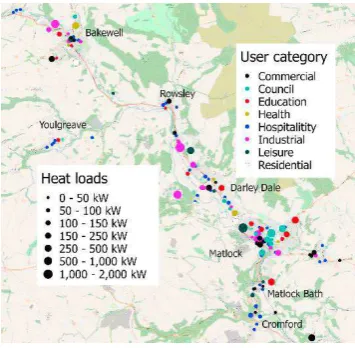
[image:4.544.201.379.461.635.2]A commercial buildings heat map was generated for the towns of Darley Dale, Matlock, Rowsley, Bakewell, Youlgreave, Cromford and Matlock Bath as shown in Fig. 2.
50 Ian Brocklebank et al. / Energy Procedia 151 (2018) 47–51
[image:5.544.34.511.119.177.2]Fig. 2 shows that the largest concentration of large commercial heat customers are found in Bakewell, Darley Dale and Matlock. The yearly energy use for heat, average power demand and peak power demands are shown in Table 1.
Table 1. Energy and power demand of the large commercial heat customers found in Bakewell, Darley Dale and Matlock.
Location Annual energy use for heating (MWh) Average power demand for heating (MW) Peak power demand for heating (MW)
Matlock 24,000 7.4 25
Darley Dale 4,100 1.6 4.8
Bakewell 9,000 2.8 7.4
Table 1 and Fig. 2 show that, from an industrial heat user perspective, the focus of a new district heating network should be on Bakewell, Matlock and Darley Dale. Table 1 and Fig. 2 support the findings of Fig. 1 proving that the design should be on Bakewell, Matlock and Darley Dale. It is worth noting that the work done thus far does not prove that a DHN would be profitable for HJ Enthoven but that it is worth further consideration.
Once the methodology outlined in this paper has been generated, repeating the work for a different case study would be very quick and is simple enough that the work could be done by a non-technical individual at a local authority. The quick and simple methodology would allow a local authority to assess their own potential for a new DHN without having to employ and pay an engineering consultancy. Making the assessment quicker and cheaper will encourage more local authorities to assess the feasibility of DHNs in their locale, encouraging more DHNs to be assessed and therefore more DHNs to be installed.
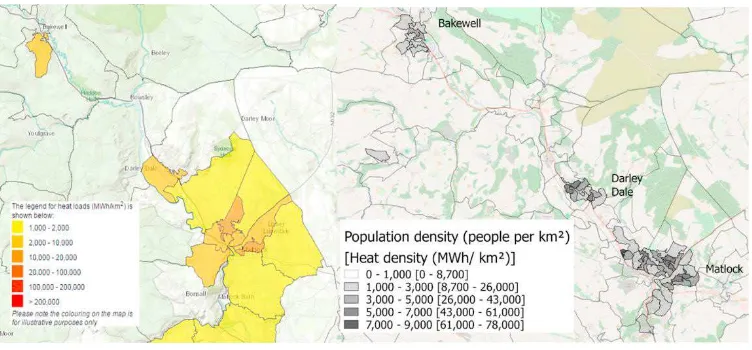
Before the heat mapping methodology is sent out for use by local authorities, it would be prudent to assess the accuracy of the methodology. The UK government publish a CHP development map that shows the energy density of the country. The UK CHP development is shown and compared to the heat mapping produced in Fig. 3.
Fig. 3. (a) UK CHP development map (b) Domestic heat users in the case study area.
In Fig. 3, the energy density needed for profitable DH is roughly 9 MWh/ km2. The UK CHP development map
shows, similarly to Fig. 1 that the areas of profitable DH are located exclusively in Matlock, Bakewell and Darley Dale. The agreement between the new mapping technique and the established mapping technique developed by the government proves that, for the purposes of heat demand assessment, the heat mapping technique presented in this paper is accurate enough for use.
5.Conclusion
[image:5.544.91.467.347.522.2]found that the only areas in the case study with a heat power density large enough to be considered profitable for DH by the UK Government is Matlock, Bakewell and Darley Dale. The commercial heat demand assessment found that the areas of Matlock, Bakewell and Darley Dale have large concentrations of large commercial heat customers which can act as anchor loads for the DHN. When combining the two types of assessment, it is shown that future design work for the case study DHN should focus on the areas of Matlock, Bakewell and Darley Dale. The heat mapping methodology developed in this paper is compared to existing mapping methodology generated by the UK Government. The UK Government heat mapping also finds that the only areas in the case study with a sufficient heat demand density to be profitable for DH is Bakewell, Matlock and Darley Dale. The agreement between the two mapping techniques shows that the mapping technique presented in this paper is suitable for future heat demand assessment.
6.Acknowledgements
We gratefully acknowledge the Engineering and Physical Sciences Research Council (EPSRC) for funding a CDT Studentship to IB under the Centre for Doctoral Training in Energy Storage and its Applications (EP/L016818/1). IB is grateful to Robin Idle, H.J. Enthoven and Sons for their advice and experience in the local area.
7.References
[1] Frederiksen, Svend, and Werner, Sven. "District heating and cooling." District heating and cooling (2013), 9789144085302. [2] Sipilä, Kari. “District heating for energy efficient building areas”. IEA DHC/ CHP Annex IX (2011) Paris, France: IEA.
[3] Department of Energy and Climate Change. “Investing in the UK’s heat infrastructure: Heat networks”. (2015), Department of Energy and Climate Change, London, England.
[4] Hawkey, David, Webb, Janette, and Winskel, Mark. “Organisation and governance of urban energy systems: district heating and cooling in the
UK” Journal of cleaner production 50 (2013): 22-31, dio: 10.1016/j.jclepro.2012.11.018.
[5] Department of Energy and Climate Change. “Heat and energy saving strategy: consultation”. (2009), Department of Energy and Climate Change, London, England.
[6] Hawkey, David. “Will “district heating come to town”? Analysis of current opportunities and challenges in the UK”. (2009), MSc, University of Endinburgh, Edinburgh, United Kingdom.
[7] Finney, Karren, Sharifi, Vida, Swithenbank, Jim, Nolan, Andy, White, Simon, and Ogden, Simon. “Developments to an existing city-wide district energy network – Part I: Identification of potential expansions using heat mapping”. Energy Conversion and Management 62 (2012): 165-175, 10.1016/j.enconman.2012.03.006.
[8] Bhatt, M. Siddhartha. “Mapping of General Combined Heat and Power Systems”. Energy Conversion and Management 42 (2001): 115-124, 10.1016/S0196-8904(00)00045-5.
[9] Möller, Bernd. “A heat atlas for demand and supply management in Denmark”. Management of Environmental Quality: An International Journal 19(4) (2008): 467-479, 10.1108/14777830810878650.
[10] Möller, Bernd, Lund, Henrik. “Conversion of individual natural gas to district heating: Geographical studies of supply costs and consequences for the Danish energy system”. Applied Energy 87(6) (2010): 1846-1857, 10.1016/j.apenergy.2009.12.001.
[11] Girardin, Luc, Marechal, François, Dubuis, Matthias, Calme-Darbellay, Nicole, and Favrat, Daniel. “EnerGis: A geographical information based system for the evaluation of integrated energy conversion systems in urban areas”. Energy 35(2) (2010): 830-840, 10.1016/j.energy.2009.08.018.
[12] Schillings, Christoph, Simon, Sonja. “Chapter 8 - The Potential for District Heating Based on Renewable Energy – A Spatial Analysis”. (2011), in Kronenburg, T, Kuckshinrichs, W: Demography and Infrastructure, 9789400704589.
[13] Parson Brinckerhoff. “A District Heating Utility for the Tees Valley: Study into the strategic use of waste heat and supply of private sector customers”. (2011), Parson Brinckerhoff, London, England.
[14] Chartered Institute of Building Services Engineers. “Energy benchmarks TM46: 2008”. (2008), Chartered Institute of Building Services Engineers, London, England.
[15] Energy Information Administration. “Commercial Buildings Energy Consumption Study”. (2013), Energy Information Administration, Washington, USA.
[16] United Kingdom Energy Research Centre. “Carbon Trust Advanced Metering Trial (2004-2006)”. (2006), United Kingdom Energy Research Centre, London, England.
[17] Office for National Statistics “QS102EW - Population density”. (2011), Office for National Statistics, London, England.
[18] Department of Energy and Climate Change. “UK CHP Development Map”. (n.d.), Department of Energy and Climate Change, London, England.