Contents lists available atScienceDirect
Environmental Science and Policy
journal homepage:www.elsevier.com/locate/envsci
A global network for operational
fl
ood risk reduction
Lorenzo Al
fi
eri
a,⁎, Sagy Cohen
b, John Galantowicz
c, Guy J-P. Schumann
d,e, Mark A. Trigg
f,
Ervin Zsoter
g, Christel Prudhomme
g,h,i, Andrew Kruczkiewicz
j,k, Erin Coughlan de Perez
j,k,l,
Zachary Flamig
m, Roberto Rudari
n, Huan Wu
o,p, Robert F. Adler
q, Robert G. Brakenridge
r,
Albert Kettner
r, Albrecht Weerts
s,t, Patrick Matgen
u, Saiful A.K.M Islam
v, Tom de Groeve
a,
Peter Salamon
aaEuropean Commission, Joint Research Centre, Italy bUniversity of Alabama, USA
cAtmospheric and Environmental Research, USA dRemote Sensing Solutions Inc., USA eUniversity of Bristol, UK fUniversity of Leeds, UK
gEuropean Centre for Medium-range Weather Forecast, UK hCentre for Ecology and Hydrology, UK
iLoughborough University, UK jColumbia University, USA
kRed Cross Red Crescent Climate Centre, Netherlands lVU University Amsterdam, Netherlands
mUniversity of Chicago, USA nCIMA Research Foundation, Italy
oGuangdong Province Key Laboratory for Climate Change and Natural Disaster Studies, China pSun Yat-sen University, China
qNASA Goddard Space Flight Center, USA rUniversity of Colorado, USA
sDeltares, Netherlands
tWageningen University and Research Centre, Netherlands uLuxembourg Institute of Science and Technology, Luxembourg vBangladesh University of Engineering and Technology, Bangladesh
A R T I C L E I N F O
Keywords:
Globalflood partnership (GFP) Disaster risk management Satellite remote sensing Flood monitoring Early warning systems
A B S T R A C T
Every year riverineflooding affects millions of people in developing countries, due to the large population exposure in thefloodplains and the lack of adequateflood protection measures. Preparedness and monitoring are effective ways to reduceflood risk. State-of-the-art technologies relying on satellite remote sensing as well as numerical hydrological and weather predictions can detect and monitor severeflood events at a global scale. This paper describes the emerging role of the Global Flood Partnership (GFP), a global network of scientists, users, private and public organizations active in globalflood risk management. Currently, a number of GFP member institutes regularly share results from their experimental products, developed to predict and monitor where and whenflooding is taking place in near real-time. GFPflood products have already been used on several occasions by national environmental agencies and humanitarian organizations to support emergency operations and to reduce the overall socio-economic impacts of disasters. This paper describes a range of globalflood products developed by GFP partners, and how these provide complementary information to support and improve current globalflood risk management for large scale catastrophes. We also discuss existing challenges and ways forward to turn current experimental products into an integratedflood risk management platform to improve rapid access toflood information and increase resilience toflood events at global scale.
https://doi.org/10.1016/j.envsci.2018.03.014
Received 13 December 2017; Received in revised form 14 March 2018; Accepted 14 March 2018 ⁎Corresponding author.
E-mail address:Lorenzo.Alfieri@ec.europa.eu(L. Alfieri).
Available online 22 March 2018
1. Introduction
Riverine flooding affects the vast majority of the world’s regions. Flood risk has considerable spatial variability, due to heterogeneous natural processes, varied exposure and vulnerability toflooding, and to each country’s or region’s investments inflood preparedness and miti-gation.Alfieri et al. (2017)estimated that combinedflood losses in Asia and Africa account for 95% of people annually affected by floods globally and 73% of the total direct economic damage. While flash floods often result in the highest average mortality rates,flooding from large rivers is responsible for the majority of people affected byfloods every year, due to the vast extent of flood prone areas in populated regions (Jonkman, 2005;Pesaresi et al., 2017).
Satellite technologies have progressively changed the way we cope with large scale floods throughout the entire disaster management cycle, from the preparedness to the recovery phase. For example, Numerical Weather Predictions (NWP) have dramatically benefited from satellite data to improve forecast skill over the oceans, in areas poorly covered by conventional measurement networks, and in general to extend their predictability in time and for extreme events (Bouttier and Kelly, 2001). In addition, different sensors mounted on satellites have shown key capabilities in detecting and monitoring surface water extent (Pekel et al., 2016), rivers and lakes height (Alsdorf et al., 2007; Calmant et al., 2008), and large-scaleflooding (Smith, 1997).
Such a wealth of data available in near real-time has prompted re-search groups from many institutions worldwide to develop methods for flood prediction and monitoring at large scales. This also affords economies of scale: regions that might not have otherwise been able to set up local models and observation programs can benefit from the global extent of these products. The potential benefits of these new products include a large variety of new applications for improved dis-aster preparedness and response. However, an immediate consequence is the need to 1) adapt experimental scientific tools for operational emergency activities, and 2) identify the limits of applicability of each tool and its outputs. To this end, the Global Flood Partnership (GFP, https://gfp.jrc.ec.europa.eu) was established as an open international group of academics, research institutes, practitioners, public and pri-vate organizations active in the field of flood risk and emergency management. The core group consists of organizations interested in bridging the gap between science and operations. The goal is to foster the dialogue between scientists and users, whereby 1) scientists adapt their systems to the needs of emergency managers, and 2) emergency managers adapt and adjust existing workflows to include new systems and data. Currently, the GFP includes more than 300 members from 6 continents, registered through a dedicated mailing list. More than 90 organizations were represented during the past annual meetings, which have been held since 2011, while special sessions and side events are
regularly held at other relevant conferences throughout the year. De Groeve et al. (2015)described the launch of the Global Flood Partnership with the aim to improve futureflood management world-wide. They introducedfive main pillars for the GFP to focus on: Flood Service and Toolbox, Flood Observatory, Flood Record, User Guidance and Capacity Building, and User Forum. Since then the GFP has re-ceived increasing attention by engaging more partners, sharingflood products, and through its designation in 2016 as participating organi-zation in the Group on Earth Observations (GEO, http:// earthobservations.org).
This paper illustrates the value of the GFP in supportingflood risk management for large scale disasters by providing access toflood in-formation and working towards closing the gap between availability and use of the information. We describe how a suite of various products and expert knowledge can work in synergy to provide key information at different stages, before, during and after severe floods. So called “GFP activations”consist of the sharing of data and model results re-lated to a specific upcoming or ongoingflood event through the GFP mailing list, which reaches all GFP members. Activations are commonly requested by partner institutes involved in the development of early warning systems, by organizations active in emergency operations, and by end-users responding to the severe events. In the following section, GFP models and products are grouped and described based on their time of availability and the type of information they provide (Fig. 1). In addition, a non-exhaustive list of GFPflood products available for op-erational flood risk reduction is reported in Table S1 of the Supple-mentary material.
2. Models and products
2.1. Early warning systems (EWS)
Early warning systems are developed to predict natural disasters before these occur. They are normally operated at large scales, with updating cycles on the order of hours to days, and variable levels of complexity including purely statistical processing, geophysical model-ling, and forecast-based impact and cost-benefit assessments (see e.g., Emerton et al., 2016). EWS have a crucial role in the disaster risk management cycle as they can trigger flood preparedness actions among humanitarian organizations, emergency responders, and end users in potentially affected areas. Likewise, EWS can activate theflood management cycle within the GFP, and prompt further analysis and products from other member institutes.
[image:2.595.119.476.568.728.2]Consequently, the skill of those systems must be evaluated con-tinuously, to optimize the tradeoffbetween correct predictions, false alarms and missed events. An important element of the evaluation of EWS is defining how these will be deemed to be effective, keeping in
mind their ultimate goal to provide insight to the potential socio-eco-nomic impacts of disasters. The trigger to activateflood preparedness varies from system to system, though it is normally defined by a set of specific criteria, including a predicted variable (e.g., event frequency, peak discharge, river level, potential impact), lead time to the event start/peak, forecast persistence, size of the river basin and probability, uncertainty or confidence of the forecast, amongst others. An ex-planatory example of a trigger is that of the Flash Flood Notifications used in the European Flood Awareness System (EFAS, https://www. efas.eu,Thielen et al., 2009):
“Notifications are issued when the probability of exceeding a 20 year return period (magnitude) of the surface runoff index (predicted variable) is forecasted to be larger than 35%(probability) and the forecasted start of the event is < 72 h(lead time)in a region for which an EFAS partner exists(location).”
EWS use NWP as their main dynamic input. These inputs can be in the form of deterministic predictions, allowing higher temporal and spatial resolution, or ensemble NWP, especially in the medium range, to assess the confidence of the forecasts (Molteni et al., 1996;Adams and Pagano, 2016). EWS can be further classified into; a) extreme weather forecasts (EWF), and b)flood early warning systems (FEWS), depending on the system complexity and on the variable used forflood prediction. 2.1.1. Extreme weather forecasts (EWF)
EWF are designed to estimate the extremeness of NWP through re-latively simplified relationships, thus informing about the possible oc-currence of natural disasters. For instance, flash floods and riverine floods in temperate and tropical climates can be linked to extreme rainfall accumulations predicted within the forecast range. The ex-tremeness of the event is estimated by comparing the predicted cu-mulated rainfall with its long term statistical distribution, taken from a hindcast dataset or from observed records, to estimate a probability of recurrence in a given year or season.
The main GFP product included in this category is the Extreme Forecast Index (EFI,Lalaurette, 2003;Zsoter et al., 2015), which to-gether with the Shift Of Tail (SOT) index can detect significant devia-tions of the probability distribution of forecasts from the model cli-matology. The European Centre for Medium-range Weather Forecasts (ECMWF) produces operationally the EFI and SOT of rainfall, wind and temperature over various time ranges using their 51-member ensemble prediction system up to 15 days ahead (see example in Fig. S1, in the Supplement).
Complementary information forflood early detection through NWP include cyclone track maps, probability of accumulated rainfall amounts, as well as large scale anomaly index such as the El Niño/La Niña Southern Oscillation. These products are requested by‘user’ or-ganizations within the GFP in order to support decision making. Decisions can include, for example, where and when to take certain actions to decrease impacts for a potential disaster, such as the allo-cation of medical resources and the pre-positioning of response ve-hicles.
2.1.2. Flood early warning systems
Systems included in this category distinguish themselves from EWF by the following:
•
The use of a hydrological rather than a meteorological variable as a predictor forflooding (discharge or water level), which is usually estimated with hydrological models using NWP as input.•
The detection algorithm of extreme events keeps a memory of past conditions to initialize new forecasts, instead of computing an event magnitude based only on forecast values, as in EWF. Hence, the event peak, timing and recession can be predicted over subsequent forecasts, including when the event is ongoing.•
Information on exposure and vulnerability of population and assetscan be coupled to the hazard prediction to target the detection of extreme events in areas where the potential impacts are larger. In the recent years, a number of GFP activations were triggered by GloFAS, the Global Flood Awareness System (http://www.globalfloods. eu,Alfieri et al., 2013;Hirpa et al., 2016), developed jointly by the European Commission - Joint Research Centre, and the ECMWF. GloFAS gives an overview of upcomingfloods in large world river ba-sins with a forecast range up to 30 days. It is based on distributed hy-drological simulation of ensemble NWP with global coverage. Stream-flow forecasts are compared statistically to climatological simulations to detect areas with significant probability of exceedingflood warning thresholds and the corresponding event magnitude.
2.2. Scenario analysis
Following a GFP activation, thefirst products to become available are scenario analyses, which are assessments of potentially inundated areas corresponding to the event magnitude predicted by the EWS. Scenario analysis in ungauged regions can be produced with a) in-undation models and b) satellite imagery.
2.2.1. Inundation models
Inundation models are 1D or 2D hydraulic models which take a set of initial and domain boundary conditions (e.g., initial river stage, sea level variations at the river mouth) and simulate the routing and spreading of aflood hydrograph through river channels and over their floodplains represented by a Digital Elevation Model (DEM). Flood si-mulations are usually performed at higher spatial and temporal re-solution than that used in the hydrological models used within EWS (Fig. 2), at the expense of increasing computing resources. Therefore, detailedflood simulations must be constrained to specific river reaches where severe events are predicted to take place.
Real-time inundation maps can be produced by forcing the hy-draulic model withflood hydrographs predicted by the EWS, to esti-mate areas likely to be inundated by the upcoming event. However, it is often preferred to use pre-computed inundation maps derived from synthetic hydrographs with a range of recurrence intervals, resulting in a catalogue of events that can be used to identify the inundation comparable to that of the predicted event. The advantages of the latter option are 1) prompt availability of maps for any river basin and for a range offlood magnitudes, 2) higher quality of pre-computed maps which are often produced with calibrated input, while predicted hy-drographs are more prone to quantitative errors.
A number of GFP partners have already produced global inundation maps for a range of givenflood return periods (Dottori et al., 2016; Pappenberger et al., 2012;Sampson et al., 2015;UNISDR, 2015;Ward et al., 2013;Yamazaki et al., 2011). These maps have been produced using various methods and spatial resolutions around 1 km, with some notable exceptions at 90 m (Sampson et al., 2015).
Whilst inundation models also represent inundation depths and extent for all time steps of the simulations, this is limited by the ac-curacy of the underlying global DEM (see Schumann et al., 2014; Yamazaki et al., 2017) and by the overestimation of the inundation extent due to the difficulty in accessing and including in the model information on localflood protection structures. The latter issue is ty-pically addressed by using global datasets offlood protection standards based on return period estimates (e.g., Scussolini et al., 2016), and assuming inundation only when the predictedflood magnitude is above such level (Alfieri et al., 2017;Ward et al., 2017).
2.2.2. Satellite imagery
products have the advantage of representing actual observedflooded areas, including the effect of flood protections, and therefore re-presenting more realistic scenarios than most modeling products. Although these maps provide information only on the inundation ex-tent, water levels can be estimated by intersecting the spatial in-formation with accurate DEMs (Hostache et al., 2009;Matgen et al., 2007;Cohen et al., 2017).
The Dartmouth Flood Observatory (DFO) produces and regularly updates the Global Atlas of Floodplains (http://floodobservatory. colorado.edu), an archive of annual maximum flood extent dataset since 2000, plus additional flood images pre-2000. In regions with discontinuous flood coverage, the data is grouped into a single class with maximum flood extent as recorded by all available satellite images. The archive has quasi global coverage between latitudes 60 degrees south and 56 degrees north.
Probabilisticflood mapping, where a pixel in an image is assigned a probability of being wet based on a statistical metric, is not yet avail-able in an operational sense, although first efforts are promising (Giustarini et al., 2015;Neal et al., 2013). Assigningflood exceedance probabilities to satellite image pixels is still a great challenge given the limited and discontinuous availability of imagery. Advancement in probabilisticflood mapping is a priority as it addresses user requests of having a better understanding of the uncertainty of current flood mapping methods.
2.3. Hydrological modelling
Hydrological modelling is another important activity in the GFP, as it directly informs decisions by end users. The hydrological response to a rainfall event produces a delay between the rainfall hyetograph and the consequent flood hydrograph downstream, due to soil saturation and routing of surface runoffin and through the river network. When extreme rainfall events are detected by automatic rain gauge networks, weather radars, satellite or combined products, gridded maps of rainfall intensity are used as input to hydrological models that simulate the spatial variability of streamflows and other hydrological variables in the near future, with improved skills in comparison to NWP-driven si-mulations. The lead time of skillful forecasts increases with the up-stream area of a particular river location, due to the longer delay be-tween the hyetograph centroid and the consequentflood hydrograph.
Within the GFP, the Global Flood Monitoring System (GFMS,http://
flood.umd.edu/,Wu et al., 2012,2014) is a NASA-funded experimental system using real-time TRMM Multi-satellite Precipitation Analysis (TMPA) and Global Precipitation Measurement (GPM) Integrated Multi-satellitE Retrievals for GPM (IMERG) precipitation maps as input to a hydrological model, running on a quasi-global (50 °N–50 °S) grid for
hydrological runoffand routing simulations. Flood detection and in-tensity estimates are based on 15 years of retrospective model runs with TMPA input, withflood thresholds derived for each grid location using surface water storage statistics. The GFMSflood forecast range is 5 days, with observed precipitationfields being extended with short term forecasts based on GEOS-5 NWP (Molod et al., 2012).
Similarly, the Floods.Global system (http://floods.global) uses GPM IMERG rainfall estimates to produce streamflows and threshold ex-ceedances in the coming 72 h. IMERG is available at 0.1 deg resolution in the range 60 °N–60 °S, every 30 minutes, with a six-hour latency. The EF5 hydrological model is run at 5-km global resolution every 30 minutes as new IMERG precipitation grids come available.
2.4. Monitoring
Flood monitoring is a key part of the disaster response and risk reduction. It focuses on assessing event magnitudes and impacts on the ground, identifying access corridors and supporting emergency opera-tions in the affected areas. Flood monitoring in ungauged regions is primarily achieved through satellite products based on optical, radar, and passive microwave techniques (Joyce et al., 2009; Smith, 1997; Vörösmarty et al., 1996). Despite the success of optical imagery for flood mapping, the systematic application of such imagery is hampered by persistent cloud cover during floods, particularly in small to medium-sized basins wherefloods often recede before weather condi-tions improve. Given the limitacondi-tions of sensors operating in the visible and infrared spectrum to acquire flood information routinely, micro-wave (radar) remote sensing is often considered an attractive alter-native or complementary technology for flood detection and mon-itoring. Microwaves penetrate cloud cover, fog and light rain, and, in commonly employed radar frequencies, active radar signals from syn-thetic aperture radar (SAR) are reflected away from the sensor by smooth open water bodies resulting in a high contrast between the flooded areas compared with dry land.
[image:4.595.73.523.58.208.2]Multi-temporal SAR images have been used successfully to monitor the evolution of aflood event or map inundation dynamics (e.g.Bates et al., 2006;Pulvirenti et al., 2011). In such cases, rapid mapping and dissemination is of course preferable; yet in urban areas, as well as in wetlands and forests, detection offlooding from a SAR image still poses considerable challenges (Schumann and Moller, 2015). In some cases, SAR images acquired over the same area but at different times were used to derive spatially distributed water levels through a complex but powerful technique known as interferometry, or InSAR (e.g.Alsdorf et al., 2000), which will be employed on the upcoming NASA/CNES Surface Water Ocean Topography (SWOT, http://swot.jpl.nasa.gov, Biancamaria et al., 2016) mission to measure water levels and map
water surfaces of the world’s lakes and main rivers (Fjørtoft et al., 2014).
In the GFP,flood monitoring connects users, developers and inter-mediaries. Also, satellite monitoring can be triggered and improved by early warning systems, through earlier and better planning of the ac-quisition of satellite imagery during emergencies. This interaction is key to improving the range of available flood products that can be produced during extreme events, including complexflooding events in which multiple types offlood occur at the same time.
2.4.1. Satellite-based discharge estimation
The River Watch Version 3.4 (http://floodobservatory.colorado.edu/ DischargeAccess.html) produces and updates daily a dataset of discharge estimates at dozens of gauged and ungauged sites scattered in all con-tinents except Antarctica. It processes microwave radiometry, from ex-isting and previous satellites sensors including TRMM, AMSR-E, AMSR-2, GPM, to monitorflow area changes due to changes in river width and then link them to discharge through statistical techniques. Below 50 degrees latitude, data extend continuously back to 1998, while at higher latitudes, data extend only to mid-2002. A global hydrologic model, run for five years (2003–2007) with daily time steps is used to calibrate theflow areas to discharge information for ungauged rivers, while sites located on gauged river sections can be calibrated with higher accuracy. The latter is a particularly interesting option to produce real-time and high quality streamflow information for rivers with stations that are no longer in use or with a long delay in data availability.Van Dijk et al. (2016)analyzed the skills of satellite-based river discharges and found best results (R > 0.9) for large and unregulated lowland rivers, particularly in tropical and boreal climate zones. Conversely, generally poor results were obtained in arid and temperate regions.
2.4.2. Satellite-based inundation mapping
The NASA GSFC MODIS Near Real-Time Global Flood Mapping ((NRT-GFM)) System produces global daily surface and flood water maps at approximately 250 m resolution, based on the twice daily overpass of the MODIS instrument, on the Terra and Aqua satellites. Surface water is detected by using a ratio of specific bands of the MODIS images, using a technique developed by Brakenridge et al. (2017). Multi-day compositing is used to improve the skills of the water detection algorithm, as it is affected by cloud cover and cloud shadows. Flooded areas are identified by overlaying the detected water map over a mask of reference water. Various products are generated in 10 × 10° tiles and updated in near real-time on the web (https://floodmap.gsfc. nasa.govandhttp://floodobservatory.colorado.edu).
FloodScan (http://product.aer.com/index.php/floodscan) provides daily historical and near-real-timeflood maps at 90-m resolution based on satellite microwave sensors (AMSR2, GMI, AMSR-E, and SSM/I), monitoring land areas continent-wide in clear and cloudy conditions from day and night satellite passes. The system derivesflooded fraction at microwave sensor resolution (22–50 km) using an end-member mixing algorithm approach that predicts local dry-land end-member based on historical seasonal variations and recent conditions. The standard product uses a temporal-spatial false positive detection scheme and three-day averaging to improve accuracy. When the system detects flooded fraction above background noise levels, it applies a physical downscaling technique to produce higher-resolution flood maps based on topography and historical surface water occurrence rates (Pekel et al., 2016). FloodScan covers Africa and North and South America with 1–2 day latency.
2.5. Users and emergency responders
To maximize the value of the GFPflood products, it is fundamental that:
1) the information reaches decision makers and relevant institutions
committed in the emergency management within the affected areas, 2) the products are received in a timely manner, to enable responders
to plan and act effectively,
3) the information is communicated clearly, together with confidence levels around the best prediction, or at different probability levels.
One challenge of producingflood information with global coverage is to be able to link to local users from virtually any world region, and to provide them with adequate training so that they understand the pro-ducts received, their limitations, and can then take unbiased decisions. For this reason the GFP is engaged with a variety of users, from regional and national hydro-meteorological services, to international NGOs and humanitarian organizations who in turn reach out to the community scale thanks to regional branches and a capillary presence in thefield. Among those, the Red Cross Red Crescent Climate Centre adopted in 2015 the Forecast-based Financing (FbF, seeCoughlan de Perez et al., 2016), a mechanism to release humanitarian funding based on forecast information before the flood event starts, to reduce risks, enhance preparedness and response, and make disaster risk management overall more effective. For example, in 2015, the Red Cross together with the Ugandan government used GloFAS forecasts to prepare forflooding in the region of Teso, in Uganda. Teams distributed water purification tablets, clean water storage containers, and soap to the potentially-af-fected population in advance of the forecastedflood peak, to reduce the risk of diarrheal diseases. After the Ugandan case, FbF has been used operationally in Togo, Bangladesh, and in Peru,1while additional FbF pilots have been established the Dominican Republic, Haiti, Mo-zambique, Nepal, Zambia, Mali, Mongolia, Ecuador, and the Phi-lippines.
Another relevant GFP-related activity is the Global Disaster Alert and Coordination System (http://www.gdacs.org), a cooperation framework between the United Nations, the European Commission and disaster managers worldwide to improve alerts, information exchange and co-ordination in thefirst phase after major disasters caused by different natural hazards. At present, some 14,000 disaster managers from gov-ernmental and non-govgov-ernmental organizations rely on GDACS alerts and automatic impact estimations to plan international assistance.
3. Case study–the South Asiafloods in august 2017
In August 2017, heavy and prolonged monsoon rains caused land-slides andfloods that killed about 1300 people and affected over 45 million people across India, Nepal and Bangladesh.2,3 The flooding started in the north-eastern part of India, along the Brahmaputra and its tributaries. As theflood wave moved downstream towards Bangladesh, extreme rains continued in a vast area along the Nepal-India border, causing severeflooding in various tributaries of the Ganges River. In Bangladesh, after the devastation of thefirst monsoon wave in mid-July, a secondflood spell started on 12 August affecting a third of the country and 8 million people. The nation’s Ministry of Disaster Man-agement and Relief (MoDMR) reported that the 2017floods were the worst in the past four decades.
The GFP community was activated on the 7 August, three days before the start of the mainflooding in the upper Brahmaputra, fol-lowing a persistent signal of a major upcoming event from the EFI and GloFAS forecasts (seeFig. 3). Notably, an experimental suite of GloFAS using ECMWF monthly forecasts as input showed that the system pre-dicted potentially severe conditions as early as the 28 July 2017, 12 to 18 days ahead of theflooding along the major rivers.4
Based on theflood early warning information, a request for
pre-1http://www.climatecentre.org/programmes-engagement/forecast-based-financing. 2https://www.unicef.org/infobycountry/media_100719.html.
3http://erccportal.jrc.ec.europa.eu/Maps/Daily-maps/mapId/2212/xmps/1580. 4https://www.ecmwf.int/en/about/media-centre/south-asia-fl
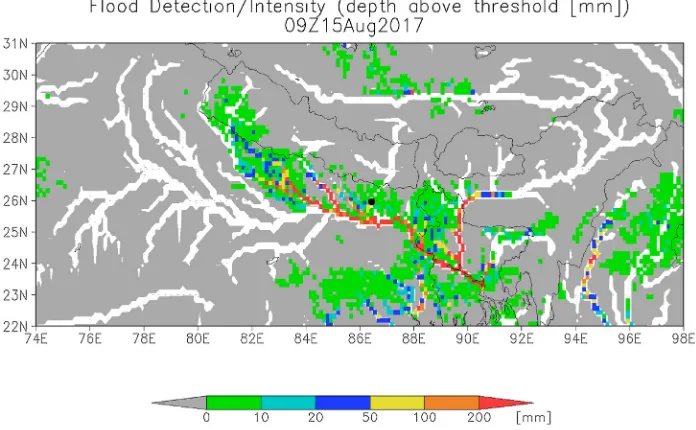
tasking the acquisition of satellite images was sent on 10 August to the Copernicus Emergency Management Service (EMS) in view of a po-tential activation by authorized users in the affected countries. As new satellite estimates of precipitation became available, regular updates were provided by the GFMS (Fig. 4), with itsflood product at 1/8th degree and the high resolution (i.e. 1 km) predicted inundation extent. Additional model results based on various global NWP were shared from GloFAS and from the globalflood forecasting system, currently under development at Deltares. Results from multiple hydrological models and input precipitation revealed the importance of a multi-model approach to better identify the uncertainties, not only of the predictedflood magnitude but also of the timing of theflood waves, a key parameter to estimate for optimal planning of satellite imagery acquisitions and of emergency operations.
Relevant information on the evolution of theflood was available for
a number of sites in the River Watch v3.4 database (Fig. 5), yet with varying skills depending on the location. Asfloodwaters propagated downstream through the river network, satellite acquisitions enabled a comprehensive spatial coverage of theflood extent and the identifica-tion of hotspots offlood risk, through overlay with exposure data such as population density maps, land use, and critical infrastructure. Ear-liest satellite images to be made available were from radar and passive microwave sensors (Fig. 6), due to their capacity to see through the clouds, followed then by optical images.
4. Discussion and conclusions
[image:6.595.73.526.57.299.2]The GFP community and its products provide access to a wealth of data focused onflood management, though coming from many different groups with a range of different backgrounds. Therefore, a primary
Fig. 3.Ensemble streamflow predictions from GloFAS forecasts of August 4th, 2017, for three reporting points along the Ganges and Brahmaputra rivers. Graphs indicate a high probability of an extreme event from mid-August, with peakflow magnitude up to 1 in 50 year. Purple shades indicate the probability of the ensemble streamflow predictions [%] to exceed a 20 year return period discharge (For interpretation of the references to colour in thisfigure legend, the reader is referred to the web version of this article).
[image:6.595.123.471.349.564.2]Fig. 5.Satellite-based river discharge estimates using passive microwave radiometry from River Watch v3.4. Virtual station on the Koshi River, India (see black circle inFig. 4) during the August 2017floods.
[image:7.595.116.482.248.713.2]challenge is to identify the range of applicability, strengths and lim-itations of each product, as well as the complementarity of information from various systems to improve the knowledge on upcoming and on-going events. Currently, most GFP products are made available through dedicated web platforms. Here, we call for a single reference portal for operational global flood risk management, where users can see all products in a coordinated manner and receive training on new appli-cations and how to evaluate them. Such an initiative was previously attempted by the JRC with the Global Integrated Flood Map (http:// dma.jrc.it/map/?application=floods), though it highlighted a number of existing challenges that need be addressed before achieving an ef-fectiveflood risk management platform. The main challenges identified were:
•
Time reference and updating frequency: Most applications are up-dated on a daily basis, which makes it a suitable time reference for web visualization. Some systems prove that sub-daily updating may provide additional benefits, particularly for short-lived and intense events. Further, experience from EWS has stressed the importance of enabling the data visualization of previous dates, rather than just the latest model output, to better follow the evolution of events and detect persistence or jumpiness of weather forecasts (e.g., Bartholmes et al., 2009).•
Time validity: products validity may refer to different phases within aflood event. EWS and hydrological simulations produce output for a range of time steps from the present up to one month ahead. Satellite products are often released in near real time, though some composite products include data ranging up to the previous 14 days (e.g., the NRT-GFM), hence their time referencing is less precise. In addition, scenario analysis has no specific indication of time, though it indicates the worst-case scenario for each selected event magni-tude. This suggests the need for an additional time dimension re-ferring to the time validity as compared to a selected dateti, which for current applications would typically range {ti-15,ti+ 30} days, possibly resorting to multi-day aggregation for farther forecast horizons.•
Spatial resolution: this varies considerably depending on the pro-duct type and is inherently related to the confidence and the timing of each specific output. A clear example is that ofFig. 2, where EWS show the probability of occurrence of extreme events in the coming 30 days at∼10 km resolution (purple shades), inundation maps at constant magnitude identify the main areas at risk of being in-undated at ∼1 km resolution, while satellite imagery can detect actualflooded areas during the event at spatial resolution commonly between 10 m (SAR-based, as inFig. 2) and 250 m (MODIS-based).•
Data format and product type: a key requirement for a common vi-sualization platform is aflexible framework, able to read different data formats and display various types of products including gridded and polygon maps, time series, and geo-located information, among others. Current back-end and front-end technology can support the integration and comparison of model results for the same event and location.•
Data upload and download: Data upload and display must accountfor products issued at regular intervals (e.g., EWS), as well as on-request products (e.g., satelliteflood maps) typically generated once remote sensing data become available. Dialogue with users has pointed out the importance of enabling downloading and printing of custom-made flood products directly from the online platform, coupled with aflexible selection of layers including local exposure, critical infrastructures and background maps. This raises the issue of sharing data with limited access (e.g., commercial products, re-stricted user networks) through an open service such as the GFP. Discussion on this topic is still ongoing though solutions are being explored in the sharing of data to selected user groups, or alter-natively visualizing derivative products in place of the original input with restricted access (e.g., as for NWP).
•
Interoperability between products and services: Now in the era ofservice/product proliferation, there is an increasing need to make these operate seamlessly with the end-user system in operation. Thus offered products and/or services should be built on open geospatial data standards (such as implemented by the OGC) that enable full interoperability. In particular, hazard data is most useful if it can be combined with local information on vulnerability and exposure. Hazard data platforms that are interoperable and easily combined with local information are much more likely to be used to prevent major impacts.
•
Performance evaluation: Quantitative information on product eva-luation has been recognized as one of the top priorities for users of flood forecasting and monitoring systems (Wetterhall et al., 2013). Performance evaluation is indeed a key task for systems that in-tegrate and compare products with different input data and skills. GFP output includes both calibrated (e.g., River Watch), un-calibrated (e.g., EFI, NRT-GFM), and mixed systems, where only some specific component is calibrated (e.g., river discharges in some inundation model). For example, in“Floods.Global”, the model for machine learning prediction is trained over the U.S. only, where validation data is available, while the calibrated setup is then ex-ported to other world regions to expand the modelling coverage, though with reduced performance. Effective interpretation of results should take into account a set of indicators of each system’s per-formance, possibly derived using a common validation dataset for all systems. Models producing the same target variable could then be merged by weighting each on their performance, which may vary depending on the geographic location and on the time range, to generate the best overall estimate and the related uncertainty. Providing the recipient with calibrated uncertainty information is critical to enabling use and building trust in model data.The success of the GFP comes from being part of a global forum with the opportunity to test and improve research tools in real emergency management situations, with huge potential impact on current risk reduction practices over large scaleflood events. Compared to other similar initiatives (e.g., HEPEX,5 WMO HydroSOS,6 NASA Disaster Program7), the GFP is unique in including all the following three key features: 1) focusing on different phases of theflood risk management cycle, from the early warning to the monitoring and recovery process, 2) a global coverage, particularly important for countries with no or limited alternatives for flood prediction and monitoring, and 3) its operational activities, which couple the development of new techniques with application to upcoming and ongoingflood events.
Being a voluntary and unfunded project, the main activities of GFP members must also meet the objectives of each own’s research group or project. Yet, this has already created a number of collaborations among various GFP partners, which are realized through joint research activ-ities, conference sessions, and new products for operational flood monitoring (De Groeve et al., 2015; Revilla-Romero et al., 2015; Schumann et al., 2016;Trigg et al., 2016;Ward et al., 2015).
We invite more institutes to join the GFP and share their products to support and improve current capabilities in disaster risk management. Research communities active onflashfloods, coastalfloods, water-re-lated landslides, as well as teams working on estimating surface water elevation through satellite altimetry sensors, are particularly relevant to the GFP for the complementarity of information they provide. Further, we stress the importance of having a global representation of GFP members to ensure a full picture of major events ongoing worldwide, the support of experts from various regions and direct links to relevant end users at local level, for a prompt and effective communication of flood information and user feedback.
5https://hepex.irstea.fr/.
Acknowledgements
S. Cohen would like to thank NASA Coastal Hazards Demo Project grant (via SSAI contract #NNL16AA05C) for partly supporting his effort. E. Coughlan de Perez was supported by the UK Natural Environment Research Council (NE/P000525/1).
Appendix A. Supplementary data
Supplementary material related to this article can be found, in the online version, at doi:https://doi.org/10.1016/j.envsci.2018.03.014. References
Adams, T.E., Pagano, T.C., 2016. Flood Forecasting: A Global Perspective. Academic Press.
Alfieri, L., Burek, P., Dutra, E., Krzeminski, B., Muraro, D., Thielen, J., Pappenberger, F., 2013. GloFAS–global ensemble streamflow forecasting andflood early warning. Hydrol. Earth Syst. Sci. 17, 1161–1175. http://dx.doi.org/10.5194/hess-17-1161-2013.
Alfieri, L., Bisselink, B., Dottori, F., Naumann, G., de Roo, A., Salamon, P., Wyser, K., Feyen, L., 2017. Global projections of riverflood risk in a warmer world. Earth’s Future 5, 171–182.http://dx.doi.org/10.1002/2016EF000485.
Alsdorf, D.E., Melack, J.M., Dunne, T., Mertes, L.A.K., Hess, L.L., Smith, L.C., 2000. Interferometric radar measurements of water level changes on the Amazonflood plain. Nature 404, 174.http://dx.doi.org/10.1038/35004560.
Alsdorf, D.E., Rodríguez, E., Lettenmaier, D.P., 2007. Measuring surface water from space. Rev. Geophys. 45http://dx.doi.org/10.1029/2006RG000197.RG2002. Bartholmes, J.C., Thielen, J., Ramos, M.H., Gentilini, S., 2009. The europeanflood alert
system EFAS - part 2: statistical skill assessment of probabilistic and deterministic operational forecasts. Hydrol. Earth Syst. Sci. 13, 141–153.
Bates, P.D., Wilson, M.D., Horritt, M.S., Mason, D.C., Holden, N., Currie, A., 2006. Reach scalefloodplain inundation dynamics observed using airborne synthetic aperture radar imagery: Data analysis and modelling. J. Hydrol. Meas. Parameterization Rainfall Microstruct. 328, 306–318.http://dx.doi.org/10.1016/j.jhydrol.2005.12. 028.
Biancamaria, S., Lettenmaier, D.P., Pavelsky, T.M., 2016. The SWOT mission and its capabilities for land hydrology. Surv. Geophys. 37, 307–337.http://dx.doi.org/10. 1007/s10712-015-9346-y.
Bouttier, F., Kelly, G., 2001. Observing-system experiments in the ECMWF 4D-Var data assimilation system. Q. J. R. Meteorol. Soc. 127, 1469–1488.http://dx.doi.org/10. 1002/qj.49712757419.
Brakenridge, G.R., Anderson, E., Kettner, A.J., Slayback, D., Policelli, F., 2017. Current Flood Conditions. http://floodobservatory.colorado.edu.
Calmant, S., Seyler, F., Cretaux, J.F., 2008. Monitoring continental surface waters by satellite altimetry. Surv.Geophys. 29, 247–269. http://dx.doi.org/10.1007/s10712-008-9051-1.
Cohen, S., Brakenridge, G.R., Kettner, A., Bates, B., Nelson, J., McDonald, R., Huang, Y.-F., Munasinghe, D., Zhang, J., 2017. Estimatingfloodwater depths fromflood in-undation maps and topography. J. Am. Water Resour. Assoc.http://dx.doi.org/10. 1111/1752-1688.12609.n/a-n/a.
Coughlan de Perez, E., van den Hurk, B., van Aalst, M.K., Amuron, I., Bamanya, D., Hauser, T., Jongma, B., Lopez, A., Mason, S., Mendler de Suarez, J., Pappenberger, F., Rueth, A., Stephens, E., Suarez, P., Wagemaker, J., Zsoter, E., 2016. Action-based flood forecasting for triggering humanitarian action. Hydrol. Earth Syst. Sci. 20, 3549–3560.http://dx.doi.org/10.5194/hess-20-3549-2016.
De Groeve, T., Thielen-Del Pozo, J., Brakenridgdge, R., Adler, R., Alfieri, L., Kull, D., Lindsay, F., Imperiali, O., Papppenberger, F., Rudari, R., Salamon, P., Villars, N., Wyjad, K., 2015. Joining forces in a globalflood partnership. Bull. Am. Meteorol. Soc. 96, ES97–ES100.http://dx.doi.org/10.1175/BAMS-D-14-00147.1.
Dottori, F., Salamon, P., Bianchi, A., Alfieri, L., Hirpa, F.A., Feyen, L., 2016. Development and evaluation of a framework for globalflood hazard mapping. Adv. Water Resour. 94, 87–102.http://dx.doi.org/10.1016/j.advwatres.2016.05.002.
Emerton, R.E., Stephens, E.M., Pappenberger, F., Pagano, T.C., Weerts, A.H., Wood, A.W., Salamon, P., Brown, J.D., Hjerdt, N., Donnelly, C., Baugh, C.A., Cloke, H.L., 2016. Continental and global scaleflood forecasting systems. Wiley Interdiscip. Rev. Water 3, 391–418.http://dx.doi.org/10.1002/wat2.1137.
Fjørtoft, R., Gaudin, J.M., Pourthié, N., Lalaurie, J.C., Mallet, A., Nouvel, J.F., Martinot-Lagarde, J., Oriot, H., Borderies, P., Ruiz, C., Daniel, S., 2014. KaRIn on SWOT: Characteristics of near-Nadir Ka-band interferometric SAR imagery. IEEE Trans. Geosci. Remote Sens. 52, 2172–2185.http://dx.doi.org/10.1109/TGRS.2013. 2258402.
Giustarini, L., Chini, M., Hostache, R., Pappenberger, F., Matgen, P., 2015. Flood hazard mapping combining hydrodynamic modeling and multi annual. Remote Sens. data. Remote Sens. 7, 14200–14226.http://dx.doi.org/10.3390/rs71014200. Hirpa, F.A., Salamon, P., Alfieri, L., Pozo, J.T., Zsoter, E., Pappenberger, F., 2016. The
effect of reference climatology on globalflood forecasting. J. Hydrometeor 17, 1131–1145.http://dx.doi.org/10.1175/JHM-D-15-0044.1.
Hostache, R., Matgen, P., Schumann, G., Puech, C., Hoffmann, L., Pfister, L., 2009. Water level estimation and reduction of hydraulic model calibration uncertainties using satellite SAR images offloods. IEEE Trans. Geosci. Remote Sens. 47, 431–441.http://
dx.doi.org/10.1109/TGRS.2008.2008718.
Jonkman, S.N., 2005. Global perspectives on loss of human life caused byfloods. Nat. Hazards 34, 151–175.http://dx.doi.org/10.1007/s11069-004-8891-3.
Joyce, K.E., Belliss, S.E., Samsonov, S.V., McNeill, S.J., Glassey, P.J., 2009. A review of the status of satellite remote sensing and image processing techniques for mapping natural hazards and disasters. Prog. Phys. Geogr. 33, 183–207.http://dx.doi.org/10. 1177/0309133309339563.
Lalaurette, F., 2003. Early detection of abnormal weather conditions using probabilistic extreme forecast index. Q. J. R. Meteorol. Soc. 129, 3037–3057.
Matgen, P., Schumann, G., Henry, J.-B., Hoffmann, L., Pfister, L., 2007. Integration of SAR-derived river inundation areas, high-precision topographic data and a riverflow model toward near real-timeflood management. Int. J. Appl. Earth Obs. Geoinf. 9, 247–263.http://dx.doi.org/10.1016/j.jag.2006.03.003.
Molod, A., Takacs, L., Suarez, M., Bacmeister, J., Song, I.-S., Eichmann, A., 2012. The GEOS-5 Atmospheric General Circulation Model: Mean Climate and Development from MERRA to Fortuna. NASA Goddard Space Flight Center, Greenbelt, MD, United States.
Molteni, F., Buizza, R., Palmer, T.N., Petroliagis, T., 1996. The ECMWF ensemble pre-diction system: Methodology and validation. Q. J. R. Meteorol. Soc. 122, 73–119. Neal, J., Keef, C., Bates, P., Beven, K., Leedal, D., 2013. Probabilisticflood risk mapping
including spatial dependence. Hydrol. Process. 27, 1349–1363.http://dx.doi.org/10. 1002/hyp.9572.
Pappenberger, F., Dutra, E., Wetterhall, F., Cloke, H., 2012. Deriving globalflood hazard maps offluvialfloods through a physical model cascade. Hydrol. Earth Syst. Sci. Discuss 9, 6615–6647.
Pekel, J.-F., Cottam, A., Gorelick, N., Belward, A.S., 2016. High-resolution mapping of global surface water and its long-term changes. Nature 540http://dx.doi.org/10. 1038/nature20584.nature20584.
Pesaresi, M., Ehrlich, D., Kemper, T., Siragusa, A., Florczyk, A.J., Freire, S., Corbane, C., 2017. Atlas of the Human Planet 2017.
Pulvirenti, L., Pierdicca, N., Chini, M., Guerriero, L., 2011. An algorithm for operational flood mapping from synthetic aperture Radar (SAR) data using fuzzy logic. Nat. Hazards Earth Syst. Sci. 11, 529–540. http://dx.doi.org/10.5194/nhess-11-529-2011.
Revilla-Romero, B., Hirpa, F.A., Pozo, J.T., Salamon, P., Brakenridge, R., Pappenberger, F., De Groeve, T., 2015. On the use of globalflood forecasts and satellite-derived inundation maps forflood monitoring in data-sparse regions. Remote Sens. 7, 15702–15728.http://dx.doi.org/10.3390/rs71115702.
Sampson, C., Smith, A., Bates, P., Neal, J., Alfieri, L., Freer, J., 2015. A high-resolution globalflood hazard model. Water Resour. Res. 51, 7358–7381.http://dx.doi.org/10. 1002/2015WR016954.
Schumann, G.J.-P., Moller, D.K., 2015. Microwave remote sensing offlood inundation. Physics and chemistry of the earth, parts A/B/C. Emerg. Sci. Appl. With Microw. Remote Sens. Data 83–84, 84–95.http://dx.doi.org/10.1016/j.pce.2015.05.002. Schumann, G.J.-P., Bates, P.D., Neal, J.C., Andreadis, K.M., 2014. Technology:fight floods on a global scale. Nature 507, 169.http://dx.doi.org/10.1038/507169e. Schumann, G.J.-P., Frye, S., Wells, G., Adler, R., Brakenridge, R., Bolten, J., Murray, J.,
Slayback, D., Policelli, F., Kirschbaum, D., Wu, H., Cappelaere, P., Howard, T., Flamig, Z., Clark, R., Stough, T., Chini, M., Matgen, P., Green, D., Jones, B., 2016. Unlocking the full potential of Earth observation during the 2015 Texasflood dis-aster. Water Resour. Res. 52, 3288–3293.http://dx.doi.org/10.1002/
2015WR018428.
Scussolini, P., Aerts, J.C.J.H., Jongman, B., Bouwer, L.M., Winsemius, H.C., de Moel, H., Ward, P.J., 2016. FLOPROS: an evolving global database offlood protection stan-dards. Nat. Hazards Earth Syst. Sci. 16, 1049–1061.http://dx.doi.org/10.5194/ nhess-16-1049-2016.
Smith, L.C., 1997. Satellite remote sensing of river inundation area, stage, and discharge: a review. Hydrol. Process. 11, 1427–1439. http://dx.doi.org/10.1002/(SICI)1099-1085(199708)11:10<1427::AID-HYP473>3.0.CO;2-S.
Thielen, J., Bartholmes, J., Ramos, M.-H., De Roo, A., 2009. The Europeanflood alert system - part 1: concept and development. Hydrol. Earth Syst. Sc. 13, 125–140. Trigg, M.A., Birch, C.E., Neal, J.C., Bates, P.D., Smith, A., Sampson, C.C., Yamazaki, D.,
Hirabayashi, Y., Pappenberger, F., Dutra, E., Ward, P.J., Winsemius, H.C., Salamon, P., Dottori, F., Rudari, R., Kappes, M.S., Simpson, A.L., Hadzilacos, G., Fewtrell, T.J., 2016. The credibility challenge for globalfluvialflood risk analysis. Environ. Res. Lett. 11, 094014.http://dx.doi.org/10.1088/1748-9326/11/9/094014.
UNISDR, 2015. Making development sustainable, the future of disaster risk management: Global assessment report on disaster risk reduction 2015 (no. ISBN/ISSN 9789211320428). United Nations Office for Disaster Risk Reduction (UNISDR). Geneva, Switzerland.
Van Dijk, A.I.J.M., Brakenridge, G.R., Kettner, A.J., Beck, H.E., De, G., Schellekens, J., 2016. River gauging at global scale using optical and passive microwave remote sensing. Water Resour. Res. 52, 6404–6418.http://dx.doi.org/10.1002/ 2015WR018545.
Vörösmarty, C.J., Willmott, C.J., Choudhury, B.J., Schloss, A.L., Stearns, T.K., Robeson, S.M., Dorman, T.J., 1996. Analyzing the discharge regime of a large tropical river through remote sensing, ground-based climatic data, and modeling. Water Resour. Res. 32, 3137–3150.http://dx.doi.org/10.1029/96WR01333.
Ward, P.J., Jongman, B., Weiland, F.S., Bouwman, A., Beek, R., van, Bierkens, M.F.P., Ligtvoet, W., Winsemius, H.C., 2013. Assessingflood risk at the global scale: model setup, results, and sensitivity. Environ. Res. Lett. 8, 044019.http://dx.doi.org/10. 1088/1748-9326/8/4/044019.
Ward, P.J., Jongman, B., Aerts, J.C.J.H., Bates, P.D., Botzen, W.J.W., Diaz Loaiza, A., Hallegatte, S., Kind, J.M., Kwadijk, J., Scussolini, P., Winsemius, H.C., 2017. A global framework for future costs and benefits of river-flood protection in urban areas. Nat. Clim. Change Adv. Online Publ.http://dx.doi.org/10.1038/nclimate3350. Wetterhall, F., Pappenberger, F., Alfieri, L., Cloke, H.L., Thielen-del Pozo, J., Balabanova,
S., Daňhelka, J., Vogelbacher, A., Salamon, P., Carrasco, I., Cabrera-Tordera, A.J., Corzo-Toscano, M., Garcia-Padilla, M., Garcia-Sanchez, R.J., Ardilouze, C., Jurela, S., Terek, B., Csik, A., Casey, J., Stankūnavičius, G., Ceres, V., Sprokkereef, E., Stam, J., Anghel, E., Vladikovic, D., Alionte Eklund, C., Hjerdt, N., Djerv, H., Holmberg, F., Nilsson, J., Nyström, K., Sušnik, M., Hazlinger, M., Holubecka, M., 2013. HESS opi-nions“Forecaster priorities for improving probabilisticflood forecasts. Hydrol. Earth Syst. Sci. 17, 4389–4399.http://dx.doi.org/10.5194/hess-17-4389-2013. Wu, H., Adler, R.F., Hong, Y., Tian, Y., Policelli, F., 2012. Evaluation of globalflood
detection using satellite-based rainfall and a hydrologic model. J. Hydrometeorol. 13, 1268–1284.http://dx.doi.org/10.1175/JHM-D-11-087.1.
Wu, H., Adler, R.F., Tian, Y., Huffman, G.J., Li, H., Wang, J., 2014. Real-time globalflood estimation using satellite-based precipitation and a coupled land surface and routing model. Water Resour. Res. 50, 2693–2717.http://dx.doi.org/10.1002/
2013WR014710.
Yamazaki, D., Kanae, S., Kim, H., Oki, T., 2011. A physically based description of
floodplain inundation dynamics in a global river routing model. Water Resour. Res. 47, W04501.
Yamazaki, D., Ikeshima, D., Tawatari, R., Yamaguchi, T., O’Loughlin, F., Neal, J.C., Sampson, C.C., Kanae, S., Bates, P.D., 2017. A high-accuracy map of global terrain elevations. Geophys. Res. Lett. 44http://dx.doi.org/10.1002/2017GL072874. 2017GL072874.

![Fig. 2. July 2017 floods in South China. 1 in 100 year JRC flood map for South Asia (a) and detail of the Zishui River near Pingkou, Hunan Province (b), showing the probability ofensemble streamflow predictions [%] to exceed a 20 year return period discharge from GloFAS forecasts of June 28th, 2017 (purple shades), the 1 in 100 year JRC flood map (blueshades), and DFO satellite derived SAR image of flooded areas on July 3rd, 2017 (in red) (For interpretation of the references to colour in this figure legend, the reader is referred to theweb version of this article).](https://thumb-us.123doks.com/thumbv2/123dok_us/1888147.146307/4.595.73.523.58.208/probability-ofensemble-streamow-predictions-forecasts-blueshades-interpretation-references.webp)