Int. J. Electrochem. Sci., 10 (2015) 5420 - 5433
International Journal of
ELECTROCHEMICAL
SCIENCE
www.electrochemsci.org
Galvanic Corrosion in 3.5 wt. % NaCl Solutions of Magnesium
alloy AZ31 Coupled with Ni After Different Bonding Periods of
Time
A. N. AlHazaa1,2, El-Sayed M. Sherif 3,4,*, and Hany S. Abdo3,5 1
Department of Physics & Astronomy, College of Science, King Saud University, P. O. Box – 2455 Riyadh 11451, Saudi Arabia
2
King Abdullah Institute for Nanotechnology (KAIN), King Saud University, Riyadh, saudi Arabia. 3
Center of Excellence for Research in Engineering Materials (CEREM), Advanced Manufacturing Institute (AMI), King Saud University, P.O. Box - 800, Riyadh 11421, Saudi Arabia
4
Electrochemistry and Corrosion Laboratory, Department of Physical Chemistry, National Research Centre (NRC), Dokki, 12622 Cairo, Egypt
5
Mechanical Design and Materials Department, Faculty of Energy Engineering, Aswan University, Aswan 81521, Egypt
*
E-mail: esherif@ksu.edu.sa; emsherif@gmail.com
Received: 24 April 2015 / Accepted: 15 May 2015 / Published: 27 May 2015
The magnesium alloy AZ31(96Mg-3Al-1Zn alloy) was coupled with nickel using transient liquid phase bonding method at 520 oC for different periods of time varied from 5 min to 40 min. The corrosion behavior of the Mg alloy AZ31 without and with Ni coupled within it in 3.5 wt.% sodium chloride solution was reported using cyclic potentiodynamic polarization (CPP) and electrochemical impedance spectroscopy (EIS). The study was complemented by scanning electron microscope (SEM) and energy dispersive X-ray (EDX) analysess. CPP experiments indicated that bonding the Mg alloy AZ31 with Ni increases its corrosion through increasing the values of corrosion current density (jCorr) and corrosion rate (RCorr) as well as decreasing their polarization resistance (Rp). Elongating the bonding time from 5 min up to 40 min led to further increases in the corrosion of AZ31. The EIS measurements showed that bonding the magnesium alloy with Ni and the increase of bonding time decreases the diameter of the obtained semicircle obtained by Nyquist plots, decreases the values of the impedance of the interface and the maximum degree of phase angle obtained by Bode plots. SEM/EDX investigations confirmed that bonding the Mg alloy with Ni increases the dissolution of the alloy via galvanic corrosion, which was found to increase with increasing the time of bonding.
1. INTRODUCTION
The magnesium alloy AZ31 is known to be one of the most used alloys in the industry [1]. AZ31 is a wrought alloy that has low density, high strength per weight ratio, good ductility and machinability combined with corrosion resistance and weldability at room temperature as well as perfect for rolling and extrusion [1-3]. The alloy has been widely used in cell phone and laptop cases, aircraft fuselages, construction of vehicles, concrete tools and speaker cones [1-5]. The addition of Al and the increase of its content in the alloy AZ31 lead to increasing the yield strength, ultimate tensile strength, oxidation resistance and corrosion resistance. This on the other hand decreases the castability and weldability [4]. The percent of Zn in the alloy AZ31 does not exceed 1.0% and is for avoiding the occurrence of cracking of the alloy during its solidification and to improve the alloy’s castability and corrosion behavior [6].
Galvanic corrosion occurs between two different metals or alloys when are immersed in a corrosive environment and in electrical contact with each other. It is well known that the active metal or alloy with more negative potential will act as the anode and the other will be the cathode [7,8]. Usually, the anode material dissolves to protect the cathode. The presence of a conductive path between the two metals is a must for the occurrence of galvanic corrosion to allow the metal ions to move from the more anodic metal to the more cathodic one. An electrical path is also necessary for the corrosion to take place between the two coupled metals. The intensity of galvanic corrosion increases when there is a short distance and great potential difference between the two metallic materials. Also, the greater the area of the cathode compared to anode, the higher the severity of the galvanic corrosion [7-10].
Fabricating and joining of magnesium alloys are important to extend their use in the different fields in industry. One aspect to look at when joining magnesium alloys is the corrosion properties since magnesium is a reactive metal and has poor corrosion resistance. In this research work, two pieces of magnesium alloys were coated by Ni and then bonded together using transient liquid phase bonding (TLP) method at 520 oC and at various bonding times. Ni coating is expected to form eutectic liquid with magnesium alloy and diffuse at this bonding temperature. It is expected that the presence of Ni in Mg alloy will cause a galvanic corrosion. The effect of bonding time on the galvanic corrosion between the alloy AZ31 and the coupled Ni in 3.5% NaCl solutions is reported. The corrosion measurements were obtained using CPP and EIS techniques and the work was complemented by the SEM and EDX investigations.
2. EXPERIMENTAL PROCEDURES
2.1. Initial preparation
grit finish. These samples were then washed by ethanol and distilled water and finally dried and kept inside a desiccator.
2.2. Coating Ni on Mg alloy by thermal evaporation
[image:3.596.182.414.315.490.2]The magnesium samples were inserted into a chamber of thermal evaporation system (Edwards coating system E303A), which was equipped with a thickness monitoring as can be seen from Fig. 1. The components of the thermal evaporation chamber that was employed for the coating of Ni onto the surfaces of the magnesium alloy are also presented in Fig. 2. Where, a pure nickel wire was placed on the resistive tungsten basket then allowing the vacuum of the chamber to reach 10-5 torr level. Also, the current through the resistive tungsten basket was increased till the evaporation of the Ni wire took place. The time of evaporation was set to two minutes for obtaining a 5 µm coating layer thickness on the magnesium surfaces.
Figure 1. Edwards coating system type E303A that was employed as a thermal evaporator for Ni on the magnesium alloy AZ31.
[image:3.596.180.414.557.735.2]
2.3. Bonding (coupling) mg alloy samples
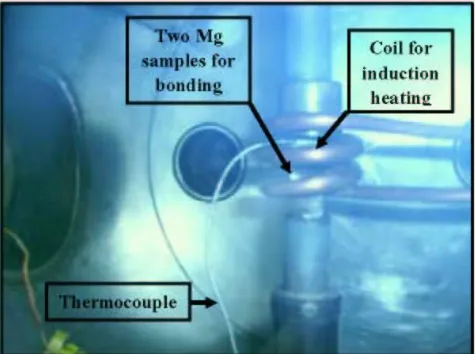
The bonding experiments between each two samples coated by Ni were done using Induction heating furnace, which is shown in Fig. 3. All bonding experiments were used under the minimum load of 1 MPa uniaxial presses on the samples. Induction heating was used as a heating source under a pressure of 1x10⁻⁵ torr. A fast heating rate was used to achieve a bonding temperature of 520 oC in two minutes. The temperature of the joint was monitored by a thermocouple. The bonding time was used as the process parameter variable. After the bonding (coupling) experiment, each bonded sample was cut across the joint using wire cutting. The samples were then mounted in Bakelite for corrosion study. Fig. 4 shows the schismatic representations for the stages of sample preparation after bonding (coupling) the Mg alloy with the thermally evaporated Ni on its surface.
Figure 3. Assembly setup for the bonding (coupling) of the two Mg pieces containing Ni deposited on its surfaces.
[image:4.596.181.419.275.452.2] [image:4.596.143.448.530.694.2]
2.4. Chemicals and materials
Sodium chloride with 99% purity was purchased from Merck and was used as received. The rods of AZ31 Mg alloy without and with Ni bonded were welded to copper wires and cold mounted in epoxy and drying in air. The surface of the alloys to be exposed to the solution was ground using increased grades of emery paper of up to 800grit [11]. These electrodes were cleaned by distilled water, degreased with acetone; rewashed again using distilled water then dried using a tissue paper. A three-electrode configuration conventional electrochemical cell was employed; the Mg alloy without and with the Ni bonded, an Ag/AgCl electrode (in 3.0 M KCl), and a platinum foil were respectively used as the working, reference, and counter electrodes [11,12].
2.5. Electrochemical test measurements
All electrochemical measurements were performed employing an Autolab Potentiostat/Galvanostat (PGSTAT20 computer controlled) operated by the general purpose electrochemical software (GPES). Polarization data were collected via scanning the potential from -2.0 to -1.0 V vs. Ag/AgCl with a scan rate of 0.001 V/s. The potential was scanned again in the reverse direction at the same scan rate in order to complete the cycle test [13]. The EIS plots were performed at an open-circuit corrosion potential with a frequency range varied from 100000 Hz to 0.1 Hz. The ac wave was 5 mV peak-to-peak overlaid on a dc bias potential. The Powersine software at a rate of 10 points per decade change in frequency was used in collecting the EIS data [14]. All measurements were performed after 1 h immersion of the working electrode in the stagnant and freely aerated sodium chloride solution at room temperature.
2.3. Surface morphological investigations
The scanning electron micrographs (SEM) were collected using a JEOL model JSM-6610LV scanning electron microscope. The analysis of surface of the alloy AZ31 without and with Ni bonded after its corrosion was investigated using an energy dispersive X-ray (EDX) attached to the microscope.
3. RESALTS AND DISCUSSION
3.1. Cyclic potentiodynamic polarization (CPP)
current (jCorr), polarization resistance (RP), and corrosion rate (RCorr) were obtained as depicted in Table 1. Most of these parameters were calculated as reported in our previous studies [11-18]. Also, the RP and RCorr values were calculated from the following equations [15-19];
) 1 ( ) ( 3 . 2 . 1 a c a c Corr P j R ) 2 ( Corr W C A d E k j R orr
Where, k is the unit constant of the rate of corrosion (k= 3272 mm amp-1cm-1 y-1), EW the equivalent weight in g eq-1 of alloy AZ31 (EW = 12.15), d the density in g cm
−3
(d= 1.74), and A the surface area of the Mg electrode in cm2.
-2.0 -1.8 -1.6 -1.4 -1.2 -1.0 10-6 10-5 10-4 10-3 10-2 10-1
(f)
(e)
(d)
(c)
(b)
j / A c m -2(a)
-2.0 -1.8 -1.6 -1.4 -1.2 -1.0 10-6 10-5 10-4 10-3 10-2 10-1
-2.0 -1.8 -1.6 -1.4 -1.2 -1.0 10-6 10-5 10-4 10-3 10-2 10-1 j / A c m -2
-2.0 -1.8 -1.6 -1.4 -1.2 -1.0 10-6 10-5 10-4 10-3 10-2 10-1
-2.0 -1.8 -1.6 -1.4 -1.2 -1.0 10-6 10-5 10-4 10-3 10-2 10-1 j / A c m -2
E/ V (Ag/AgCl)
-2.0 -1.8 -1.6 -1.4 -1.2 -1.0 10-6 10-5 10-4 10-3 10-2 10-1
E/ V (Ag/AgCl)
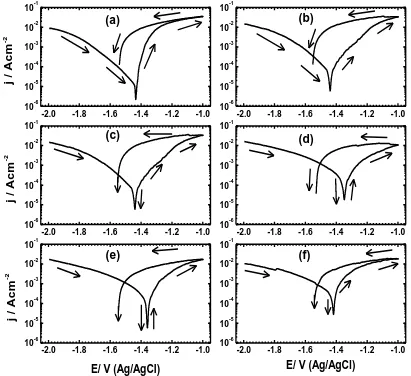
Figure 5. Cyclic potentiodynamic polarization curves obtained for the magnesium electrode coupled with nickel for (a) 0, (b) 10, (c) 15, (d) 20, (e) 30, and (f) 40 min, respectively after its immersion for 1 h in 3.5 wt. % NaCl solutions.
The cathodic reaction that takes place on Mg and its alloys has been reported [20] to be the hydrogen evolution as follows;
[image:6.596.90.501.266.642.2]
While, the anodic reaction is the rapid dissolution of Mg up on its immersion in the chloride test solution (Fig. 5a) according to the following equation [20];
2Mg = 2Mg2+ + 4e− (4)
The resulted Mg cations (Mg2+) react with the hydroxyl groups that presented in the solution and lead to the formation of Mg(OH)2 as follows;
2Mg2+ + 2OH‒ = Mg(OH)2 (5)
The formation of magnesium oxide can also take place in the anodic side of magnesium as follows [20];
Mg+ O = MgO (6)
[image:7.596.72.525.395.588.2]These reactions explain the reason for the high corrosion of Mg, where the polarization curve in the anodic branch shows an active dissolution of the alloy with increasing potential. It is obvious that the current in the backward direction recorded higher current values than those recorded in the forward direction (Fig. 5a), which could lead to the appearance of a big hysteresis loop. This indicates that the AZ31 suffered severe pitting corrosion. Moreover, the intersection between the current in the backward direction and the cathodic branch of the forward direction confirms that the pitting potential of the Mg alloy is more negative than its protection potential [21,22].
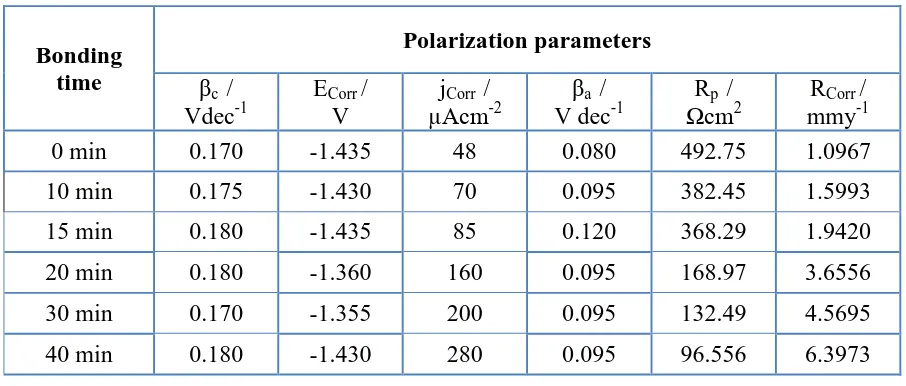
Table 1. Polarization parameters obtained from Fig. 5 for the different AZ31 electrodes.
Bonding time
Polarization parameters
βc / Vdec-1
ECorr / V
jCorr /
µAcm-2 βa / V dec-1
Rp /
Ωcm2 RCorr / mmy-1
0 min 0.170 -1.435 48 0.080 492.75 1.0967
10 min 0.175 -1.430 70 0.095 382.45 1.5993
15 min 0.180 -1.435 85 0.120 368.29 1.9420
20 min 0.180 -1.360 160 0.095 168.97 3.6556
30 min 0.170 -1.355 200 0.095 132.49 4.5695
40 min 0.180 -1.430 280 0.095 96.556 6.3973
increase of its content through increasing the bonding time. This was confirmed by the curves shown in Fig. 5 and the parameters depicted in Table 1.
3.2. Electrochemical impedance spectroscopy (EIS) measurements
0 50 100 150 200 250 300
-100 -50 0 50 100 150 200 (f) (e) (d) (c) (b) -Z " / cm 2 (a)
0 50 100 150 200 250 300
-100 -50 0 50 100 150 200
0 50 100 150 200 250 300
-100 -50 0 50 100 150 200 -Z " / cm 2
0 50 100 150 200 250 300
-100 -50 0 50 100 150 200
0 50 100 150 200 250 300
-100 -50 0 50 100 150 200 -Z " / cm 2
Z' / kcm2
0 50 100 150 200 250 300
-100 -50 0 50 100 150 200
[image:8.596.93.507.169.559.2]Z' / kcm2
Figure 6. Nyquist plots obtained for the magnesium electrode coupled with nickel for (a) 0, (b) 10, (c) 15, (d) 20, (e) 30, and (f) 40 min, respectively after its immersion for 1 h in 3.5 wt. % NaCl solutions.
[image:9.596.209.388.138.238.2]
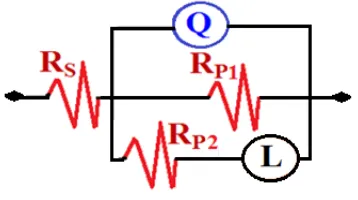
polarization resistance of the corrosion product layer that was formed on the surface of the AZ31 alloy with or without Ni coupled, and finally L accounts for the inductance.
Figure 7. Equivalent circuit model employed to the fit the data obtained by the EIS measurements.
[image:9.596.84.513.450.631.2]It is obvious from Fig. 6 that all samples show on semicircle and that the magnesium alloy, AZ31, with no Ni coupled (Fig. 6a) recorded the biggest diameter. Bonding Ni with Mg alloy for 5 min (Fig. 6b) led to decreasing the diameter of the semicircle, which indicates that the corrosion resistance decreases in the presence of Ni. Increasing the bonding time resulted in further decreasing in the diameter of the semicircle, where the smallest diameter was observed for the alloy that was coupled with Ni for 40 min (Fig. 6f).
Table 2. EIS data obtained by fitting the spectra shown in Fig. 6 with the circuit depicted in Fig. 7.
Bonding time
Kinetic EIS parameters RS /
Ω cm2
Q RP1 /
Ω cm2
RP2 / Ω cm2
L / H YQ / F cm-2 n
0 min 11.34 0.000041 0.80 276.2 125.1 144
10 min 11.22 0.000089 0.80 122.4 63.7 95.2
15 min 10.53 0.000123 0.80 66.73 54.4 80.63
20 min 9.67 0.000295 0.80 51.32 46.3 62.02
30 min 9.33 0.000336 0.80 30.87 39.7 37.57
40 min 9.11 0.000399 0.80 22.99 31.6 17.23
0.80 for all bonding periods of time [23,24]. The values of the CPEs increase with increasing Ni content by time and that was to cover the charged surfaces as a result of increasing the magnesium corrosion under the corrosive attack of chloride ions. Moreover, the inductive loop (L) provides a confirmation on the dissolution of the passive film and/or corrosion product layer at low frequencies even if the surface of the alloy develops thick oxide layers [24]. All impedance parameters indicated that the bonding of Ni with AZ31 Mg alloy led to a severe galvanic corrosion results in the rapid dissolution of Mg and this effect increases with bonding time.
10-1 100 101 102 103 104 105
100
101
102
103
(f) (e)
(d) (c)
(b)
|Z
|
/
cm
2
(a)
10-1 100 101 102 103 104 105
100
101
102
103
10-1 100 101 102 103 104 105
100
101
102
103
|Z
|
/
cm
2
10-1 100 101 102 103 104 105
100
101
102
103
10-1 100 101 102 103 104 105
100
101
102
103
|Z
|
/
cm
2
Frequency / Hz
10-1 100 101 102 103 104 105
100
101
102
103
[image:10.596.90.506.212.566.2]Frequency / Hz
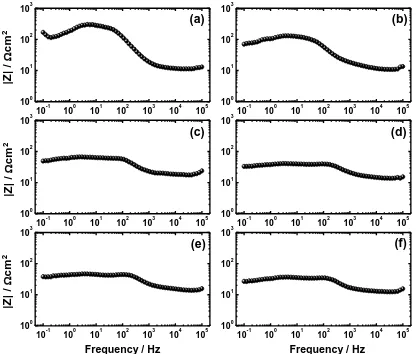
Figure 8. Bode impedance plots obtained for the magnesium electrode coupled with nickel for (a) 0, (b) 10, (c) 15, (d) 20, (e) 30, and (f) 40 min, respectively after its immersion for 1 h in 3.5 wt. % NaCl solutions.
angles () showed that the alloy which had no Ni (Fig. 9a) recorded the highest maximum degree of the phase angle (). Bonding Ni with and the increase of its content by the increase of bonding time decreased the maximum degree of indicating that bonding and the increase of its time increases the corrosion of the Mg alloy [25,26]. The EIS data thus confirm the results obtained from polarization curves that the presence of Ni by bonding it with Mg increases the corrosion of Mg and that effect increases by the increase of Ni content through increasing the bonding time from 5 min to 40 min.
10-1 100 101 102 103 104 105
-40 -20 0 20 40 60 80 (f) (e) (d) (c) (b) P h a s e a n g le / d e g . (a)
10-1 100 101 102 103 104 105
-40 -20 0 20 40 60 80
10-1 100 101 102 103 104 105
-20 0 20 40 P h a s e a n g le / d e g .
10-1 100 101 102 103 104 105
-20 0 20 40
10-1 100 101 102 103 104 105
-20 0 20 40 P h a s e a n g le / d e g .
Frequency / Hz
10-1 100 101 102 103 104 105
-20 0 20 40
Frequency / Hz
Figure 9. Bode phase angle plots obtained for the magnesium electrode coupled with nickel for (a) 0, (b) 10, (c) 15, (d) 20, (e) 30, and (f) 40 min, respectively after its immersion for 1 h in 3.5 wt. % NaCl solutions.
3.3. SEM and EDX analyses
[image:11.596.114.485.200.533.2]
10b indicates that the surface developed a thick layer of corrosion products. The presence of nickel, Fig. 10c, led to the presence of different layers of corrosion products, which were better clearer with increasing the surface magnification as shown in Fig. 10d. This indicates that the corrosion products were thicker in the alloy containing Ni due to the occurrence of galvanic corrosion, which does not occur with the Mg AZ31 that had no Ni bonded.
Figure 10. SEM micrographs obtained for the surface of (a) and (b) the Mg alloy AZ31 coupled with Ni for 0.0 min; (c) and (d) the Mg alloy AZ31 coupled with Ni for 40 min after 60 min immersion in 3.5% NaCl solution and performing potentiodynamic polarization measurements in the forward direction.
[image:12.596.94.502.180.499.2]
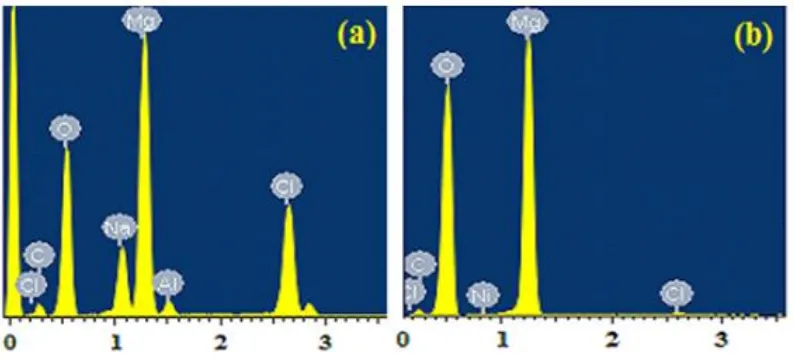
profile analysis for the magnesium AZ31 alloy that was coupled with Ni for 40 min, indicates that the percent of Mg was increased to 40.27 wt.% as well as the oxygen content was increased to 51.89 wt.%. This confirms that the corrosion product layers formed on the surface of the alloy were magnesium oxides. While, the percent of carbon was decreased to be only 7.19 wt. %, the chlorine was decreased to recorded the least percentage, 0.64 with no sodium appeared on the profile. The presence of Ni even with very small amount indicates that the surface of the alloy was fully covered by thick layers of the corrosion products, which were mainly magnesium oxides.
Figure 11. EDX profile analyses for the area shown in (a) SEM image (a) and (b) SEM image (c) depicted in Fig. 10 for the Mg alloy AZ31 bonded with nickel for 0 and 40 min, respectively.
4. CONCLUSIONS
[image:13.596.101.498.223.403.2]
ACKNOLEDGEMENTS
The authors are thankful to the financial and logistic support of King Abdullah Institute for Nanotechnology and the Deanship of Scientific Research, King Saud University, Riyadh, Saudi Arabia.
References
1. Manuel Marya, Louis G. Hector, Ravi Verma, and Wei Tong, Mater. Sci. Eng. A, 418 (2006) 341. 2. C.S. Roberts, Magnesium and Its Alloys, John Wiley and Sons, New York, 1960.
3. E.F. Emley, Principles of Magnesium Technology, Pergamon Press, London, 1966.
4. W. Walke, J. Przondziono, E. Hadasik, J. Szala, and D. Kuc, J. Ach. Mater. Manuf. Eng., 45 (2011) 132.
5. Yasumasa Chino, Tetsuji Hoshika and Mamoru Mabuchi, Mater. Trans., 47 (2006) 1040.
6. K.U. Kainer, P.B. Srinivasan, C. Blawert and W. Dietzel, Shreir’s Corrosion, Chapter 3.09 (2010) 2011.
7. M.E. El-Dahshan, A.M. Shams El Din and H.H. Haggag, Desalination, 142 (2002) 161. 8. B. Grosgogeat, L. Reclaru, M. Lissac and F. Dalard, Biomaterials, 20 (1999) 933. 9. A.N. AlHazza and El-Sayed M. Sherif, Int. J. Electrochem. Sci., 10 (2015) 4193.
10.A.M. Simões, A.C. Bastos, M.G. Ferreira, Y. González-García, S. González and R.M. Souto, Corros. Sci., 49 (2007) 726.
11.El-Sayed M. Sherif, Int. J. Electrochem. Sci., 6 (2011) 3077.
12.F. H. Latief, El-Sayed M. Sherif, A.A. Almajid and H. Junaedi, J. Anal. Appl. Pyrolysis, 92 (2011) 485.
13.El-Sayed M. Sherif and A.A. Almajid, Int. J. Electrochem. Sci., 6 (2011) 2131.
14.El-Sayed M. Sherif, A.A. Almajid, K.A. Khalil, H. Junaedi and H.F. Latief, Int. J. Electrochem. Sci., 8 (2013) 9360.
15.K.A. Khalil, El-Sayed M. Sherif and A.A. Almajid, Int. J. Electrochem. Sci., 6 (2011) 6184. 16.El-Sayed M. Sherif, Molecules, 19 (2014) 9962.
17.El-Sayed M. Sherif, A.A. Almajid, F.H. Latief and H. Junaedi, Int. J. Electrochem. Sci., 6 (2011) 1085.
18.El-Sayed M. Sherif, M.S. Soliman,E.A. El-Danaf, A.A. Almajid, Int. J. Electrochem. Sci., 8 (2013) 1103.
19.El-Sayed M. Sherif, Ind. Eng. Chem. Res., 52 (2013) 1884.
20.S. Bender, J. Goellner, A. Heyn and E. Boese, Mater. Corros. 58 (2007) 977. 21.El-Sayed M. Sherif, Int. J. Electrochem. Sci., 7 (2012) 4235.
22.El-Sayed M. Sherif, Int. J. Electrochem. Sci., 6 (2011) 5372. 23.El-Sayed M. Sherif, Int. J. Electrochem. Sci., 6 (2011) 2284.
24.N.S. Patel, P. Beranek, M. Nebyla, M. Přibyl and D. Šnita, Int. J. Electrochem. Sci., 9 (2014) 3951. 25.El-Sayed M. Sherif, J. Solid State Electrochem. 16 (2012) 891.
26.F. Mansfeld, S. Lin, S. Kim, and H. Shih, Corros. Sci. 27 (1987) 997.