The Dynamic Stark Effect in a J = 0 — > 1 —> 0
Three-Level System
by
Peter Thomas Holbrook Fisk
thesis submitted for the degree of Doctor of Philosophy of the Australian National University
Statement of authorship
The contents of this thesis, except where indicated by references, are entirely my own work.
Acknowledgements
I sincerely thank my supervisors, Dr H.-A. Bachor and
Dr R.J. Sandeman, for their carefully considered advice and opinions on all aspects of this work, and for their
wholehearted support of the project. Without their wealth of experience in both academic and bureaucratic matters, this work would not have been possible.
I am very grateful to Dr C.E. Dahlstrom, Dr E.K. Fisk and my fellow graduate student Peter Manson, for their thorough proof reading and constructive criticism of this thesis.
Finally, thank you to Jenny Garran, who spent many, many hours on the figures and proof reading of this thesis, and to
Abstract
The dynamic Stark effect was investigated in a J=0 —» 1 — » 0 three-level system in an atomic beam of natural barium. An intense, actively stabilized CW dye laser was tuned to resonance with the transition between the upper two levels, and a similar, but much less intense, probe laser was scanned through resonance with the transition connecting the lower two levels. Fluorescence arising from transitions out of the
middle and upper levels was separately recorded as a function of the probe laser frequency. This arrangement permitted the effects of the strong laser on the populations of both levels which it coupled to be investigated. The smooth transition from an Autler-Townes doublet to a single light-shifted peak was observed, as well as effects related to coherent
population trapping.
The resulting profiles were found to be in excellent agreement with theoretical predictions. With a theoretical model
extended to incorporate the five most abundant isotopes of barium, and other nonideal features of the experiment, it was possible to account for every significant detail of the
observed profiles.
Table of contents
Chapter 1: Introduction 1
1.1: Review of previous work 3
1.2: Outline of the present work 8
1.3: Arrangement of this thesis 11
Figures related to chapter 1 13
Chapter 2: Experimental details 15
2.1: Experimental design criteria 15
2.2: Experimental arrangement 16
2.3: Experimental procedure 20
Table 2.1 24
Figures related to chapter 2 25
Chapter 3: Results of the weak probe experiment 29
3.1: Isotope structure 29
3.2: Presentation and discussion of results 30
Figures related to chapter 3 34
Chapter 4: Theory of the weak probe experiment 40 4.1: Steady state response of the three-level system 44 4.2: Modelling of the isotopes with zero nuclear spin 62 4.3: Simplified model of the isotopes with nonzero
nuclear spin 63
4.7: Determination of the oscillator strength of the
middle —> upper level transition 77
Table 4.1 80
Figures related to chapter 4 81
Chapter 5: Extended model of the hyperfine structure
of the odd isotopes 95
5.1: Selection of basis and definition of notation 96 5.2: Matrix representation of the Liouville space
operators on the five-level basis 98 5.3: Fluorescence monitoring operators 102 5.4: Comparison of the two models of
hyperfine structure 104
5.5: Comparison of the five-level theory
with experiment 106
Figures related to chapter 5 108
Chapter 6: Investigation of the validity of
the weak probe model 113
6.1: Solution of the Bloch equations 114 6.2: The rectangular laser pulse model 118 6.3: The Gaussian laser pulse model 122 6.4: Comparison of line profiles predicted by the
weak probe/steady state and Bloch equation models 124
6.5: Conclusions 128
[image:6.558.68.508.43.808.2]Chapter 7: The three-level system perturbed by
two strong lasers 138
7.1: Experimental arrangement and procedure 139
7.2: Results 139
7.3: Theoretical description 140
7.4: Comparison of theory with experiment 142
Figures related to chapter 7 148
Chapter 8: Conclusion 162
Appendices
Appendix 1: The atomic beam system 166
Figures related to appendix 1 171
Appendix 2: The photomultipliers and
associated electronics 173
Figures related to appendix 2 176
Appendix 3: The data acquisition system 177
Figures related to appendix 3 180
Appendix 4: Laser beam diameter measurement 181
Figures related to appendix 4 184
Appendix 5: Bloch equations for a seven-level system 186
Chapter 1 1
Chapter 1: Introduction
In 1955, Autler and Townes demonstrated theoretically and experimentally that a molecular microwave transition can be split into two components if one of the levels involved in the transition is coupled to a third level by a strong
(saturating) radio-frequency field (Autler and Townes 1955). This splitting of the transition has become known as the
Autler-Townes effect, and is one manifestation of the dynamic Stark effect, or AC Stark effect.
Since the development of tunable lasers, the optical analog of this experiment has been carried out several times. These
experiments generally involved saturating the transition
between two atomic levels with a strong laser radiation field, and coupling one of the two levels involved to a third level, with a second, non-saturating 'probe' laser radiation field. The frequency of the strong field was held fixed, while the frequency of the probe field was scanned through resonance. Absorption or amplification of the probe field, or
fluorescence resulting from transitions out of the third level, was monitored as a function of probe laser frequency. This type of experiment generally resulted in a two-peaked spectrum, known as an Autler-Townes doublet.
Theory predicts that if the strong laser is tuned exactly to resonance, the separation of the two peaks of the
C h a p t e r 1 2
i n t e r a c t i o n b e t w e e n t h e a t o m a n d t h e s t r o n g l a s e r f i e l d , g i v e n ( i n Hz) b y ;
ß = ( U - E ) / h ( 1 . 1 )
w h e r e Jl i s t h e e l e c t r i c d i p o l e mome nt o f t h e d r i v e n
t r a n s i t i o n , | E | i s t h e e l e c t r i c f i e l d a m p l i t u d e o f t h e s t r o n g l a s e r f i e l d a n d h i s P l a n c k ’ s c o n s t a n t . T h e R a b i f r e q u e n c y i s t h e r e f o r e p r o p o r t i o n a l t o t h e s q u a r e r o o t o f t h e l a s e r f i e l d
i n t e n s i t y .
Th e c o m p a r i s o n b e t w e e n t h e o r e t i c a l p r e d i c t i o n s a n d t h e r e s u l t s o f e x p e r i m e n t s o f t h i s t y p e i n t h r e e - l e v e l s y s t e m s h a s s o f a r b e e n l i m i t e d t o c h e c k i n g t h e d e p e n d e n c e o f t h e s e p a r a t i o n o f t h e t w o c o m p o n e n t s o f t h e A u t l e r - T o w n e s d o u b l e t o n t h e
i n t e n s i t y a n d d e t u n i n g f r o m e x a c t r e s o n a n c e o f t h e s t r o n g p e r t u r b i n g l a s e r r a d i a t i o n f i e l d . T h e s e l i m i t a t i o n s w e r e d u e t o v a r i o u s e x p e r i m e n t a l d i f f i c u l t i e s , w h i c h w i l l b e d i s c u s s e d i n t h e n e x t s e c t i o n .
The p u r p o s e o f t h e w o r k d e s c r i b e d i n t h i s t h e s i s was t o
p r o v i d e a d e t a i l e d c o m p a r i s o n b e t w e e n t h e r e s u l t s o f t h e t y p e o f e x p e r i m e n t d e s c r i b e d a b o v e , a n d t h e p r e d i c t i o n s o f t h e a p p r o p r i a t e t h e o r e t i c a l t r e a t m e n t . T h i s c o m p a r i s o n i n c l u d e s n o t o n l y t h e d e p e n d e n c e o f t h e d o u b l e t s e p a r a t i o n o n t h e
Chapter 1 3
the shape of the resulting profiles, and to develop a
theoretical model for the experiment which takes into account all significant experimental details.
Although work such as this does not always produce exciting new results, its usefulness is to lay to rest questions concerning the ability of quantum mechanics to predict in detail the results of this type of experiment. If this can be achieved, future workers attempting to understand the
behaviour of more complicated systems, of which the dynamic Stark effect is but one aspect, may feel confident that their theory is at least describing this aspect of the system
correctly.
1.1 R e v i e w of p r e v i o u s w o r k
The simplest atomic system for the investigation of the dynamic Stark effect via the observation of Autler-Townes doublets is probably a J=0 — > 1 — > 0 three-level system, with the lower level being the ground state of the atom. A strong perturbing laser could be tuned to resonance between the lower two levels, and a weak probe laser could be scanned through resonance with the transition connecting the upper two levels. Recording the intensity of fluorescence from the uppermost level as a function of probe laser frequency should result in an Autler-Townes doublet, for sufficiently large intensities of the strong laser.
f
Chapter 1 4
populations of the levels, and hence the intensity of
fluorescence, is proportional to the probe laser intensity. Thus, a well understood linear interaction is used to ’probe' the unknown nonlinear interaction between the atoms and the strong laser.
Due to the limited tuning ranges of the lasers used in the pioneering experiments of this type, the atomic systems used were often very different to the ideal J=0 -4 1 —» 0 system.
Some classes of atomic systems which have been used in
previous experiments on the dynamic Stark effect are shown in fig. 1.1. The first observation of an Autler-Townes doublet in the optical regime was reported by Schabert, Keil and Toschek
(1975a, 1975b). Their experiment used a "V" system in neon (fig. 1.1c), in a helium-neon discharge. The technique of saturated absorption was used to record the Autler-Townes doublet in the sub-Doppler regime. This experiment showed, over the limited range of strong laser intensities which could be investigated, that the separation of the two components of the Autler-Townes doublet was proportional to the square root of the strong laser intensity. However, the complications introduced by using a nonlinear spectroscopic technique such as saturated absorption to investigate another nonlinear
optical phenomenon make this type of experiment unsuitable for a detailed investigation of the dynamic Stark effect.
Chapter 1 5
the other using a "V" system in xenon (Cahuzac and Vetter 1976).
In 1978, the effect on the Autler-Townes doublet of detuning the strong laser was demonstrated in a Doppler broadened three-level "ladder" system in a neon discharge (Delsart and Keller 1978). The same authors used a similar experiment to investigate the effect on the Autler-Townes doublet of the Zeeman degeneracy of the levels coupled by the strong laser
(Delsart and Keller 1980) .
It is clear from these experiments that in order to make a detailed, high resolution study of the effects mentioned
above, it is necessary to remove the complications introduced by Doppler broadening.
Most of the previous work in which an atomic beam was used to eliminate Doppler broadening was carried out using sodium, since it is cheap, readily available, convenient to prepare in an atomic beam and most importantly, it has transitions out of the ground state whose wavelengths fall within the tuning
curve of Rhodamine 6G laser dye. However, due to its nonzero nuclear spin, the energy levels of sodium are plagued by
hyperfine structure, so that in sodium the ideal J=0 — » 1 —> 0 three-level system is not available.
Chapter 1 6
and Pinard (1976). This experiment used a "ladder" system of levels in sodium (fig. 1.1a). A strong perturbing laser was tuned to resonance with the 3 S^/2 F=2 — > 3 P3/2 F=3
(589.0 nm) transition, and a weak probe laser was scanned through resonance with the 3 ^ 3 / 2 F=3 -> (616.2 nm) transition. The intensity of fluorescence resulting from transitions out of the 5 S ^/2 F=2 level was recorded as a function of probe laser frequency.
This experiment yielded asymmetric Autler-Townes doublets, in contradiction to theoretical predictions. The asymmetry was attributed to the presence of other hyperfine components in close proximity to all three levels involved in the
experiment. A theoretical analysis of the effects of hyperfine structure on these results was carried out by McClean and
Swain (1977). While these authors concluded that hyperfine structure should cause the Autler-Townes doublets to be asymmetric, the theoretical profiles were not in complete agreement with the experimental profiles.
In 1977 the results of a similar experiment were published by Bjorkholm and Liao (1977), but these results were also
complicated by the presence of hyperfine structure.
Chapter 1 7
achieved using a portion of the circularly polarized strong beam. The probe beam was also circularly polarized so that the
system of levels interacting with the lasers was;
32s1/2 F=2 M f=2 -> 32P 3/2 F=3 Mf=3 -> 42D 5/2 F=4 MF=4, where Mf denotes a magnetic quantum number.
Using this system, Gray and Stroud confirmed that if the strong laser was tuned to exact resonance, the separation of the two components of the Autler-Townes doublet was
proportional to the square root of the strong laser intensity, and that the dependence of this separation on the frequency of the strong laser was also in agreement with theory over the range of strong laser detunings investigated.
The principal limitation of this experiment was that the strong laser could not be detuned very far from resonance before the ground state optical pumping process became
inefficient, thus invalidating the approximation of regarding sodium as a three-level system. In their 1978 paper, Gray and Stroud showed only results where the strong laser was detuned less than five natural linewidths away from resonance and no comparison between the observed and theoretically predicted shape of the Autler-Townes doublet was given.
In the quest for a simpler atomic system, Delsart, Keller and Kaftandjian (1981) performed an experiment in a two level
Chapter 1 8
(553.5 nm) resonance line falls within the tuning curve of Rhodamine 110 laser dye, and is a J=0— >1 transition. The
counterpropagating strong and probe laser beams were linearly polarized in perpendicular directions so that the probe laser measured the splitting induced by the strong laser in the 6s2
•^Sq ground state.
The resolution of this experiment was limited by the
difficulty of distinguishing the fluorescence due to the probe laser (using phase sensitive detection) from the much more intense fluorescence (at the same wavelength) due to the strong laser. As a result, the comparison with theory, apart from the usual check of the dependence on the intensity and detuning of the strong laser, was qualitative.
1.2 Outline of the present work
In order to overcome the difficulties encountered in the previous work, and to achieve the goals set out in section
1.1, several requirements must be imposed on the system of atomic energy levels to be used, and on the experimental arrangement:
1) The levels used should be free of hyperfine structure.
2) A three-level system with two different resonance
Chapter 1 9
3) A J=0 — » 1 —» 0 system should preferably be used, for theoretical simplicity.
4) As in some of the previous experiments, the atoms should be prepared in an atomic beam, in order to avoid the
considerable complications introduced to the theoretical modelling of the system by Doppler broadening.
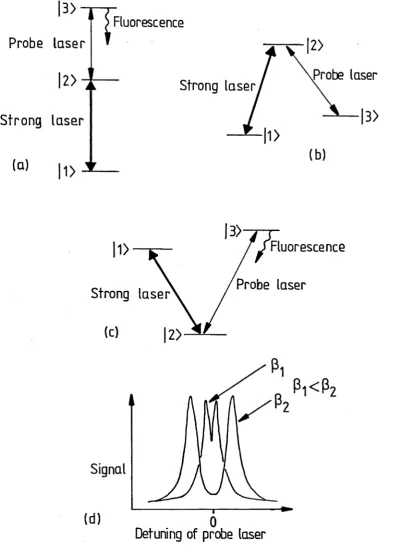
A system of levels in 138Ba, shown in fig. 1.2, was chosen for the present experiment. This system satisfies the first three of the above requirements. The lower (6s2 1Sq —> 6s6p 1P 1 , 553.5 nm) transition is the same as that used by Delsart and Keller for their two level experiment described in section 1.1. The upper (6s6p -^P], —» 6p2 3P Q , 608.3 nm) transition is not tabulated in the standard listings of transitions, and is not well known.
In contrast to the previous experiments in three-level systems in sodium (Picque and Pinard 1976; Bjorkholm and Liao 1977; Gray and Stroud 1978), the strong laser in the present
experiment was tuned close to resonance with the upper
transition, and the probe laser was scanned through resonance with the lower transition. This choice was made for two
reasons:
1) In the previous experiments, the profiles were broadened by the natural widths of both levels coupled by the probe
Chapter 1 10
resolution of the experiment was intrinsically higher.
2) In the present experiment, fluorescence from both levels coupled by the strong laser could be independently
monitored, using appropriate filters. This allowed a more detailed investigation of the effect of the strong laser on this system than was possible in the previous experiments.
A convenient feature of the three-level
(6s2 1S0 —» 6s6p 1P 1 —» 6p2 3P 0) system in 138Ba was that most of the population of the 6p2 3Pq level decays to the external 6s6p 3P X level, so that the population of the 6p2 3P Q level could be monitored by recording the 457.4 nm fluorescence resulting from this transition. This bypassed the experimental
difficulty of disinguishing the 608.3 nm fluorescence from light scattered from the strong laser beam.
One disadvantage of the 3 level system chosen for the present experiment is that the upper (6s6p 1P 1 —> 6p2 3P Q ,608.3 nm) transition, being an intercombination line, is relatively weak, with an oscillator strength of 0.0078±0.001 (the measurement of this oscillator strength is discussed in
section 4.7). This meant that tight focussing of the strong beam was necessary in order to achieve an intensity, and hence
a Rabi frequency, sufficient to produce an observable
Chapter 1 11
order to detect fluorescence only from atoms within a spatial region where the intensity of the strong laser was relatively constant.
Natural barium, which was used in the present experiment, consists of five isotopes in significant abundances, namely
(in atomic percent) 71.9% 138Ba, 11.2% 137Ba, 7.8% 136Ba, 6.5% 133Ba and 2.4% 134Ba. The isotopes with even mass number have zero nuclear spin, and hence no hyperfine structure. However, 137Ba and 135Ba have nuclear spin 1=3/2, so that the middle level of the three-level system in these isotopes consists of three hyperfine components, with total angular momentum F=l/2, 3/2 and 5/2, separated by approximately
200 MHz. In order to obtain an agreement in every detail
between theory and experiment, it was necessary to include all five isotopes in the theoretical model of the experiment. The theoretical modelling of the effect of the hyperfine
components in 137Ba and 135Ba was nevertheless a less difficult problem than the corresponding treatment (McClean and
Swain 1977) for the three-level systems previously used in sodium, since these exhibit hyperfine structure in all three levels involved.
Due to its very high cost and limited availability, it was not feasible to use isotopically pure 138Ba for the experiments described in this thesis.
1.3 Arrangement of this thesis
Chapter 1 12
chapter 2 with an explanation of the essential features of the experimental arrangement and procedure. Details of the major units of the experimental apparatus are presented in
appendices 1, 2 and 3. The results of the weak probe
experiment are presented in chapter 3. The theoretical model of the weak probe experiment is developed and compared with the experimental results in chapters 4 and 5, and in chapter 6 the assumptions and approximations made in this theoretical model are investigated.
While the weak probe experiment, with which the bulk of this thesis is concerned, is the simplest and therefore the most appropriate method of investigating the dynamic Stark effect in a three-level system, it is also of considerable interest to investigate the more complicated case where the populations of the atomic levels respond nonlinearly to both the strong and probe laser intensities. Such a situation is sometimes found in experiments where multi-step excitation using
narrowband lasers is used to maximize the population of a high lying atomic level.
Experimental investigations of this 'strong probe' regime have to date been only superficial (Gray and Stroud 1978), so in chapter 7 an experimental and theoretical investigation of this regime in the three-level system in ^ ^ B a is presented.
Chapter 1
|
3
>
-Probe la s e r
Fluorescence
13
|
2
>-S trong la s e r
(a)
id
-Probe laser
Strong laser
Fluorescence
Probe laser
Detuning of probe laser
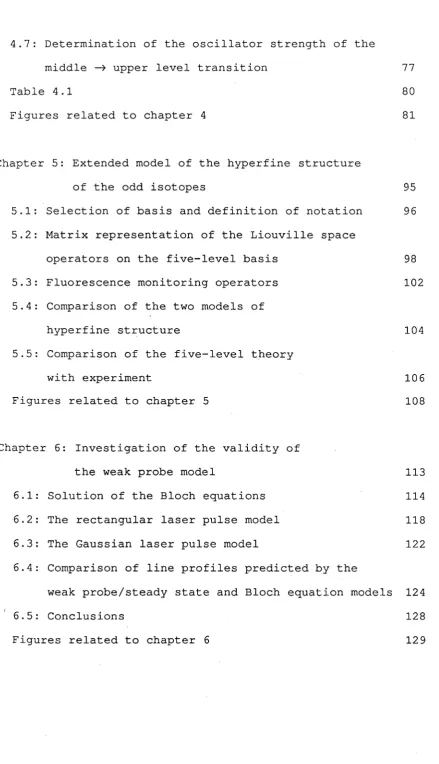
Figure 1.1: The three main configurations of atomic energy levels and
lasers used in previous observations of Autler-Townes doublets in the optica]
regime.
a) "Ladder" or "cascade" system
b) "Lambda" system
c) "V" system
d) Sketches of Autler-Townes doublets for two different Rabi frequencies ß.
These profiles may be observed in the probe laser absorption in all three
[image:20.558.72.470.67.616.2]C h a p t e r 1 14
608-3nm
Strong l a s e r
457-4 nm
Fluorescence
6s6p R.
5535nm
Fluorescence
553-5nm
Probe laser
6s
S
(Ground state)
6s6p^R
Figure 1.2:
System of levels in barium used for the
[image:21.558.62.498.130.619.2]Chapter 2 15
Chapter 2: Experimental details
The purpose of the ’weak probe' experiment described in this chapter was to investigate the dynamic Stark effect using the configuration of atomic energy levels and lasers shown in f i g . 1.2.
2.1 Experimental design criteria
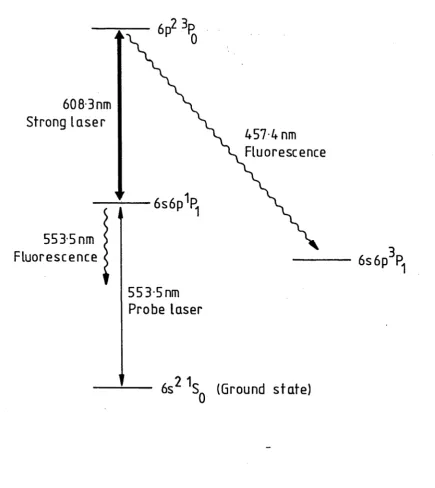
Figure 2.1 shows some relevent parameters of the atomic system used for this experiment, table 2.1 lists the sources and
uncertainties of these parameters, and fig. 2.2 shows
schematically the experimental geometry and detection scheme.
The primary considerations which went into the design of the experiment and the choice of the apparatus were as follows:
1) The barium atoms should be prepared in an atomic beam in order to eliminate the effects of Doppler broadening. The atomic beam system designed and constructed for this
experiment is described in detail in appendix 1.
Chapter 2 16
commercially available actively stabilized ring dye lasers, which provided a probe and strong beam with peak-to-peak frequency excursions of less than 1 MHz and 3 MHz
respectively, measured over a 10 second interval.
3) The diameter of the strong laser beam at the region of interaction between the atomic beam and the laser beams should be larger than that of the probe beam so that the observed 553.5 nm fluorescence is only due to atoms within the strong beam. The diameters of the two beams should be measured accurately so that the effects due to their
Gaussian intensity profiles may be included in the theoretical model of the experiment.
4) In order to simplify the atomic system further, both lasers should be linearly polarized in the same direction, so that only the AMj=0 Zeeman transitions are driven.
2.2 Experimental arrangement
The experimental arrangement is shown schematically in fig. 2.3. The atomic beam system, signal processing system and data recording system are described in appendices 1, 2, and 3
respectively.
The populations of the middle (6s6p 1P 1) and upper (6p2 3P Q) levels were independently monitored by recording the intensity of the fluorescence resulting from the 6s6p 1P 1 —> 6s2 -^Sq
Chapter 2 17
the probe laser was scanned. The two fluorescence wavelengths were separated using bandpass filters.
The beams from the two actively stabilized CW ring dye lasers (Spectra Physics SP380D and Coherent CR699-21) were
counterpropagating, with waists located at the interaction region, where they crossed the atomic beam. The waist
diameters of the strong and probe laser beams were 275±10 jlm and 225±15 [im (at the 1/e points in intensity) respectively, and were measured using a technique described in appendix 4. Both laser beams were linearly polarized in the z direction
(f i g . 2.2).
The two dye lasers were pumped by a single argon ion laser (Spectra Physics 171), operating in the multiline mode. The 12 Watt output of the ion laser was split into two portions by a 50% beamsplitter. The probe laser (SP380D) was operated using Rhodamine 110 dye (also known as Rhodamine 560), while the strong laser used Rhodamine 6G dye. The dyes for both lasers were dissolved in ethylene glycol at a concentration of
_ O
approximately 5x10 ° Moles/litre.
Chapter 2 18
laser Rabi frequency of 3 MHz. This proved to be sufficiently small compared with the natural linewidth of the resonance line to allow power broadening and other nonlinear effects due to the probe beam to be neglected.
The maximum available power of the strong laser, measured at the interaction region, was 125 mW.
Due to the very low intensity of the fluorescence from the atomic beam, photomultipliers combined with noise reduction electronics were required as detectors. The photomultipliers detected, through a lens mounted within the atomic beam
chamber, fluorescence emerging from the interaction region within a solid angle of 0.02*47t steradians, centred at 90° to the plane of polarization of the laser beams (fig. 2.2). The photomultipliers and associated electronics are described in appendix 2.
The thermal atomic beam was collimated by two 2 60±5 |fm pinholes separated by 10 cm. The counterpropagating laser beams crossed the atomic beam approximately 1 cm from the
second pinhole. The instrumental width of the probe
laser-atomic beam system was checked by scanning the probe laser through the resonance (553.5 nm) transition with the strong laser switched off. After careful adjustment of the angle between the probe beam and the atomic beam, profiles with a full width at half maximum (FWHM) of less than 23 MHz were consistently obtained. Since the natural width of the
Chapter 2 19
instrumental broadening of less than 4 MHz. This broadening was probably due to the combined effects of residual Doppler broadening (resulting from the finite divergence of the atomic beam), laser frequency jitter, isotope structure, and possibly residual power broadening.
In order to obtain a zero detuning reference point for each probe laser scan, a portion of the probe beam was passed
through the atomic beam in a secondary interaction region and the resulting fluorescence was recorded during each scan. The secondary interaction region was located 40 cm ’downstream* of the primary interaction region, corresponding to an average time of flight of approximately 900 |ls between the two
regions. This time of flight was sufficient for any effects on the atoms due to the strong and probe lasers to have decayed. The detuning of the probe laser was measured from the peak of the profile obtained from the secondary interaction region. The 553.5 nm fluorescence from the primary interaction region could not be used for this purpose due to the perturbing
effect of the strong laser.
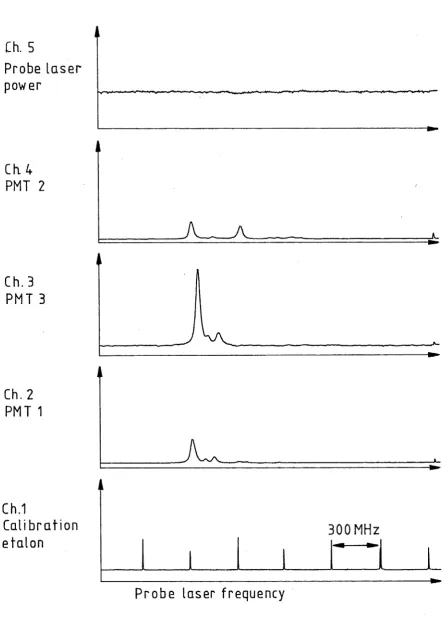
To facilitate a detailed comparison between the experimental and theoretical profiles, a 5 channel data acquisition system, based on an analog to digital converter, was constructed. This system was interfaced to a microcomputer, which was then used to transfer the data to a mainframe computer for analysis. The data acquisition system is described in detail in appendix 4.
Chapter 2 20
fluorescence signals, the transmission of a 300±1 MHz free spectral range etalon for calibration of the probe laser scans, and the probe laser power. Recording the probe laser power during each scan was necessary since the lifetime of the Rhodamine 110 dye used in the probe laser was fairly short
(about 3 full days use), so that for much of the time the long term (greater than 10 minutes) power stability of the probe beam was poor. Since the amplitudes of all the profiles were
linear in the probe beam intensity, the recorded probe laser power was used to correct for these power variations, thus enabling profiles recorded at different times to be compared. The recorded probe laser power was also used, in conjunction with the signal from the secondary interaction region, to correct each profile for variations in the atomic beam intensity.
The signal from the secondary interaction region could not be used to monitor the probe laser power because it was not
possible to obtain an acceptable signal to noise ratio while maintaining a linear relationship between the amplitude of this signal and the probe laser intensity. This limitation was due to scattered laser light within the confined space of the
secondary interaction region.
A typical datafile recorded by the data acquisition system during a single probe laser scan is shown in fig. 2.4.
2.3: Experimental procedure
Chapter 2 21
that the probe laser intensity (7.5 mW/cm^, corresponding to a Rabi frequency of 3 MHz) was sufficiently low so as to
introduce no significant nonlinear effects of its own, such as power broadening. This was done firstly by measuring the probe laser intensity dependence of the FWHM of the profiles
obtained by scanning the probe laser through the resonance line with the strong laser switched off. It was found that lowering the probe laser Rabi frequency below 5 MHz produced no measurable change in the FWHM of these profiles, although it significantly reduced their signal to noise ratio.
The second test involved tuning the probe laser to line centre, again with the strong laser switched off, and measuring the dependence of the resulting fluorescence
intensity on the probe laser intensity. No deviation from linearity could be found in this dependence with Rabi frequencies below approximately 5 MHz. Therefore, it was concluded that with the probe laser intensity used in this experiment, the interaction between the atoms and the probe laser could be regarded as linear to a good approximation.
A typical experimental run consisted of recording a series of probe laser scans, each with a different detuning of the
strong laser from the centre of the 608.3 nm line. The strong laser intensity would then be changed, and another series of scans would be recorded.
Chapter 2 22
then adjusting the frequency of the strong laser to maximize the fluorescence from the upper level, with neutral density filters inserted into the strong beam to reduce its intensity to the linear regime. The strong laser could thus be tuned to resonance within ±5 M H z .
The detuning of the strong laser from line centre was set using its calibrated control electronics. The calibration was checked against the 300±1 MHz free spectral range etalon
before and after the experiment. At the end of each series of scans, the frequency drift of the strong laser was measured by again tuning the probe laser to line centre with the strong beam blocked, and using the calibrated detuning knobs to tune the strong laser back to line centre. The frequency drift was therefore given by the difference between the settings of these knobs at the beginning and end of the series. A typical series of 11 scans of 100 s each normally took 25 minutes to complete. The strong laser drift during this time was normally about 40 MHz. This drift was probably due to thermal variation in the length of the reference cavity to which the frequency of the strong laser was locked, since any laser mode hops would result in frequency changes of the order of the free spectral range of this etalon, which was 500 MHz. This drift was assumed to be linear in time, since it was invariably towards longer wavelengths, corresponding to a gradual
expansion of the reference cavity. The strong laser detuning for each scan was therefore corrected accordingly. This
Chapter 2 23
The axial alignment of the two laser beams was set by tuning both lasers to line centre, and adjusting the horizontal and vertical position of the strong beam until a local minimum in the upper level fluorescence intensity was found. At this point the axes of the two beams were coincident, since the proportion of the signal due to those atoms with the maximum Autler-Townes doublet separation (at the centre of the strong beam) was maximized by probing them with the centre of the probe beam. Using a calibrated mount on the lens used to shift the strong beam, it was estimated that the two beams were
Chapter 2 24
P a r a m e t e r V a l u e S o u r c e
Oscillator strengths (f)
6s2 ^Sq —> 6s6p 1.64±0.005 a
6s6p 1P 1 —> 6p2 3P 0 0.0078+0.001 b
Lifetimes (T)
6p2 3P 0 6.2±0.4 ns c
6s6p 1P 1 8.37±0.08 ns d
Cross relaxation rates (O)
6s6p ^P-j_ —> 6s2 ^Sq > 18.97 MHz a
6p2 3P0 —> 6s6p 1P 1 0.67±0.09 MHz b
6p2 3P 0 —> 6s6p -^P-^ 21±? MHz e (See note 1) 6s6p 3P X —> 6s2 1S0 0.047±0.01 MHz f
Sources
a Jahreiss and Huber (1985) b This work, section 4.7 c Hannaford and Lowe (1985) d Kelly and Mathur (1977) e Huber and Niggli (1985) f Wiese and Martin (1980)
Note 1
This value was obtained using the lifetime (measured by Hannaford and
2 2
Lowe 1985) of the 6p Pq level and the first of the following
preliminary branching ratios for transitions out of the 6p2 3Pq level,
provided by Huber and Niggli (1985) :
Transition
^ 0 6s6P ^ 1
6p, ,po -» 5d6p :D i 6p^ ^Pq -> 6s6p iP1
Branching ratio
0.82±2%
0.11±10% 0.07±10%
However, these branching ratios are not consistent with the cross
2 2 1
relaxation rate obtained in section 4.7 for the 6p Pq —> 6s6p P-j_
transition. Possible reasons for this discrepancy are discussed in section 4.7.
[image:31.558.56.486.70.710.2]Chapter 2 25
— 6p
P
(Upper leve l)
X = 6-2ns,Y = 26 MHz
ct
=0 22 MH
z6083 nm
Strong laser
f =0 0078
° -
21 MHz (457-4 nm)
6s6p R
6s
(Ground state)
Figure 2.1: System of levels in barium used in the
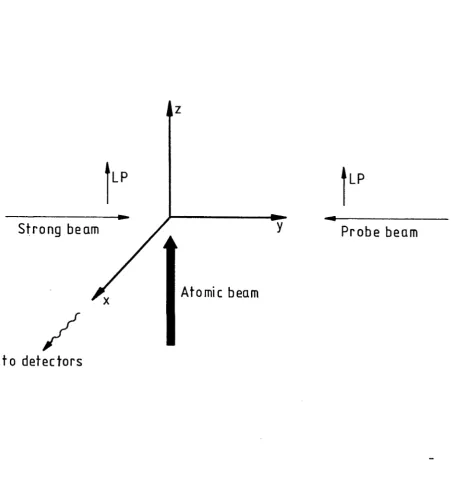
[image:32.558.69.479.84.550.2]Chapter 2 26
Z
to detectors
Probe beam
Figure 2.2: Geometry of the experiment. The strong and probe laser beams propagated in the y and -y directions
respectively, and were linearly polarized in the z direction. The atomic beam propagated in the z direction, and the
[image:33.558.51.515.118.601.2]C h a p t e r 2 27
2
:
o
0
P P •
(0 c0 CD
CD O
Td C C
0 *H CD
CO r—1 0
P CO
II CD
CO cu P
c PI O
0 P
-H 1— 1
P p 4-1
(0 CD
"H P p P
> 1—1 0 C
CD -H p CD P 4-1 -H CO
P G CD
P £ O P
(0 C £ a CD
(D P P
P • CD
H r~ S CO
LO O CD
• a G
4-> •H
a II 11 1—1
0 CM 2
6 Cm P
-H CD
P •x.
CD p P O a CD CD P
P P P CD H r—1 cd
-H -H
CD 4h 4-1 P
P CD
P £ P
G P CO
4-1 *H cd O 10 CO P
• G
£ CO CD 0
cd LD Td p
P LO £1
O ' H cd II cd •
•H C--1 p p
P Eli P 0
P -H
p CD 1—1
u P G a
0 CD -H
•—1 P II P
CQ P a •--1
“H s P
• • •—1 £
m a s. O
• CO p P
Cvl £ CD O
cd N P
a> CD •H f t
P P P
3 cd II
O ' II 1—1 £
■H CO O 2
Chapter 2
28
Ch. 5
Probe l a s e r
power
Ch. U
PMT 2
Ch. B
PMT 3
Ch. 2
PMT 1
Ch.1
Cal i br at i on
etalon
L
1
500 MHz
r 1!
i
Probe laser frequency
[image:35.558.57.503.76.713.2]Chapter 3 29
Chapter 3: Results of the weak probe experiment
In this chapter the results of the 'weak probe' experiment described in chapter 2 are presented. In order to avoid confusion in interpreting the experimental results, this chapter begins with a discussion of the effects of isotope structure on the profiles.
The comparison between these results and the theoretical predictions will be presented in chapters 4 and 5.
3.1 Isotope structure
Isotope shifts and hyperfine splittings for the five most abundant isotopes of barium are shown in fig. 3.1 (Nowicki, Bekk, Goring, Hanser, Rebel and Schatz 1978). The net effect of these shifts on the experimental profiles was to add spurious peaks, or to change the shape of the peaks due to 138Ba when they were coincident with an isotope peak. However, in most cases the peaks due to 138Ba could be easily
identified against the background due to the less abundant isotopes.
Chapter 3 30
frequency side of the 138Ba peak are due to the less abundant isotopes of barium, and the hyperfine structure in the middle level of the odd isotopes.
The experimental profiles were also affected by the isotope shifts of the upper level of the three-level system. The
isotope shifts for this level are also all on the high energy side of the upper level in 138Ba. Since the upper level has electronic angular momentum J=0, there is no hyperfine structure in the upper level of the odd isotopes.
3.2 Presentation and discussion of results
Throughout this thesis, unless otherwise stated, the detunings from line centre of the strong and probe lasers (8„ and 5^) will be defined by;
8S = Vs - V (6s6p 1P1 — » 6p2 3P 0) (3.1)
5p = vp - v (6s2 1S0 -» 6s6p 1P 1) (3.2)
where v_ and V_ are respectively the frequencies of the strong and probe lasers, and V(6s6p 1P 1 — » 6p2 3P Q) is the resonant frequency (corresponding to the centre of the spectral line) of the unperturbed middle —> upper level transition in 138Ba. The frequency V(6s2 1Sq —> 6s6p ip^ is defined correspondingly.
Chapter 3 31
doublet becomes strongly asymmetric, as one of the peaks is shifted towards the two-photon resonance, where the sum of the detunings of the two lasers is zero. The remaining peak
gradually approaches the unperturbed position. The smaller structure around the larger peaks in both the upper and middle level profiles is due to the less abundant isotopes of barium.
The profiles obtained in the middle level fluorescence are markedly different from their upper level counterparts. The primary difference is that at the two-photon resonance, the middle level population is strongly suppressed. The
Autler-Townes doublet is again clearly visible when the strong laser is tuned close to resonance, but as the strong laser is detuned, the peak which is shifted towards the two-photon
resonance rapidly disappears. At large strong laser detunings, the profile is virtually unaffected by the strong laser, and the smaller peaks are entirely due to isotopes other than 138B a .
In chapter 4 it will be shown that the suppression of the middle level fluorescence at the two-photon resonance is related to the coherent population trapping effect. This effect has been observed in 'lambda' systems (Alzetta,
Gozzini, Moi and Orriols 1976; Gray, Whitley and Stroud 1978), and predicted in three-level 'ladder* systems similar to that in 138Ba, but where the middle level decays much faster than the other two levels (Radmore and Knight 1982). If the two lasers have suitable intensities and are both tuned to
Chapter 3 32
from, the middle level is almost zero, and the population is 'trapped' in a coherent superposition of the other two levels.
Figures 3.4 and 3.5 show similar series of profiles, but with smaller strong laser Rabi frequencies. These profiles exhibit smaller Autler-Townes doublet separations when the strong laser is tuned to line centre, and a more rapid decrease in the amplitude of the upper level profiles as the strong laser is detuned.
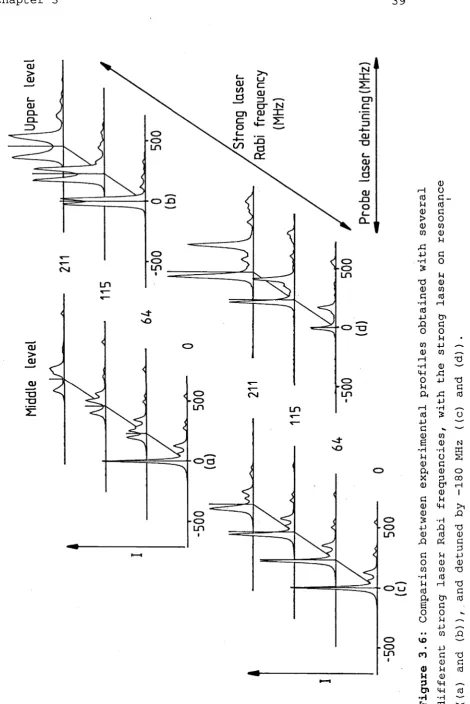
Figure 3.6 shows a comparison of experimental profiles
obtained with several different strong laser Rabi frequencies, with the strong laser on resonance and detuned. In fig. 3.6c, where the strong laser is detuned from resonance, the light
shift of the middle level profile becomes clearly visible as the strong laser Rabi frequency is increased.
The choice of an appropriate definition for the strong laser Rabi frequency was complicated by the Gaussian intensity profile of the strong beam. Since the diameter of the probe beam at the interaction region was not vanishingly small compared with that of the strong beam, the observed signals represented the integral over a range of strong laser
intensities. As a result, the Autler-Townes doublet
Chapter 3 33
the strong laser Rabi frequency. Therefore, all strong laser Rabi frequencies quoted in this chapter are those
corresponding to the peak of the intensity profile of the strong beam. The determination of the strong laser Rabi frequency is explained in section 4.6.
It was not possible to overcome the above difficulty by
increasing the diameter of the strong beam at the interaction region, since, due to the weakness of the middle
level —> upper level transition, it would then have been impossible to achieve a useful strong laser Rabi frequency. Reducing the diameter of the probe beam resulted in an unacceptable signal to noise ratio, since a corresponding reduction in the probe beam power was required to avoid power broadening and other nonlinear effects due to excessive probe
Chapter 3
34
ON c m m CM Ö C D m NO o m
r-<t CM l a m
c m CM m NO ö OQ LA m C M X ii LL_
CM CM
X X
m l a
II II LL_ LL_
On CN CM m no ON CM
CM LA LA C - PA L A CM MD
[image:41.558.55.512.35.786.2]C h a p t e r 3 3 6 < TS G cü co <D I—I -H 4-1 O M a
er
le
ve
l
>1 ü g CD . P N er X CD s P m o*— i
-H +1
X3 cd CO
x -H
p CO
CD C d
CO C
cd -H i— 1 G
P C d -P
C CD O X5 P 4-> P CO CD CO cd cd 1— 1 X! -P Cd -H G O P TJ -P CD CO c -H CD cd X -P -P X3 O C -H CO CD >i 1-1 -P
-H G 4-1 •H O cd P -P a p CD c-1 ü
C h a p t e r 3 38
-3
0
0
0
3
0
0
-3
0
0
0
3
0
0
Pr
o
be
la
s
e
r
d
e
tu
n
in
g
(M
H
z
Chapter 4 40
Chapter 4: Theory of the weak probe experiment
In this chapter, the theoretical modelling of the weak probe experiment described in chapter 2 is presented.
The general theory of three-level (weak probe) optical double resonance has been treated by Whitley and Stroud (1976) and others (for reviews of this work see Shen 1984/ Knight and Milonni 1980, and references therein). However, the case
corresponding to the present work, where a ladder system was subjected to a weak probe laser radiation field tuned to the lower transition and a strong field tuned to the upper
transition, does not appear to have been studied theoretically in the context of determining the populations of the levels as functions of the relevant parameters.
Since the experiment involved recording the fluorescence intensity due to spontaneous transitions from the middle and upper levels of the three-level system, the theoretical
treatment of the experiment involved calculating the populations of these levels as functions of the relevant parameters. This is most easily achieved using the density operator formalism, because the detectors recorded the total fluorescence due to a large number of atoms simultaneously interacting with the laser radiation.
Chapter 4 41
involves writing down the equations of motion (Bloch
equations) for the density operator, and solving them either for the time development of the density operator (Whitley and Stroud 1976), or for the steady state response at time t=<*>, where an analytic solution is possible (Whitley and
Stroud 1976; Knight and Milonni 1980). In the experiments described in this thesis, the transit time (600 ns) of the atoms across the region of interaction with the laser fields was approximately a factor of 70 greater than the lifetime of the middle level (8.4 ns), and a factor of 100 greater than the lifetime of the upper level (6.2 n s ) . A solution of Bloch equations for the steady state response of the density
operator was therefore appropriate to this work.
The diagrammatic method of Ben-Reuven and Klein was chosen for solving the Bloch equations (Ben-Reuven and Klein 1971; Klein, Giraud and Ben-Reuven 1974). This method was used to obtain an analytic solution for the steady state response of the density matrix for an ensemble of 3LSs in the weak probe regime. In order to compare the experimental results with the theoretical predictions in detail, the solution was integrated numerically over the spatial intensity profiles of the laser beams, and summed over the different isotopes of the atoms. For the weak probe experiment, the amount of computer time required to carry out an extensive comparison in this way would have been prohibitive without an analytic solution. The principal
advantage of the method of Ben-Reuven and Klein over others which also yield an analytic solution is that it may be
Chapter 4 42
system similar to that shown in fig. 4.1, but where the middle level is replaced by two or more closely spaced levels. This extension, applied to the modelling of the hyperfine
components of the middle level of the isotopes with nonzero nuclear spin (137Ba and 135Ba), is described in chapter 5. Although an analytic solution for such a system is also
possible, some numerical evaluation (such as matrix inversion) was left to a computer.
Initially, a system of three atomic energy levels, |a>, |b> and |c>, shown in fig. 4.1, corresponding to the experimental system in 138Ba, will be considered. The upper level |a> and the ground state |c> were assumed to have angular momentum J=0, while the middle level |b> was assumed to have J = 1 . Two near-resonant CW laser radiation fields, the 'strong' field and the 'probe' field, were assumed to be tuned close to the two electric dipole allowed transitions of the system. The two
laser fields were assumed to have frequencies V_ and v_ , and
s p
to drive the |b> — » | a> and | c> — > |b> transitions with Rabi frequencies ßs and ßp (as defined in equation 1.1)
respectively.
The two resonant frequencies of the 3LS were assumed to be distinct, that is, the difference between the resonant
frequencies Vbc and Vab of the two transitions ( | c> — > |b> and |b> — > |a>) was assumed to be much greater than the natural widths ya and Yb of the levels. Also, the two lasers were assumed to be quasi resonant with their respective
Chapter 4 43
I Vp—Vbc I « I vbc-^ab I ' The bandwidths of the lasers were assumed to be negligible compared with the natural linewidths of the transitions. These conditions, which imply that each laser
field drives a particular transition in the 3LS, were all well satisfied in the experiment.
The system was not assumed to be closed, that is, the middle and upper levels were permitted to have decay channels outside
the 3LS, so that G ab < Ya anci a bc - Yb*
In the experiment, the polarizations of the lasers were chosen so that only the AMj=0 transitions were driven. This allowed the Zeeman degeneracy of the middle level to be neglected in the theoretical treatment, since atoms which relaxed from the upper level to the Mj=±l Zeeman sublevels of the middle level would then relax to the ground state without further
interaction with the strong laser. Due to the low intensity of the probe laser, the probability that any atom will interact a
second time during the 600 ns required to traverse the
interaction region was assumed to be negligible, so that any memory effects due to this or any other relaxation path to the ground state could be ignored. The validity of this assumption
is discussed in chapter 6.
The calculation begins in section 4.1 with the choice of a suitable representation for a semiclassical radiation field,
Chapter 4 44
density operator is obtained. The Liouville equation is then solved for the steady state response of the diagonal density matrix elements (populations) using the method of Ben-Reuven and Klein. This yields an analytic solution for the case where one of the two radiation fields (the probe field) is
sufficiently weak so that the populations are proportional to the probe field intensity. In sections 4.2 and 4.3 the effects of isotope structure, and the hyperfine structure of the
isotopes with nonzero nuclear spin, are included in the model using a simple technique which neglects coherences (off
diagonal density matrix elements) between the hyperfine components of the middle level.
Corrections due to the geometry of the detection system are considered in section 4.4, and in section 4.5 the integration over the Gaussian intensity profiles of the two laser beams, and over the cylindrical profile of the atomic beam, is described. In section 4.6 the results of these calculations are compared with the experimental line profiles. Finally, in section 4.7 a measurement, resulting from this comparison, of the absorption oscillator strength of the 6s6p 1P 1 — » 6s2 3P Q transition is presented.
4.1 Steady state response of the three-level system
C h a p t e r 4 45
c c
P
a=
E
E
PAij I
i><31
(4.1)i=a j=a
w h ere
pA i j
r e p r e s e n t s a m a t r i x e l e m e n t ofp A .
The c o m p l e t e d e n s i t y o p e r a t o r
p s
for the s y s t e m c o n t a i n s a f i e l d c o m p o n e n tp F
. For systems w h e r e the atoms haven e g l i g i b l e effect on the a p p l i e d fields ('no b a c k reaction'
assumption),
p s
m a y be written:The tw o r a d i a t i o n f ield modes shall be d i s t i n g u i s h e d b y the
s u b s c r i p t
X,
w h e r eX=1
refers to the p r obe field w h i c h ist u n e d close to r e s o n a n c e w i t h the |c> — > |b> t ransition, and
X=2
refers to the s t r o n g field, w h i c h is t u n e d close tor e s o n a n c e w i t h the |b> — > |a> transition.
The r a d i a t i o n fields, b e i n g p r o d u c e d b y lasers p u m p e d well
above threshold, are a s s u m e d to be in c o h e r e n t states | a^>
(Loudon 1973, c h . 7). The two fields are a s s u m e d to be
u n c o r r e l a t e d a n d m o n o c h r o m a t i c . The a b s e n c e of b a c k r e a ction
m e ans that the states of the tw o r a d i a t i o n fields are not
a l t e r e d by i n t e r a c t i o n s wi t h the atoms. This implies that
I 0C^|2 » 1. Therefore;
Ps “ Pa Pf (4.2)
2
P
f= n lak><akl
X=i
C h a p t e r 4 46
or, in terms of the h a r m o n i c o s c i l l a t o r n u m b e r states |n^>;
2
PF = n exp (- I <XjJ 2 )
X=l
E E
|gx l exp{icp^(n^-mx) } In^XmjJK
!n
^ !)1/2(4.4)
w h e r e is a c o m p l e x n u m b e r w i t h p h a s e (p^ d e s c r i b i n g th e
state of the f i e l d m o d e
X,
an d the o c c u p a t i o n n u m b e r s of theh a r m o n i c o s c i l l a t o r states are n^ an d m^.
The i n t e n s i t y of the f l u o r e s c e n c e e m i t t e d fr o m a s y s t e m whose
d e n s i t y o p e r a t o r is
ps
is g i v e n by the e x p e c t a t i o n v a l u e ofthe f l u o r e s c e n c e m o n i t o r i n g o p e r a t o r L F (Corney 1977, p. 503) :
LF = ]£ a-JA lixil a*-li
(4.5)
The s u m m a t i o n is c a r r i e d out over the final (atomic) states of
the s p o n t a n e o u s t r a n s i t i o n s c a u s i n g the f l u o r e s c e n c e . In
e q u a t i o n 4.5 a co n s t a n t of p r o p o r t i o n a l i t y has b e e n d r o p p e d
for simplicity, e is the p o l a r i z a t i o n v e c t o r of the
f l u o r e s c e n t light and Jl is the e l e c t r i c d i p o l e o p erator. The
e x p e c t a t i o n v a l u e < L F> of the f l u o r e s c e n c e m o n i t o r i n g o p e r a t o r
is g i v e n by;
< L p> = T r ( p s Lf ) (4.6)
where the t r a c e is t a k e n over b o t h the a t o m and field
C h a p t e r 4 47
In the 3LS shown in fig. 4.1, < L F> is s i m p l y p r o p o r t i o n a l to the d i a g o n a l a t o m i c d e n s i t y m a t r i x e l e m e n t s (populations)
pAaa
and of the u p p e r a n d m i d d l e l e v e l s . The p r e s e n c e ofc o h e r e n c e s b e t w e e n the h y p e r f i n e c o m p o n e n t s of the m i d d l e levels of the od d i s o topes p r o d u c e s a d d i t i o n a l t e r m s in < L F> i n v o l v i n g off d i a g o n a l d e n s i t y m a t r i x elements.
The e q u a t i o n of m o t i o n (Liouville equation) for the d e n s i t y o p e r a t o r
p
m a y be written;w h ere the dot d e n o t e s d i f f e r e n t i a t i o n w i t h re s p e c t to time, the square b r a c k e t s r e p r e s e n t the c o m m u t a t o r product, E is an o p e r a t o r g o v e r n i n g r a d i a t i v e d a m p i n g of b o t h d i a g o n a l
(populations) an d off d i a g o n a l (coherences) a t o m i c d e n s i t y m a t r i x e l e m e n t s a nd TT is P l a n c k ' s c o n s t a n t d i v i d e d b y 2k. In an i n t e r a c t i o n p i c t u r e w i t h r e spect to the r a d i a t i o n fields, the H a m i l t o n i a n H(t) c o n s i s t s of an ato m i c part and a time d e p e n d e n t i n t e r a c t i o n part:
The c o m p o n e n t s of the H a m i l t o n i a n in the r o t a t i n g wave and
e l e c t r i c d i p o l e a p p r o x i m a t i o n s are d e f i n e d as follows;
p s
= (i TT)"1 [H(t
) ,p s ] - X p s
(4.7)Chapter 4 48
HAtom li> = Ei 'i;> i=a,b,c
2 Hint't)“
\L
X=1
EC
0
X]1/2
( e i ( °x t £ ' x - (^bc c \ l b > < c ll2e0V
J
- Hermitian conjugate }
+ U ab CXIa><bI)
(4.9)
where E i is the energy of the atomic state|i>, and Ec= 0 . The symbols CO^ and e'^ are respectively the angular frequency and polarization vector of the incident field mode
X,
eQ is the permittivity of free space, and V is the quantization volume. The annihilation and creation operators for the mode X are c^ and c 1^, and j=<i I J! I j> is the matrix element of the electric dipole operator for the | j> —> | i> transition.Expanding equation 4.7 gives the well known Bloch equations, which may be solved directly for the time development of the density operator.
It is now convenient to transform this problem to Liouville space, where each vector represents a Hilbert space operator
(for a summary of the essential properties of Liouville space see Dalton 1982) . The Liouville space basis vector | i j+» is defined in terms of the corresponding Hilbert space operator:
|ijf» = I i x j I (4.10)